Introduction
A fundamental research interest of the present dissertation was to run a pilot test on a small sample (more than thirty participants) to assess the possibility of using questionnaires as a tool to assess Saudis’ perception of dietary habits as predictors of colorectal cancer development. In other words, the relationships — and the possibility of exploring them through questionnaires — between dietary habits and the diagnosis of colorectal adenocarcinoma were explored. In fact, dietary habits are an essential component of patients’ lifestyles, and many studies have focused on their impact on cancer (Smith et al., 2019). However, in the region of Saudi Arabia, the number of reliable case studies establishing a relationship between the two variables appears to be low. It is for this reason that this dissertation benefited from a pilot test on a small sample to assess the feasibility of a survey questionnaire before scaling up.
The data used for the analysis were the results of an online questionnaire administered using the Google Forms platform. The questions were preliminarily derived from a benchmark survey, as specified in the Methodology. The link to participate in the survey was distributed among familiar respondents — convenience sample — via WhatsApp; each participant was invited to answer twenty questions formally divided into three blocks. The first block assessed the respondent’s willingness to participate in the survey, so it was a dichotomous yes/no level value. Notably, this question was not strictly necessary and was actually a digital signature signifying willingness to participate in the survey. Looking ahead, only one of the subjects responded negatively to this question and then gave no responses to the others. Given the mandatory nature of the answers, it is likely that the individual closed the web tab and did not return to the test; his or her answers were not taken into account in processing, and thus he or she was excluded from the analysis.
The second block was represented by the sociodemographic characteristics of the respondents. This included age, gender, social status, level of education and current occupational orientation, and average monthly income. In addition, this section included the respondent’s body mass index (BMI) as a characteristic of his or her belonging to specific weight categories. The following twelve questions in the third block were based on the Likert scale, in which the respondent is invited to measure their agreement or disagreement with specific statements. Thus, the variables in each of the twenty questions were based on a nominal scale unrelated to numerical attributes; each value represented a categorical label, which had to be taken into account in the statistical analyses.
The results of all nominal variables were processed in two ways. First, it was descriptive statistics, which summarized the results and showed significant trends that were true for each of the variables. Second, it was a deeper level of statistical analysis, based on the use of correlation and regression analysis. In this section, the key issues were attempts to identify implicit relationships between variables and detect some variables’ potential influences on others. One needs to keep in mind, however, that all variable fields in SPSS were collected in a nominal form, which meant that additional transformations had to be performed for deeper statistical analyses.
Psychometric Properties of Testing
The questionnaire administered is a translated version of the English-language document, which has already been demonstrated to be academically correct and reliable for sampling. However, translating the document into Arabic to administer the questionnaire to a Saudi audience is a threat to the validity of the results. A double-translation mechanism involving several unrelated independent bilinguals, including people with a medical background, was used to preserve the material’s validity and ensure that the questionnaire actually measured the expected results. Using this approach was expected to minimize the risks of maintaining the questionnaire’s validity.
However, it is important to take into account the common Hawthorne effect, whereby increased attention distorts the results of the experiment. Inviting respondents from a list of people known to the author to participate in the survey questionnaire may have skewed the actual results for the general population, as each respondent may have felt responsible and pressured to participate. The Hawthorne effect postulates that participants in such academic interventions tend to produce more encouraged outcomes when they feel increased interest from clinicians. Regarding the material used, respondents may have skewed the results toward plant foods and red meat in ways that are “socially encouraged.” Unfortunately, there was no additional assessment of the participants’ responses at this point, which means there is no way to measure the validity of the test this time qualitatively.
Results
Since the first question determined individuals’ willingness to participate in the survey and all subsequent questions were required to be answered, a hundred percent result for the first question was expected and corresponded to the final number of respondents. As mentioned above, however, one individual declined to participate, and his results were not used for the entire analysis. Thus, the total number of individuals who participated in the pilot test was thirty-two (n = 32). There were no responses from the next two blocks in which respondents chose to ignore the question, so each of the questions in the entire questionnaire had a one hundred percent response rate.
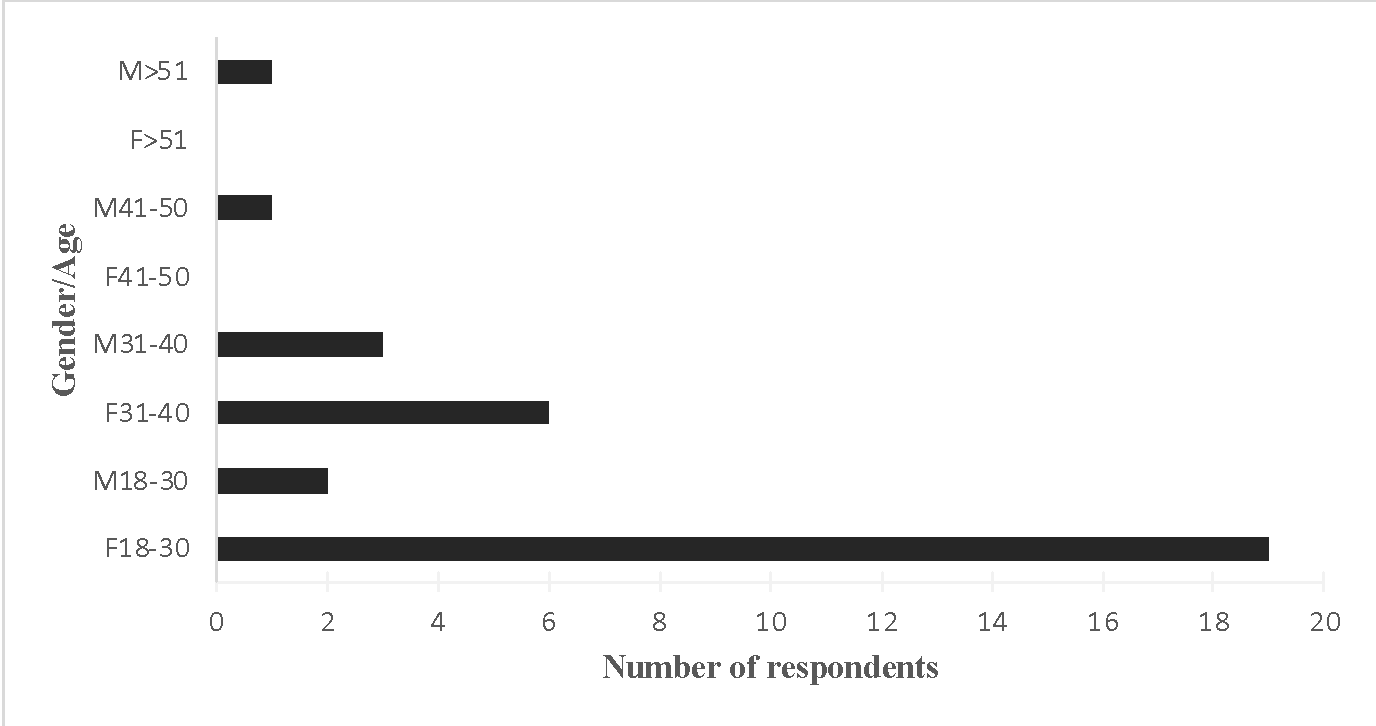
In terms of socioeconomic and demographic characteristics, the sample collected was predominantly female, with the average age of participants ranging from 18 to 30 years old. From the more detailed statistics of Figure 1, it is clear that the central core of the sample was represented by young women under the age of 30; in other words, the respondents were young, primarily female Saudis concerned about their health in light of colorectal cancer.
Table 1. Gender and age statistics of the generated sample.
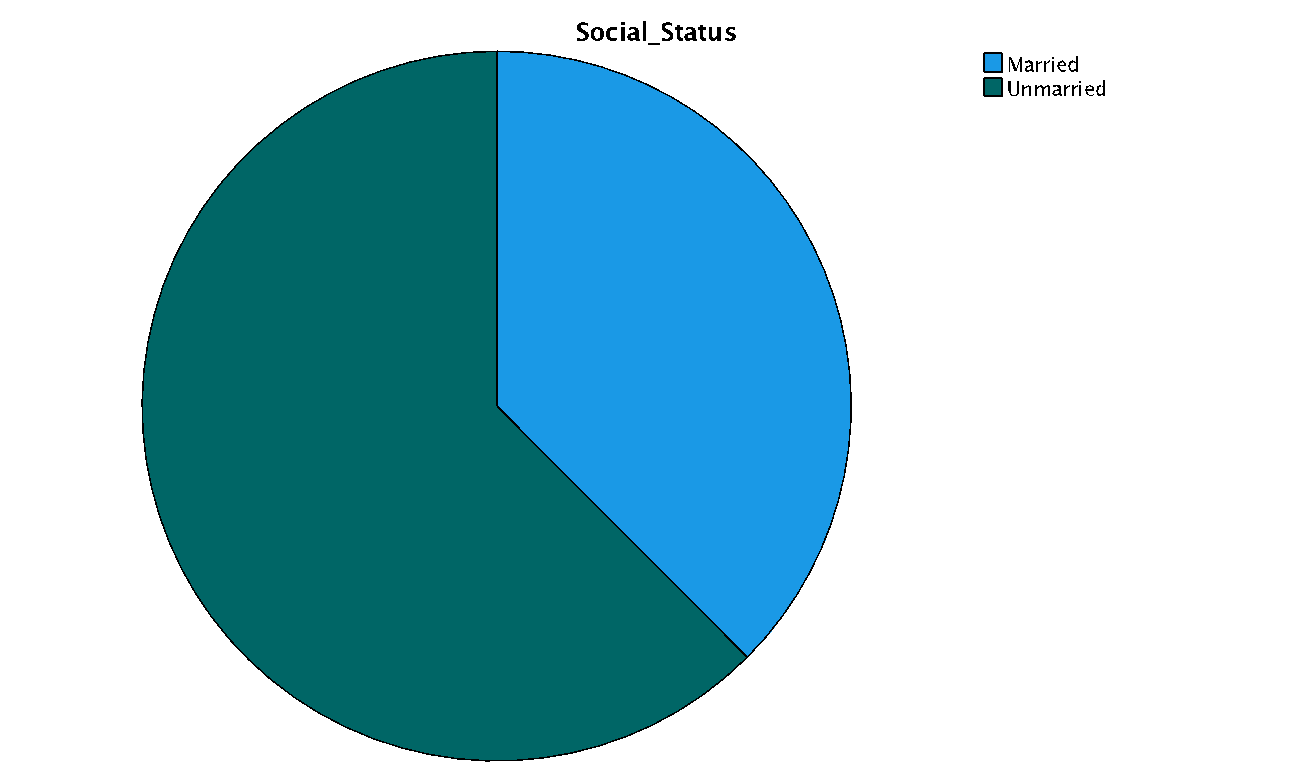
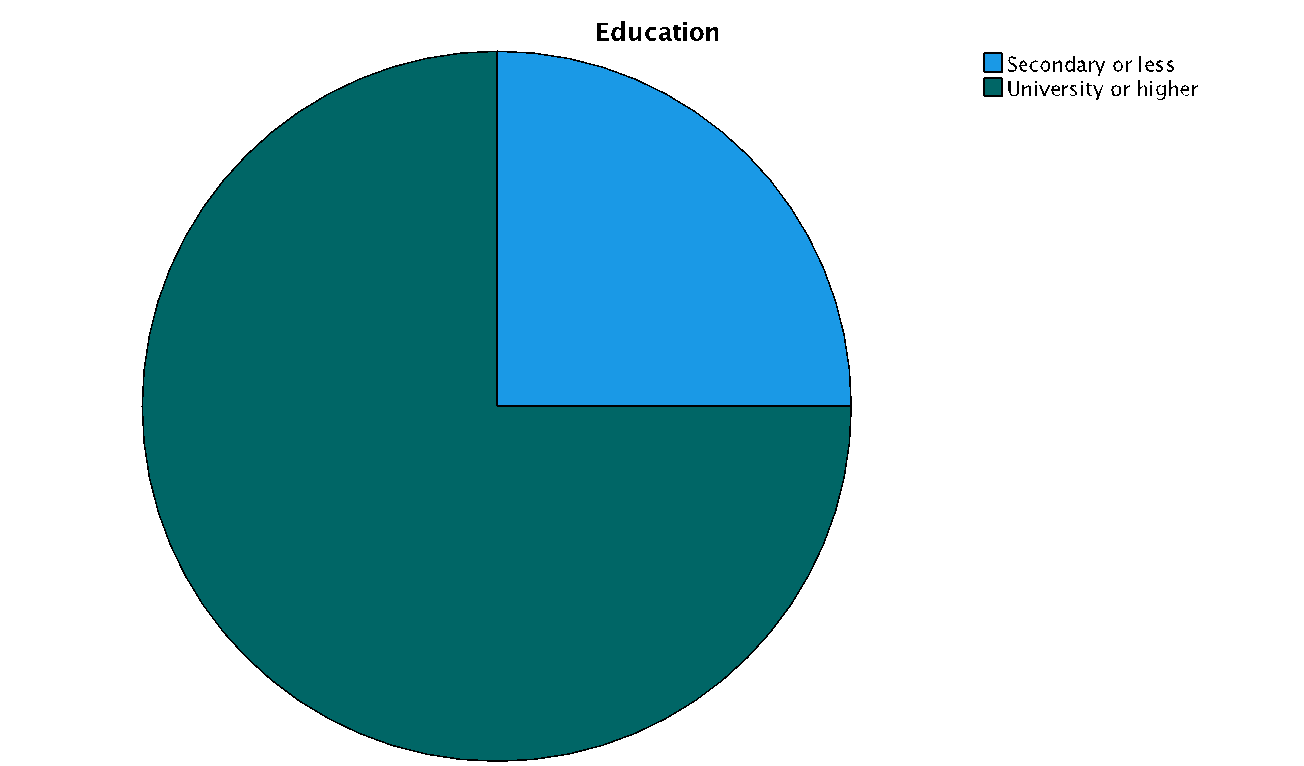
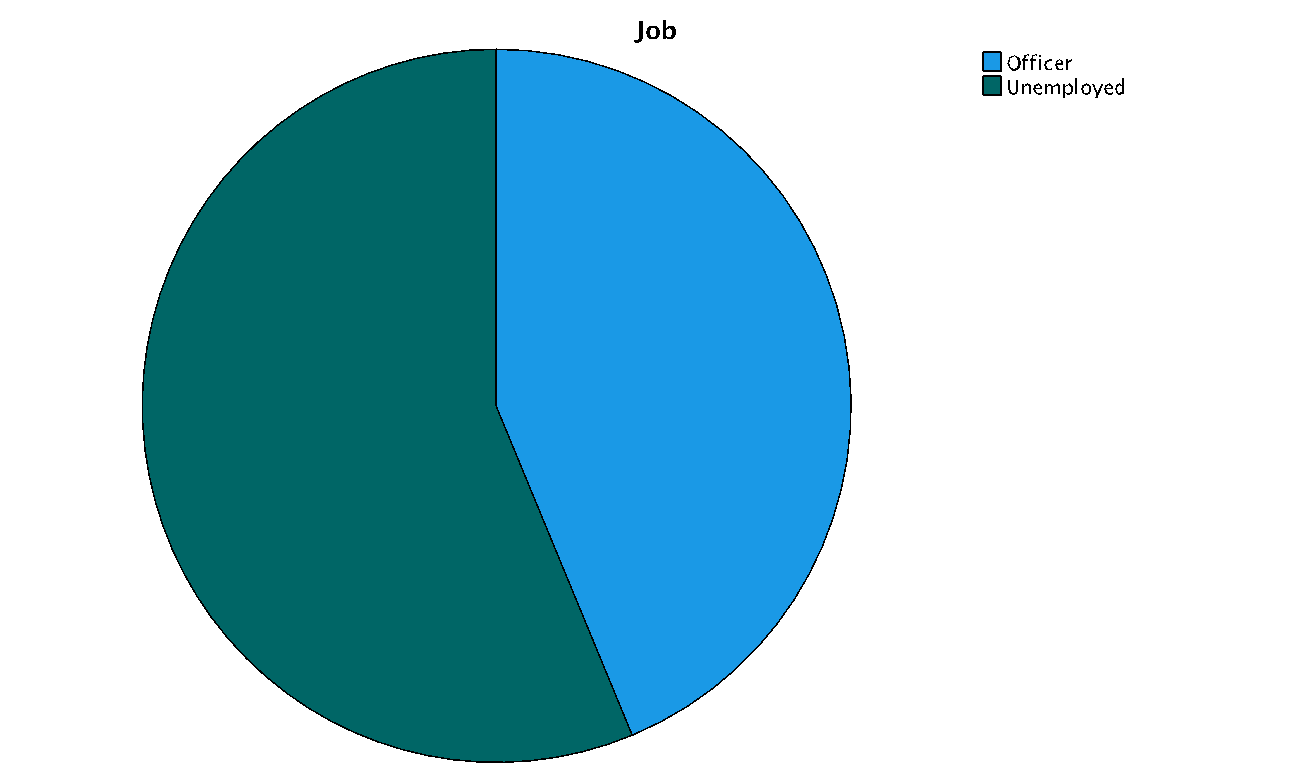
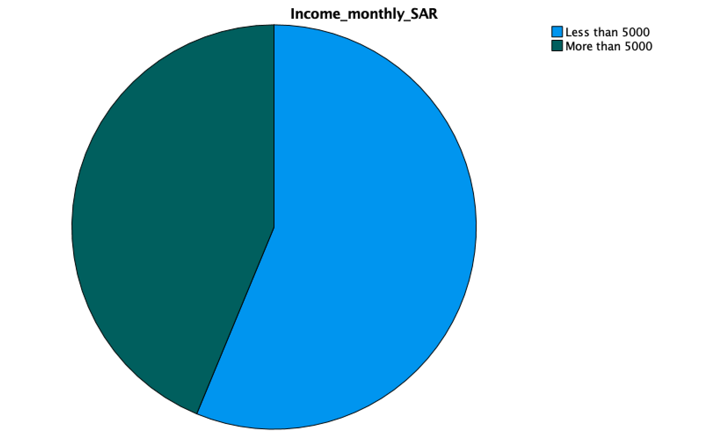
In terms of the other traits of the sample collected, as Figure 2 shows, 62.5% of respondents identified themselves as married individuals, with 75% having an academic degree or higher from a university. Notably, about one in six participants identified themselves as unemployed, which generally satisfies two features of the Saudi Arabian general population at once. For example, many women do not have access to work because of local Sharia law, and while this practice is changing rapidly, it takes time to implement changes. In addition, about 66 percent of the sample are young people who probably have not yet found stable employment and therefore tend to describe themselves as unemployed. The average monthly income among respondents was almost evenly distributed across both borders from the 5,000 SAR mark, indicating the heterogeneity of the sample collected in the context of economic descriptions.
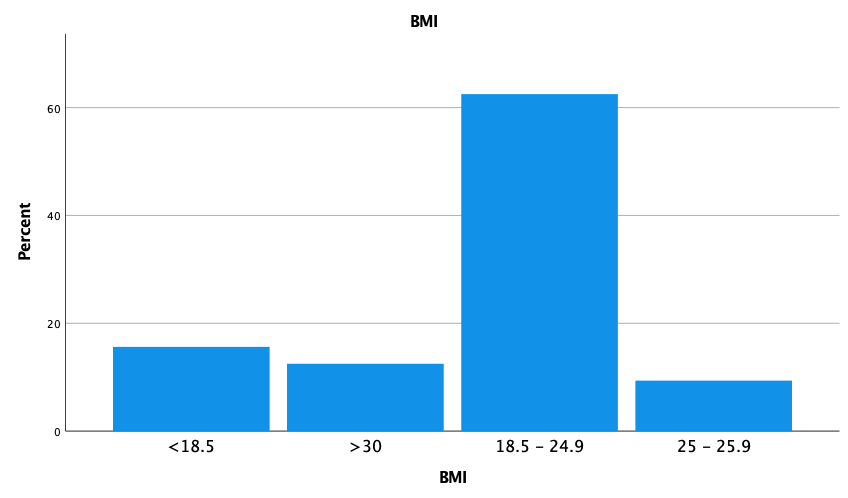
Finally, respondents were unevenly distributed across the four groups in terms of BMI. Recall that BMI is understood as an indicator that allows us to examine the degree of correspondence between a patient’s height and body weight: the lower or higher this characteristic, the more likely an individual is to belong to the risk groups. In this sense, the sample expected prevails in the average interval from 18.5 to 24.9 kgm-2, which is considered normal.
The results of the third block of data reflect general trends among respondents’ perceptions of specific statements. Examining this data helps to assess how widespread a particular opinion is in the sample of 32 participants. Summary data for all twelve questions in this block are shown in Table 2. It can clearly be seen that respondents’ answers were not homogeneous, and while positive answers prevailed for some questions, respondents tended to disagree with the statement for others. Notably, only on question 14 did the majority of participants not give a specific answer, indicating that the question was difficult to formulate or ambiguous in its interpretation. When assessing the possibility of getting colorectal cancer, one in two individuals (50.1%) expressed concern about it. Expected results were also obtained for questions 10 and 11, in which most individuals (75.1% and 59.4%, respectively) agreed that cancer could negatively affect the quality of life and reduce life expectancy. It was also found that clinical providers did not advise patients to give up red meat but advised them to eat plant foods in large quantities. However, the situation changes with recommendations from friends and family: incompetent individuals tended to advise against red meat, with two out of three respondents stating that family or friends advised them to eat more plant foods. Thus, it is helpful to emphasize that plant-based foods are perceived by most as a good diet that balances the diet, whereas such beliefs are contradictory with regard to red meat.
Table 2. Frequencies and relative frequencies for Likert scale measures of agreement.
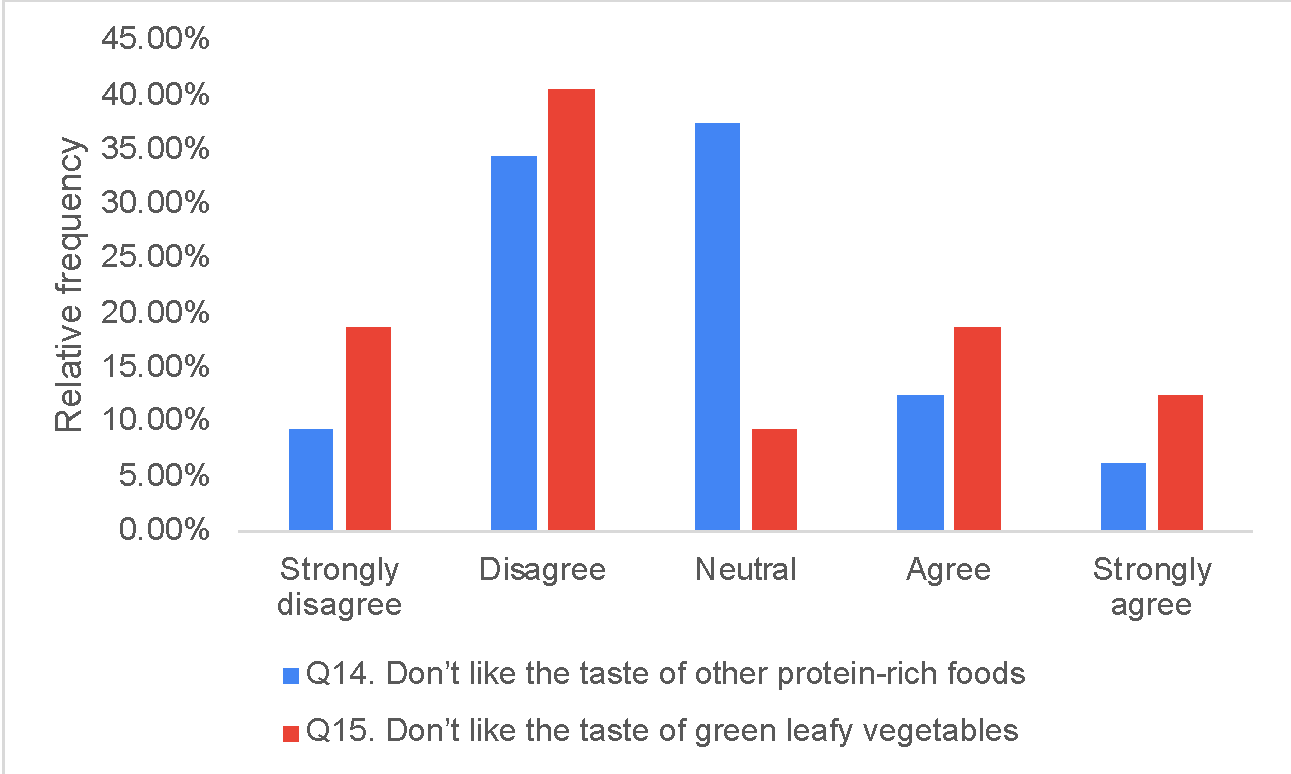
Finally, an interesting pattern was evident among the entire sample with respect to perceptions of red meat and plant-based food tastes. Figure 3 shows that the overwhelming majority of participants disagree that they do not like the taste of red meat; therefore, this product tastes good to them. The situation remains the same for plant foods, which means that both vegetables and red meat are shared among the diet of this sample. However, in terms of the questioning audience, about four times as many respondents could not say they disliked and liked the taste of red meat compared to plant-based foods. In other words, red meat is more controversial to the sample than vegetables.
For deeper, non-descriptive statistical tests, it was taken into account that each of the variables used is nominal, which means that classical regression and correlation analysis procedures prove ineffective for nonnumerical variables. The nominal scale of variables means that the data in a category cannot be sorted in ascending or descending order because they contain only information about the object belonging to a particular category. SPSS built-in procedures allow us to bypass these limitations by using polynomial regression models. This method can be used to measure how independent parameters are related to the dependent variable under study. For example, Table 3 shows well that BMI as an independent variable was statistically independent of respondents’ age, gender, and even more so income because the corresponding p-value values were significantly higher than the critical level of 0.05. Consequently, a change in any of these variables does not result in a pattern change in respondents’ BMI.
Table 3. The output of polynomial regression for BMI as the dependent variable.
A similar polynomial regression procedure was performed for each question in the third block as a separate dependent variable, with demographic parameters as independent factors. Thus, it was interesting to determine whether age, gender, income, social status, level of education received and position held, as well as BMI, influenced respondents’ responses to the Likert scale questions. Table 4 illustrates these results: any p-value below the critical level corresponded to the presence of an effect for this pair, although the strength and extent of this influence could not be measured at this stage.
It is well seen that gender and BMI were predictors of the response to the question that colorectal cancer reduces the quality of life. If one examines the statistics of the answer to this question in detail, one finds that women were five times more likely to agree with this statement than men. A significant effect was also shown for the relationship with BMI, with an additional finding that people with average BMI values (18.5-24.9) were more likely to agree with this statement: they accounted for 50% of all responses among respondents. In addition, social status and level of education were positive predictors for agreement with the statement that colorectal cancer causes death; respondents with higher education were shown to be more likely to agree with this statement. Meanwhile, unmarried people were 1.7 times more likely than married people to agree.
For the twelfth question, postulating an association between red meat consumption and reduced risk of a cancer diagnosis, it was shown that gender and social status were the only statistically significant predictors. Specifically, 37.5% of respondents who agreed with this statement were unmarried women. In response to the seventeenth question, stating a recommendation by the clinical provider to consume less red meat, the patterns of association with age and BMI were noticeable. In this sense, people in the middle age range (18 to 30) and average BMI were more likely to disagree, as one-third of individuals in this cluster answered negatively, and one-third answered affirmatively. The eighteenth question postulated a similar statement, only in this case the advice had to come from family or friends. Interestingly, this question no longer revealed the same patterns as the previous question. More often than not, women with monthly incomes below SAR 5,000 received such recommendations from their significant others; no such pattern was found for men.
Table 4. Testing the effects of independent contributions to the polynomial regression for each of the questions in the third block, with a critical level of 0.05.
Notably, relationships with independent sociodemographic factors were not found for all questions in this block. In particular, questions 13 through 16, as well as the last two statements, showed no relationship patterns. It may follow from this that patients responded evenly to all of these statements, and thus no significant trends can be detected. At the same time, the individual’s work alone as an independent factor showed no effect on either question. From this, it can be concluded that work is not a statistically significant factor influencing the perception of food habits of Saudis.
The nonparametric Pearson chi-square test was an important data processing task. In general, this method is commonly used to compare two or more categorical data, but in the context of the current study, it was interesting to determine how evenly the data were distributed for each question in the third block. Table 5 below shows the p-value for each nonparametric test: a value below 0.05 answered the need to reject the null hypothesis. In other words, for these relationships, the distribution of responses within a category was different from uniform (0.50/0.50). This table clearly shows that only social status, position held, and monthly income occurred with equal (or close to equal) probability among the sociodemographic variables. Only questions #16 and #20 had the same property among the third block categories. This implies that an equal number of respondents in the sample were equally likely to be unable and unable to imagine their lives without red meat; the exact distribution is noticeable for recommendations to consume more plant foods.
Table 5. Outcomes of a nonparametric chi-test to determine the uniformity of the distribution of values within categories, with a critical level of 0.05.
It is worth emphasizing that the initially stated correlation test proved impossible to perform within the current array because none of the variables had a numerical scale. Instead, it was possible to test the relationship between factors by cross-tabulation using the chi-squared technique: this helps to assess the effect of one variable on another (Udayton, n.d.). However, it is impossible to conduct multiple cross-tabulations simultaneously, so patterns must be evaluated in pairs. The results of a summary table of such a pairwise comparison are shown in Table 6.
Table 6. P-value values for pairwise cross-tabulations to determine common effects, at a critical level of 0.05.
It is clearly evident that only four of the eighty-four pairs were found to have statistically significant (p<0.05) patterns. Thus, people with higher education were more likely to agree with the statement that colorectal cancer reduces patients’ quality of life (Figure 4A). At the same time, employed respondents were more loyal to the opinion that cancer causes death, whereas non-employed respondents showed more doubts (Figure 4B).

Also noteworthy is the fact that people with a university education were more likely than others to disagree with the statement that they “Do not like the taste of other protein-rich foods” (Figure 5A). In other words, an intermediate conclusion can be drawn that more educated people often like the taste of protein-rich foods, although this statement requires careful verification. Also related to education is the pattern that university-educated respondents were more likely than others to receive recommendations from friends and family to consume more vegetables (Figure 5B). The overall conclusion is then that education is an essential predictor of individuals’ perceptions of dietary habits.

Discussion
The findings fully demonstrated the feasibility of using questionnaires to investigate the food habits of Saudis in light of colorectal cancer. Existing studies have already confirmed these findings, but for an English-speaking U.S. audience; however, the pilot test conducted in this dissertation for a small sample (n = 32) illustrated the validity of extrapolating the translated questionnaires to a Saudi audience as well (Schaberg et al., 2020). The resulting sample was generally heterogeneous and heterogeneous, but women over 41 were utterly absent, which may have skewed the results, even though female audiences were predominant in this group. The distribution of responses to questions in the third block, where participants were asked to rate their agreement with the statements on a Likert scale, showed the generally expected results.
Notably, nearly 60% of the sample said red meat could reduce cancer risk, but 60% of respondents said they could easily imagine living without red meat. In isolation, this data may suggest that patients perceive the beneficial effects of red meat but could easily give it up to their detriment due to religious, personal, or ethical reasons; however, this statement requires independent research. It is believed that locals in Saudi Arabia hardly eat beef but instead eat mutton and camel meat as red meat (Shahid, 2019). This interestingly correlates with the data that “red meat, such as beef, lamb and pork, has been classified as a Group 2A carcinogen which means it probably causes cancer” (CC, n.d., para. 1). In other words, red meat probably causes cancer, but among the sample, most participants were convinced of the opposite effect. Meanwhile, it was common for the sample to view plant foods as a natural defense against the development of colorectal cancer. Numerous studies support these patterns, as the unrefined plant fibers present in vegetables and fruits actually reduce the likelihood of a cancer diagnosis (Madigan & Karhu, 2018). It can then be postulated that the sample has agreement about plant foods but contradiction about red meat.
Although a study by Schaberg et al. showed that perceptions of colorectal cancer threat were influenced by age and eating habits, the current study confirmed that the academic status of respondents was also influential. In particular, those with a college degree, as opposed to respondents with a secondary level, perceived the threat of colorectal cancer and personal susceptibility to the diagnosis more seriously than others. It was also demonstrated that such people were more likely than others to be advised by loved ones to consume more plant-based foods. It may follow that family and friends of more educated people tend to be more knowledgeable about proper dietary habits and therefore more likely to give good advice. For age, gender, income, social status, and BMI, no statistically significant effects were found on perceptions of this issue.
Furthermore, in contrast to the findings of Schaberg et al. (2020), the current dissertation showed that middle-aged people were more likely than others to question the link between red meat consumption and reduced risk of a cancer diagnosis. Most likely, the high availability of the Internet at this age leads to a diversity of opinions, not all of which are qualified. Meanwhile, it was demonstrated that two out of five respondents disagreed that they “do not like the taste of other protein-rich foods,” and three out of five participants disagreed that they “do not like the taste of green leafy vegetables.” These findings do not correlate with the results of Smith et al. (2019). In contrast to the patterns found by colleagues, 2.5 times as many respondents in the current sample do not like plant-based foods.
Conclusion
Dietary habits and the extent to which they are perceived are key patterns that determine the lifestyle of individuals. Among the factors influenced is the patient’s health as a characteristic of their physical and mental capacity. The current dissertation study was an expanding follow-up to a number of scientific papers that have correlated the perception of eating behavior with the threat of colorectal cancer. This type of disease is known to be extremely dangerous to human health, but it is also one of the most common. The colorectal cancer pandemic is linked to, among others, unbalanced community nutrition and an excess of red meat in the diet. The present study assessed the level of perception of the problem among a pilot sample from Saudi Arabia. Many of the previous findings were found to resonate in the current experiment, in whole or in part, but different patterns were also shown.
In particular, the academic and work status of individuals was found to influence perceptions of the problem. More educated respondents had higher levels of awareness of clinically correct information than people with secondary education. In addition, it was clearly shown that younger participants did not have an unequivocal opinion on the benefits of eating red meat. Although the scientific community tends to believe that red meat is a threatening factor for colorectal cancer, younger respondents essentially did not show unequivocal opinions on this issue.
The findings can be scaled up for use on a larger audience from Saudi Arabia, but some limitations must be taken into account. First, the current results were only fair for a small sample size, and there is a risk that they would no longer be relevant when scaled up. Second, the sample was collected using a convenience methodology, which means that not every respondent in the general population had the same chance of being sampled. This affects the quality of the final results. Third, there were no mature women over 41 in the sample, which also had the potential to skew the results. However, each of these limitations can be corrected by further scaling and creating a more heterogeneous sample so as to account for the representation of each cluster. Moreover, the current survey has shown the potential to be expanded, including data related to respondents’ occupational specification geographic and religious affiliation, in order to explore hidden patterns in more detail.
References
CC. (n.d.). Red meat processed meat and cancer. Cancer Council NSW. Web.
Madigan, M., & Karhu, E. (2018). The role of plant-based nutrition in cancer prevention.Journal of Unexplored Medical Data, 3(9), 1-16. Web.
Schaberg, M. N., Smith, K. S., Greene, M. W., & Frugé, A. D. (2020). Characterizing demographic and geographical differences in health beliefs and dietary habits related to colon cancer risk in US adults. Frontiers in Nutrition, 7(190), 1-8. Web.
Shahid, F. (2019). Do they eat a lot of beef in Saudi Arabia? Quora. Web.
Smith, K. S., Raney, S. V., Greene, M. W., & Frugé, A. D. (2019). Development and validation of the dietary habits and colon cancer beliefs survey (DHCCBS): an instrument assessing health beliefs related to red meat and green leafy vegetable consumption. Journal of Oncology, 2019, 1-8. Web.
Udayton. (n.d.). Using SPSS for nominal data: Binomial and chi-squared tests. Academic Udayton. Web.