The Data
This report examines the bottom-line performance of 19 Islamic banks and 50 conventional banks, all operating in the GCC, for the years 2005 to 2008. The data was culled from the Institute of Banking Studies (IBS).
The Variables and Variable Definition
From the list of 42 bank statement items compiled by the IBS for Islamic banks and 37 for conventional banks, three criterion variables were selected. These return on assets, return on equity and net income, defined as follows:
Independent Variables for the Model
Owing to the multi-bank composition of the database, the selection of independent variables was compressed to just one step: running pairwise correlations against each of the above criterion variables. Set aside were lagged and annual change correlations because these are not only extremely unwieldy but also mathematically unsound when multiple entities are concerned.
Segregated by bank group and criterion variable, the correlation-based shortlist of independent variables are as shown in tables 1 to 3 below and overleaf.
Table 1
Table 2
Table 3
Empirical Analysis
Modeling Net Profit, Conventional Banks
On the basis of the correlations reported in Table 1 above, we select Total Equity, Deposits, Total Assets, and Loans as possible determinants of Net Profit. The descriptive statistics for all six variables are shown below. When running the actual multiple regression model, however, we had to remove “total equity” since the data unaccountably had zero errors for the first year of the data series for all reporting banks. The results of the regression run are depicted in Tables 5ff.
Table 4
Table 5
In Table 5, the “adjusted R2” provides an estimate how much of the total variation in Y (conventional bank net profit) is explained by the three independent variables together. The result of 50.4 % is fine, given the dozens of variables (including qualitative market, environmental and political shocks) that impinge on bank performance in the real world.
In turn, the key value in Table 6 overleaf is the significance statistic for F. The ANOVA is a test of the null hypothesis that the three IV really has zero effect on Y, conventional bank net profit. The ANOVA result for the entire regression is an F value of such considerable magnitude that it is associated with a significance statistic p = 5.25-30. This is a number with 29 leading zeros, more than enough to surpass even the rigorous significance standard p < 0.001. This means there is less than one chance in a thousand (much less than a septillion actually) that all the coefficients in this regression are really zero. In short, each IV with a non-zero beta coefficient (see below) does have an effect on the DV of net profit for conventional banks.
Table 6
Table 7
Table 7 above reveals that the regression model can be written as: YCBank Net Profit = 68.24 + 0.06 (Deposits) – 0.03 (Total Assets) + 0.002 (Loans).
This result suggests that, from an initial starting point of 68.24, Net Profit for conventional banks is more significantly influenced by the size of the deposit base, is less dependent on the size of the loan portfolio, and is actually degraded (but only marginally so) when total assets increase. In technical terms, Net Profit will typically raise about $60,000 for every $1 million increase in deposits generated and about $2,000 for every $1 million loaned out. So if one knew in advance that deposits and loans for a representative conventional bank in the GCC were to increase by this much on a year-to-year basis, one ought to have a fair idea of what net profits will be.
As to total assets, chances are that net profit will fall about $30,000 for every $1 million that total assets increase. Such an analysis does not bear to focus on because of the complex composition of commercial bank assets.
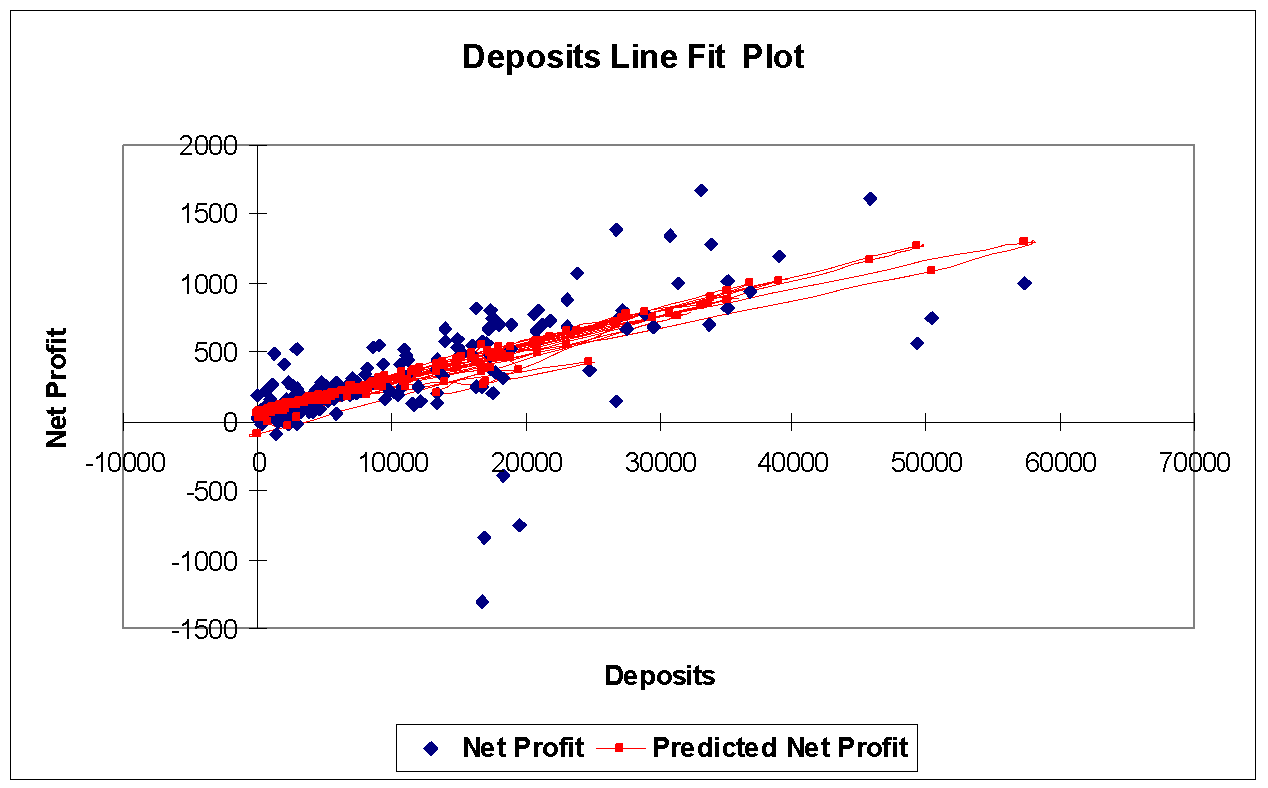
Figure 1 below shows the plot of the relationship for our best predictor, total deposits. This appears to be a fairly sturdy relationship, were it not for a handful of banks anomalously reporting “negative” deposits.
Modeling Net Profit, Islamic Banks
For Islamic banks in the GCC as a group, we select from table 1 above Total Equity, Cash, Nbr Employees, and Paid-up Capital but exclude the second-ranking item “Equity” since this will cause autocorrelation with “Total equity”. The main measures of central tendency and dispersion for the five selected variables are shown in Table 8 below.
Table 8: Descriptive Statistics for Selected Variables, Islamic Banks
Once again, we need to eliminate total equity from consideration because the raw data contained too many blank cells. After another minor data cleaning, the following tables reveal the results of the multiple regression runs.
Table 9
Table 9 reveals, first of all, an adjusted R2 claiming that the three-IV model explains fully 86 percent of the movement in Islamic bank net profit.
Accordingly, the ANOVA as a test of the null hypothesis that the beta coefficients for all three IV’s are really zero (Table 10 below) returns the significance statistic 1.09-30. This is a probability number with 28 leading zeros, thereby easily hurdling even the rigorous threshold of α < 0.001. We must reject the null hypothesis and conclude that the beta coefficients for each of the three IVs are really not equivalent to zero.
Table 10
Table 11
The model below states that, on average and starting from a negative intercept, a Islamic bank is likely to attain $314,000 in net profit for every $1 million rise in cash position, improve net profit by $15,000 for every addition of one to the bank staff, and about U.S. 16 cents for every $1 million in new paid-up capital. In short, Islamic bank net profits are primarily boosted by improvements in cash position and secondarily by enlarging staff size. Paid-up capital also has an influence on net profits but the scale of the amounts (Table 8 shows the median paid-up capital is $408 million) makes the β coefficient look positively minuscule.
YIBank Net Profit = -28.56 + 0.314 (Cash) + 0.015 (Nbr Employees) + 0.00000016 (Paid-up capital).
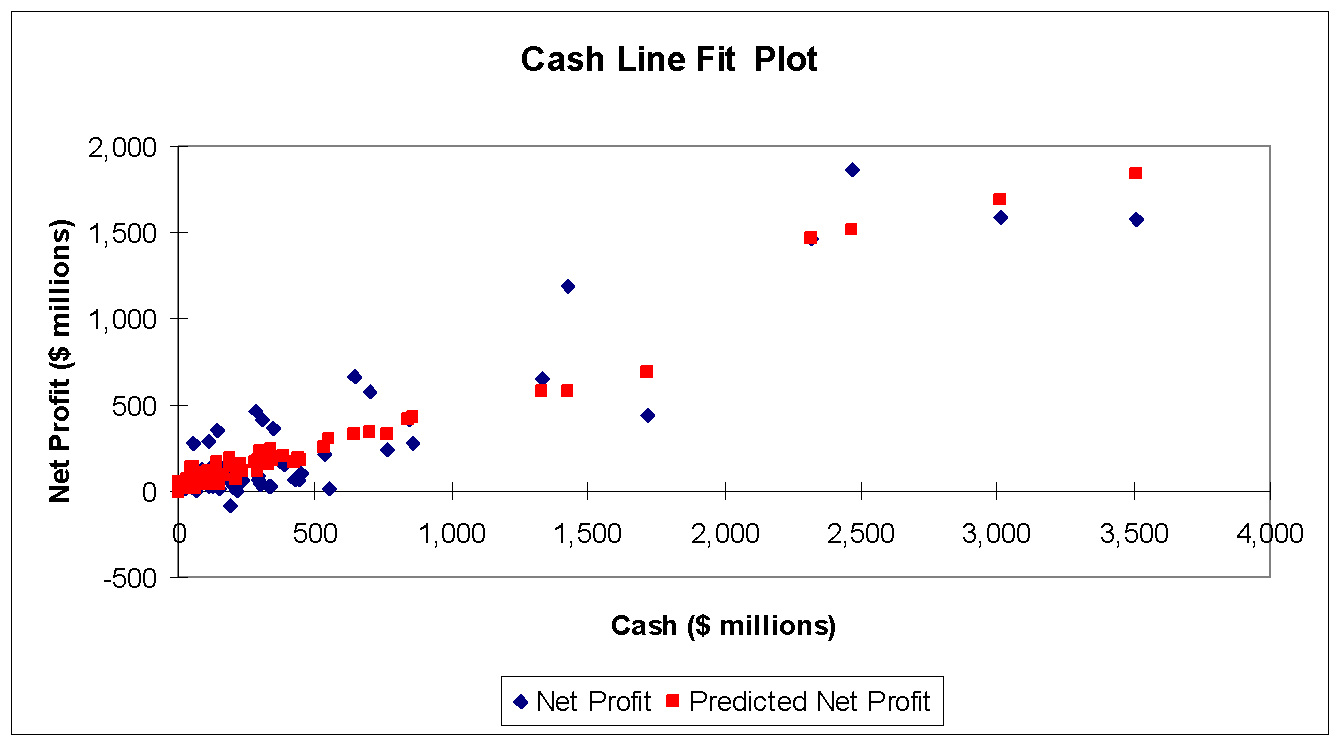
For illustrative purposes, Figure 2 shows how robust the relationship between net profits and cash position is.
Modeling ROA, Conventional Banks
From Table 2, we pick IV’s: Growth Rate, Equity to Assets, Liquid Assets to Deposits, and Cash to deposits. After minor data cleaning, we obtain the main descriptive statistics shown in Table 12 overleaf. Noteworthy are the low indices of central tendency for conventional bank Growth Rates because many institutions reported declines during the four-year period under review. The standard deviation for Growth Rate (GR) is also very high compared to the levels of mean and median reported, suggesting a great disparity in bank performance. On the other hand, the fact that the mean Growth Rate is nearly three percentage points higher than the median reveals that superlative performance (which has an inordinate upward influence on calculated means) is also possible in the GCC. In 2005, for instance, the International Banking Corporation reported a year-on-year GR of 101.8 percent.
Table 12: Main Descriptive Statistics for Conventional Bank ROA Model
So great is the variance in conventional bank performance generally and ROA in particular that the four-IV model explains just 6.8 percent of the average movement in the dependent variable (Table 13). Nonetheless, the IVs bear a valid relationship with the DV since the ANOVA test of the null hypothesis (that the coefficient values are zero) yielded a high F value with an associated statistic p<0.001. For the typical conventional bank in the GCC, chances are that the selected IVs do have an influence on ROA as DV.
Table 13: Summary Output for Regression Model: Conventional Bank ROA
Table 14: ANOVA for Regression Model: Conventional Bank ROA
Table 15: Coefficients for the Regression Model: Conventional Bank ROA
Taking the cue from Table 15 above, the regression model can be written as shown below. Essentially, this means that conventional bank ROA is likely to rise by one-third of a point for every one-point increase in the Equity to Assets ratio and increase by 0.19 point for every 1-point gain in the Liquid Assets to Deposits ratio but drop by nearly half a point when cash-to-deposits rises a full point,
YCBank ROA = 6.42 + 0.352 (Equity to Assets ratio) + 0.194 (Liquid Assets to Deposits ratio) – 0.45 (Cash to Deposits ratio).
Modeling ROA, Islamic Banks
Picking up the high-correlation variables in Table 2 and setting aside those that are true banking outcomes (e.g., Dividends and Dividend Payouts), our IV shortlist for Islamic bank ROA comprises: Total Income to Assets, Growth Rate, Equity to Assets, and Paid-up Capital. The key descriptive statistics for these four IV’s are as follows:
Table 16: Descriptive Statistics for ROA Model, Islamic Banks
This model explains over three-fourths of the total variance in ROA for Islamic banks (Table 17), based on the estimate that R2 is notably high for a real-world regression model.
Table 17: Summary Regression Output, ROA Model for Islamic Banks
The test of the null hypothesis (Table 18) returns a high F value and an extremely low significance statistic: 1.5 with 19 leading zeros, way below the rigorous p < 0.001 that effectively eliminates chance occurrence. This suggests that the three IVs together do influence the DV, Islamic bank ROA.
Table 18: ANOVA for Significance of Differences: ROA Model for Islamic Banks
Excel reports (Table 19 below) that the model equation can be written as follows:
YIBank ROA = -2.814 + 0.39 (Total Income to Assets ratio) + 0.096 (Equity to Assets ratio) + 0.05 (Growth Rate) + 0.0000000004 (Paid-up Capital).
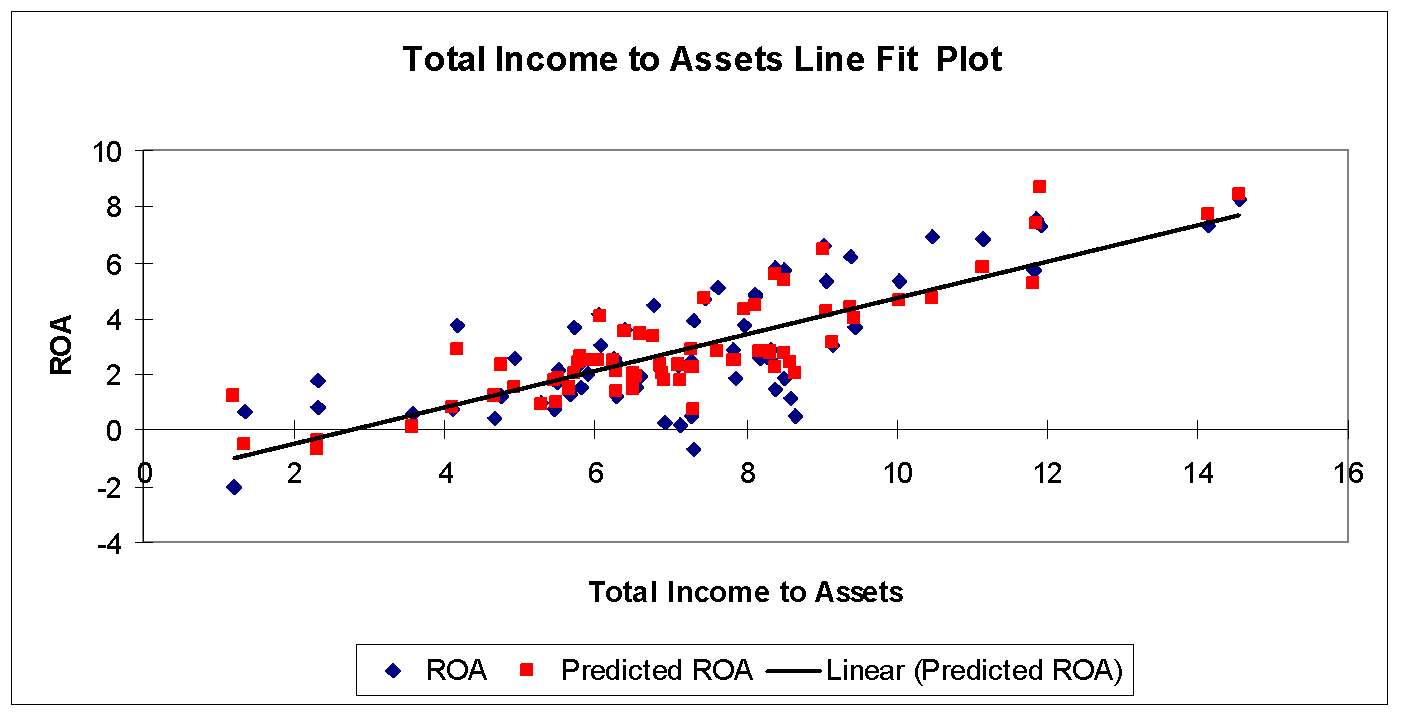
This means that from a negative intercept, the Total Income to Assets ratio has the greatest influence on the DV. The latter could, all other things equal, improve one-third of a point for every point gained in the Total Income to Assets ratio. As to the secondary IVs: a) ROA could gain one-tenth of a point for everyone that the Equity to Assets ratio gains; b) a one-twentieth point rise is likely when the bank’s growth rate rises by one percentage point; and, c) about half a point for every $1 billion increments in Paid-up Capital.
Table 19
Since the ratio of total income to assets appears to have the most bearing on ROA, we illustrate the strength of this relationship in Figure 3:
Modeling ROE, Conventional Banks
Referring to Table 3 above, we select as high-potential IV’s Growth Rate, Nbr Branches, Deposits to Assets, and Nbr Employees but set aside Dividends on the grounds that this is an outcome variable. The key descriptive statistics are as follows:
Table 20: Main Descriptive Statistics for ROE Model, Conventional Banks
A model comprising these four IV’s explains just under two-thirds of the total variance (0.63, see Table 21) in conventional bank ROE, which gives it considerable explanatory power indeed. Moreover, we can reject the null hypothesis that the collective influence of the IV’s on ROE is tantamount to zero since the ANOVA (Table 22) estimates the probability of that happening purely through random variation chance as three preceded by 40 zeroes, far surpassing the usually rigorous hurdle of p < 0.001.
Table 21: Summary Regression Statistics for ROE Model, Conventional Banks
Table 22: ANOVA Test of Null Hypothesis: ROE Model, Conventional Banks
Table 23 (overleaf) reveals that the model coefficients are:
YCBank ROE = 1.15 + 0.53 (Growth Rate) + 0.12 (Deposits to Assets ratio) + 0.04 (Nbr Branches) – 0.001 (Nbr Employees).
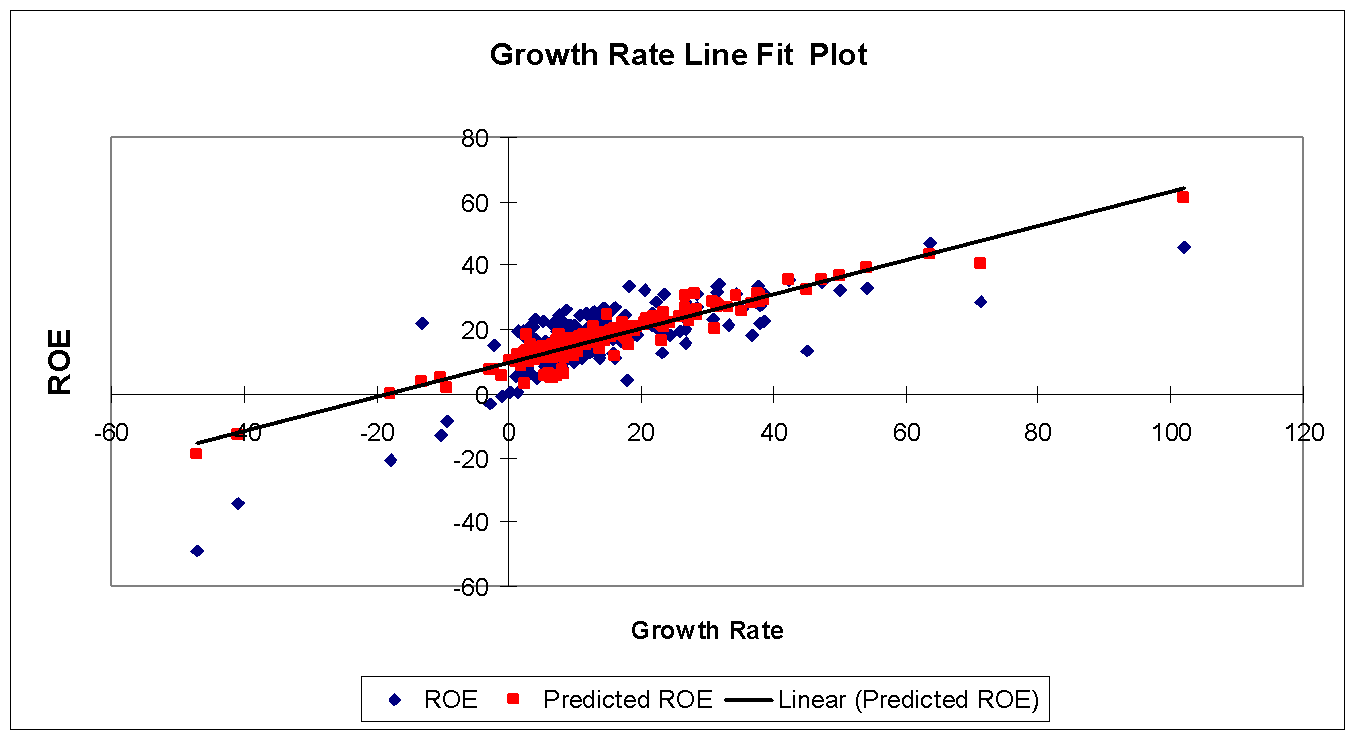
On average, therefore, the overall growth rate exerts the most sizeable influence on conventional bank ROE. ROE is predicted to rise half a point for every one percentage point gain in growth rate, one-eighth of a point every time the Deposits to Assets ratio rises by 1 point, one point for every 25 new branches opened, but decline about a thousandth of a point for every new staffer hired.
Table 23: Model Coefficients for ROE Model, Conventional Banks
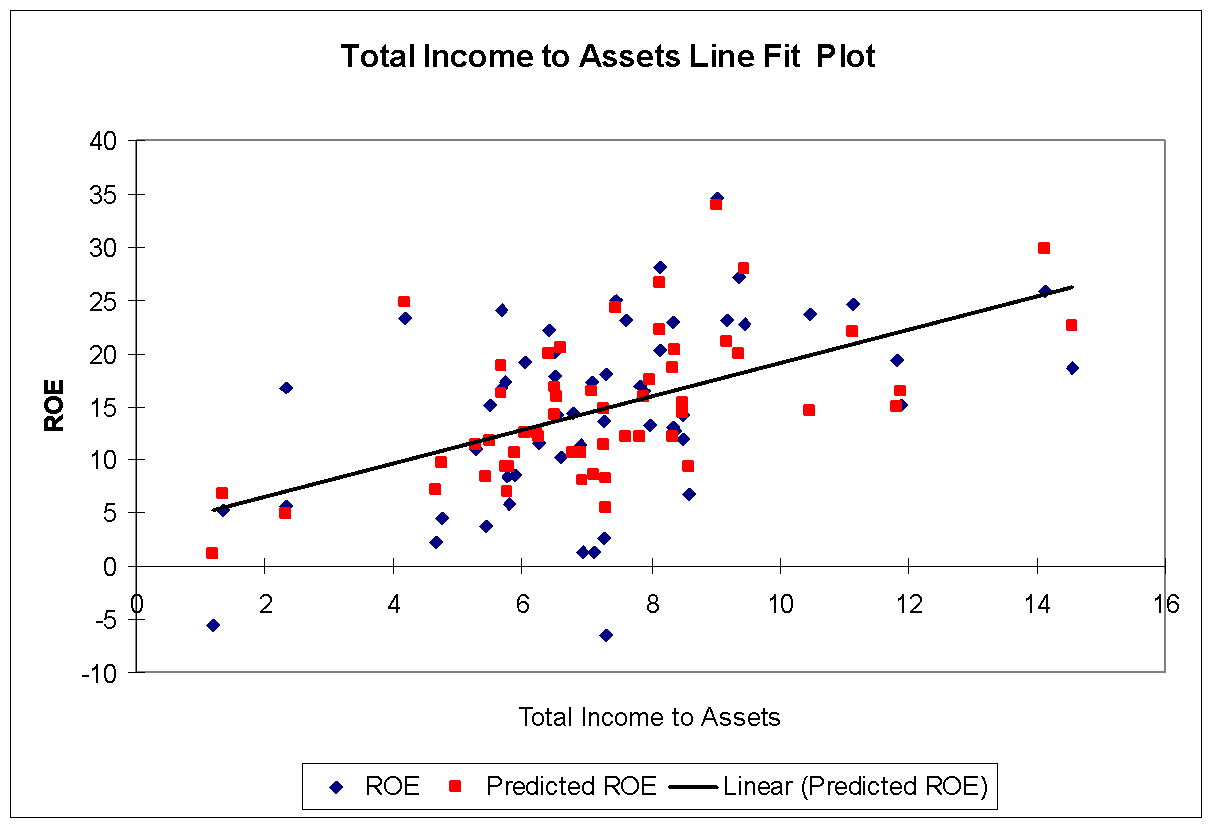
Modeling ROE, Islamic Banks
From Table 3 above, we realize that the high-potential IV’s comprise Growth Rate, Total Income to Assets and Total Operating Income. Once again, we exclude outcomes like Dividends (on the grounds that these are decided after ROE is known) and Reserves (because regulatory agencies have something to say about the level these should be). The summary descriptive statistics are as follows:
Table 24: Descriptive Statistics for ROE Model Components, Islamic Banks
Table 25 reveals that the model as composed and run explains fully 61 percent of the variance in Islamic bank ROE’s.
Table 25: Regression Statistics for ROE Model Components, Islamic Banks
The results of the ANOVA (Table 26) suggests that the quantifiable impact of all three IV’s together cannot possibly be due to random chance alone. For the three degrees of freedom involved, the F value obtained is so high it is associated with an occurrence probability of 3-11, meaning far less than the p<0.001 usually needed to rule out chance variation. This tells us that the β coefficients reported in Table 27 below are highly unlikely to be zero-impact on the DV.
Table 26: ANOVA for Test of Hypothesis of ROE Regression Beta’s, Islamic Banks
Table 27: Size of ROE Model Beta Coefficients and Evaluation Statistics, Islamic Banks
Table 27 above defines the model equation as:
YIBank ROE = 1.872 + 0.78 (Total Income to Assets ratio) + 0.39 (Growth Rate) + 0.003 (Total Operating Income).
This means that ROE for Islamic banks in the Gulf is best predicted by how well Total Assets are turned into income. On average, Islamic bank ROE could rise about 0.8 points whenever the Total Income to Assets ratio improves by 1. Secondly, the growth rate is also key. Every percentage point gain in the overall bank growth rate could yield a 0.4 increment in ROE. Third, the typical Islamic bank stands to record a 3/1,000 increment in ROE for every million dollars of Operating Income booked.
Given that Growth Rate appears to be most predictive of Islamic Bank ROE, we illustrate the strength of this relationship in Figure 5.
