Introduction
The modern branch of chemistry has long ago separated itself from the classical version of wet synthesis in the laboratory using a large number of appropriate glassware and, on the contrary, has become more deeply integrated into other sciences, discovering surprising results at the interface of the knowledge of different disciplines. Thus, twenty-first-century chemistry uses theoretical models and concepts from physics, biology, and medicine, to solve a number of practical problems, especially those related to the field of health care.
It is difficult to imagine today’s highly developed clinic without instrumental devices that allow the medical professional to probe more deeply into the nature and pathogenesis of developing diseases even before the first symptomatic manifestations appear. In other words, only on the basis of close integration between chemical, physical and medical knowledge does next-generation medicine become possible, aimed not at fighting the disease, but at prevention and screening.
Of particular importance in the context of the problem under consideration is the use of such methods of chemical analysis that allow quantitative measurements of biological samples in vivo. In particular, it is about the practical application of the theoretical foundations of liquid chromatography using mass spectroscopy for sequential laboratory studies through the physical separation of liquid solutions with quantitative and then qualitative identification of the constituent molecules of substances.
It is logical to assume that extrapolating such technical capabilities to studies of human health is an effective strategy for studying physiological processes occurring within the body and undetectable to the naked eye of a medical professional. This is especially relevant in the case of newborn patients whose organism is still forming and, therefore, any pathophysiological mechanisms can be registered in advance.
Metabolic abnormalities in newborns triggered by mutations are an important issue for widespread discussion in the medical community. There is no doubt that any parent is interested in the naturally occurring functional development of their child, hence, screening programs are becoming more common. Using a tandem liquid chromatography unit modified with mass spectroscopy (LC-MS) instrument, medical professionals can determine the amino acid and acylcarnitine composition of an infant’s blood, even within the first 48 hours after birth.
Although the results obtained are not yet an exact diagnosis, their correct interpretation, based on the principles of evidence-based medicine, has the potential to determine and predict the development of the child’s diseases. More specifically, the diagnoses established with LC-MS in the newborn patient may include multiple metabolic disease states: phenylketonuria, lysosomal storage disease, bile acid synthesis disorders, or multiple sclerosis. If neglected, each of the clinical cases can lead to disability or death of the patient, hence, screening is a necessary step for early detection and appropriate action.
This research paper has a medical focus on an in-depth investigation of the mechanism of action of the standard LC-MS device. Since the goal set is multifactorial and complex, in order to realize it, the work consistently solved the tasks of measuring the relevance of this problem, analyzing the procedural part of the clinical studies, and possible interpretation of the results obtained by analyzing the thematic scientific sources. For the interested reader, this work is also a useful summary of available research information regarding the progress made in the practical use of LC-MS tools in healthcare.
Statistical Analysis of the Relevance of Newborn Screening
There is no doubt that society in general, and parents in particular, have a strong interest in the development of healthy and functionally fit future generations who will build a new society. While government programs aim to create a supportive environment where pregnant women can get all the support and resources they need, citizens on their own can perform newborn screening procedures to identify potential metabolic problems proactively.
Thus, newborn screening allows genetic diseases to be detected as early as possible in order to provide timely clinical treatment or necessary correction. There is a direct correlation between the timing of a potential diagnosis and the relative prognosis that a specialist can make: the earlier the screening is performed, the higher the probability of a positive outcome of therapy (Olsson, 2019). For this reason, the collection of biomaterial for testing — whether venous blood, blood from a finger, or, more commonly, capillary material from an infant’s heel — should be done as soon as possible after birth. The specific timing depends only on the technical workload of the maternity hospital and the general condition of the infant.
The right strategy to investigate the relevance of the chosen topic is to analyze statistical data demonstrating the prevalence of relevant diseases whose development could have been inhibited if screening had been applied in advance. In particular, the most common disease states identified by LC-MS methods were selected for evaluation: phenylketonuria, mucopolysaccharidosis, or, as the most current scientific research demonstrates, a congenital form of diabetes mellitus. Since behind all of the clinical cases mentioned are disorders of the genetic makeup of the body, the first signs of the diseases can be detected in the first 48-72 hours after birth, even before the onset of symptomatic manifestations.
More specifically, congenital diabetes responds to the body’s metabolic inability to independently synthesize insulin, whose molecules are responsible for regulating blood glucose levels. As of 2016, premature deaths from this diagnosis among patients have increased by 5 percent to a total of 1.6 million deaths (“Diabetes,” 2020). At the same time, for children under the age of 15, the number of cases is more than half a million and shows an annual increase of several percent (Temneanu et al., 2016).
The body of children diagnosed with phenylketonuria is characterized by an inability to metabolize the amino acid phenylalanine to tyrosine, which causes the development of lesions of the patient’s central nervous system. Thus, Thiele et al. (2017) reported an incidence of 1 in 8,000 patients, and global databases contain information on 730,000 children and adolescents with the disease. Finally, mucopolysaccharidosis is characterized as a disease of the patient’s connective tissue in which abnormal metabolism of acidic glycosaminoglycans due to a deficiency of lysosomal enzymes is evident. Such conditions result in the destruction and demineralization of the patient’s bone and cartilage tissues.
Reference to statistics reveals that approximately one in every first child in a sample of 25,000 newborns will have some form of mucopolysaccharidosis, and therefore will not survive to the age of twenty (“Mucopolysaccharidoses fact sheet,” 2020). All of the above together leads to the conclusion that the number of possible pathophysiological conditions in newborn patients is high, and their consequences can directly affect the quality of life of future generations. Therefore, screening with LC-MS is necessary to address this problem in its infancy while preserving the patient’s life.
Theoretical Background of the LC-MS Apparatus
The chromatographic method for clinical measurements, modified with technical capabilities for simultaneous mass spectroscopy, is based on the combination of chromatograph and mass spectrometer capabilities used for the quantitative and qualitative determination of individual components in complex mixtures. The general theoretical basis of any LC-MS instrument is based on the concept of primary separation of a mixture of chemicals by Van der Waals intermolecular interactions at the interface, followed by detection of individual components in a mass spectrometry chamber. In particular, the separated mixture is fed into the ionization chamber, the action of which is aimed at excitation of individual substances.
It is worth acknowledging that the choice of a particular ionization mechanism depends on the technical and financial capabilities of the laboratory, as well as the size of the target molecules. The electric Lorentz force acts on the charged particles, forcing the molecules to curve trajectories in an external magnetic field. The recorded dynamics of ion motion allows pinpointing their quantitative and probable qualitative composition. Thus, the principle of operation of LC-MS devices is realized by performing two procedures: liquid chromatography and mass spectroscopy.
Liquid Chromatography
Liquid chromatography is, first and foremost, a group of separation techniques in which compounds are distributed between a mobile liquid phase and a stationary phase with a large specific surface area over which the liquid phase moves. There are many variations of this procedure: liquid chromatography can be performed as paper chromatography, thin-layer chromatography, column chromatography, or high-performance liquid chromatography, which has a high research potential for laboratories (“Chromatography,” n.d.). In particular, for specificity in describing the mechanism of liquid chromatography, one of the most common techniques for separating components of a mixture, namely adsorption liquid chromatography, ALC, must be referred to.
The fundamental elements of the chromatographic process required to separate a binary mixture under ALC conditions are the column, the stationary phase, and the mixture of components to be separated. It deserves clarification that only highly porous solid sorbents or carriers with a liquid or gel on their surface can be used as the stationary phase of the chromatographic column. In particular, silica gel, aluminum oxides, or florisil.
This adsorbent is held in the chromatographic unit by two horizontal filters, hence, it is the stationary phase of the procedure (Figure 1). The organic solvent — called the mobile phase, or eluents — flows through the adsorbent under the action of the direct current. As they move along the column, the solvent molecules (the mixture being analyzed) begin to diffuse within the pores of the sorbent and, as a result of intermolecular interactions, adsorb on the surface of the stationary phase (Cheriyedath, 2019). The nature of the chemical molecules and the intensity of the Van der Waals forces retain the mixture’s components for a certain amount of time, and because of the different sorption constants, different parts of the mixture are sorbed at different rates.
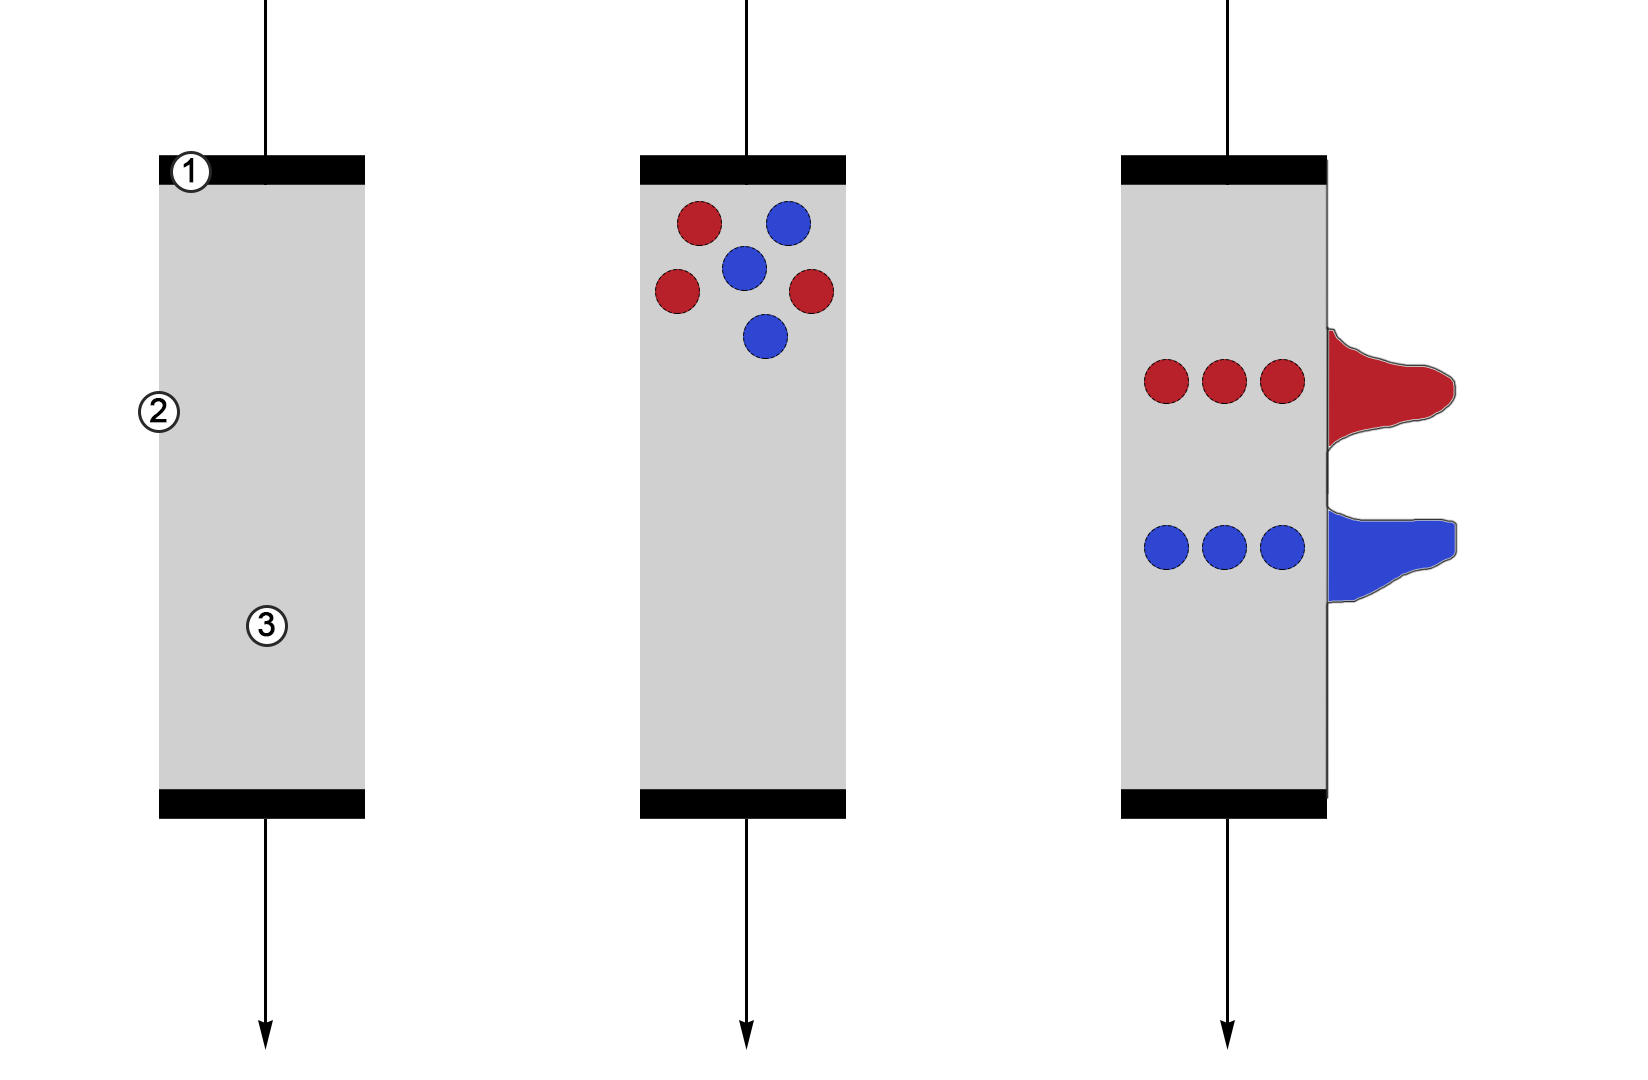
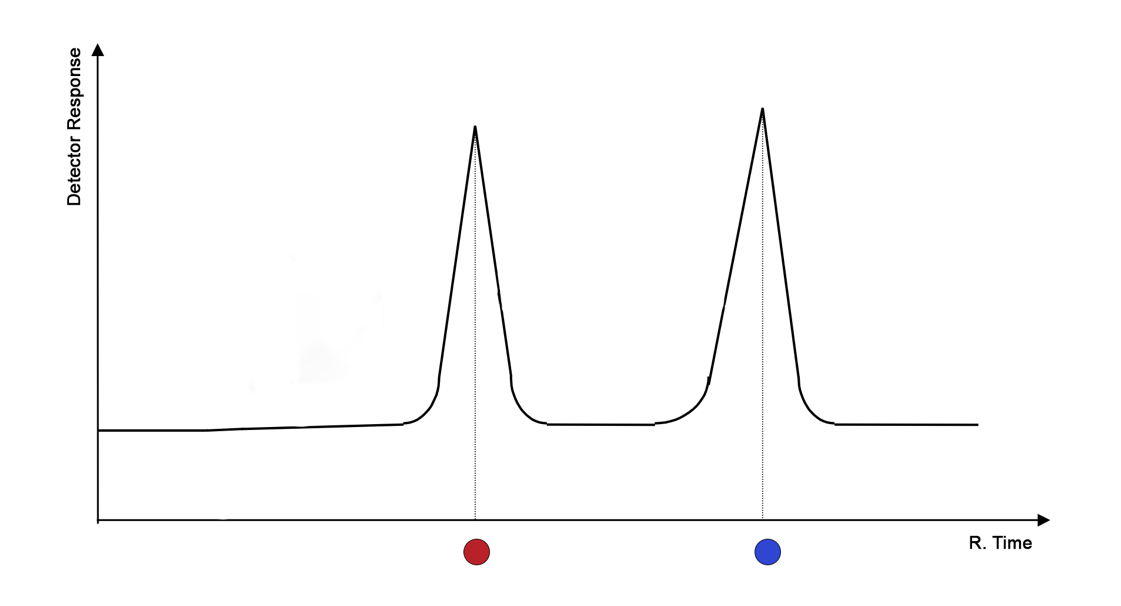
As the molecules of the separable substances move, provoked by gravity or artificially added pressure, with the flow of the mobile phase, the covered area gradually expands, but the concentration of the separable substances naturally decreases. This phenomenon gives rise to differences in final concentrations and yield times, which becomes the quantitative basis for signal registration. Based on the result of liquid chromatography, a two-dimensional chromatogram is constructed to visualize the dependence of the substance concentration on the retention time in the sorbent (Figure 2). In other words, the stronger the chemical-physical interaction between the two phases in the column, the more rightward on the abscissa axis the substance will be located.
It should be noted that chromatographic instruments do not usually directly measure the concentration of a substance in the mobile phase but use a special detector to measure some physical quantity functionally related to the concentration, be it conductivity or optical density. The instrument then converts this quantity into concentration values plotted along the ordinate axis. Moreover, measuring the area under each of the peaks allows to numerically determine the total concentration of the component in the mixture, which is a significant advantage not only for separation but also for identification of the substance.
As can be seen from the description of the principle of liquid chromatography, the time taken for the procedure is an essential characteristic of the efficiency of the separation and identification process. When working in the laboratory, it is worth considering that some of the substances may have an extremely high sorption capacity, which means that considerable time resources will be required for their complete removal from the column.
In this regard, it is advisable to use some of the process catalysts, among which the column pressure has the highest value. A standard liquid chromatography apparatus modified with a pressure injection device enables high-performance liquid chromatography, HPLC (Koester, 2016). Therefore, columns for high-performance liquid chromatography are characterized by high hydraulic inlet resistance. This procedure is a natural evolution of LC methods and therefore finds wide application in clinical laboratory testing to rapidly quantify components of a biological mixture.
Mass Spectroscopy
A second application for implementing the LC-MS method in the selective identification of the biochemical composition of infant blood is mass spectroscopy, based on the quantitative and qualitative measurement of liquid chromatography separation products. In particular, modern mass spectrometry is a subtle and sensitive method of analysis that features low limits of detection and registration of elements. The broad capabilities of the MS method allow specialists to identify the molecular and elemental composition of a substance of natural and synthetic origin (Loos et al., 2016).
It is worth keeping in mind that the main difference between mass spectrometry and other physicochemical analysis methods is that in MS, the determination of the particles of a substance directly occurs, rather than the emission or absorption of energy by atoms or molecules. For this reason, this method is not genuinely spectroscopic but is still classified as such. The reason is that the end result of this procedure is a graph resembling classic infrared or ultraviolet spectrograms.
The theoretical basis of mass spectroscopic measurements is determined by measuring the motion of a charged particle in a field, namely by calculating the ratio of an ion’s mass to its charge. During the unit’s operation, the charged particles move towards the collector with different velocities and therefore reach the detection endpoint at different times. This is because in the region of the accelerating electric field, equally charged particles, whether cations or anions, acquire the same energy, hence, the heavier the molecule, the slower it has time to gain speed, as described in Equations 1 and 2.

This phase must be preceded by the necessary ionization of the sample, followed by spatial or temporal separation of charged particles by their mass numbers in an electric or magnetic field. Thus, this method is destructive, which means that one cannot expect a qualitative match between the analysis products and the original substance (Loos et al., 2016). At the end of the processing of the analyzed sample, the spectroscopic instrument produces a two-dimensional graph showing the dependence of the measured quantity (ionic current, pressure, or intensity) on the ratio of the particle mass to its charge, as shown in Figure 3 for the phenylalanine amino acid.
Thus, the classical mass spectrum allows conclusions to be drawn about the molecular mass of a compound, its composition, and its structure. Simultaneously, the mass of the heaviest ion in the spectrum is usually equal to the molecular mass of the compound being analyzed, which is especially useful in the case of the identification of organic molecules.

It is easy to see that the spectrum is a set of peaks peculiar to a particular part of the abscissa axis. This phenomenon is justified by the possibility of forming transition ions, which create a contribution to the whole field. Each individual peak on different parts of the horizontal axis represents the products of successive destruction of the analyzed molecule. Thus, the peak itself can be composite, but if the experiment is performed correctly, this should not affect the quality of the substance identification procedure.
Finally, within the framework of the analytical chemistry instrumental method under discussion, the discussion of possible mechanisms of ionization of the substance is of profound importance since it is directly related to how the isolated infant’s blood is subjected to the identification. Standard mass spectroscopy practices can include electron ionization, chemical, electrical, laser, or other excitation options for organic molecules (Medhe, 2018). One of the most used methods is to bombard molecules with electrons in a vacuum chamber, resulting in ions formation. However, depending on the nature of the injected substance (or a mixture of substances), sample-gas interaction processes, the formation of a potential difference using a thin tungsten filament, or bombardment with noble gas atoms can be used.
Instrumental Background of the LC-MS
The use of the described theoretical foundations greatly simplifies chemical analysis when working with biological materials. Moreover, due to the versatile focus of both methods in LC-MS studies, laboratory professionals can achieve a synergistic effect that determines the high efficiency, sensitivity, and accuracy of the results obtained. To a large extent, this is only possible due to the successful combination of the two central instruments, which demonstrate excellent compatibility. The basic flowchart of the liquid column chromatography unit discussed above is shown in Figure 4, while the flowchart of the mass spectrometer is shown in Figure 5. Thus, combining the two units in series yields the schematic illustrated in Figure 6. A photograph of the actual instrument allowing LC-MS is shown in Figure 7.
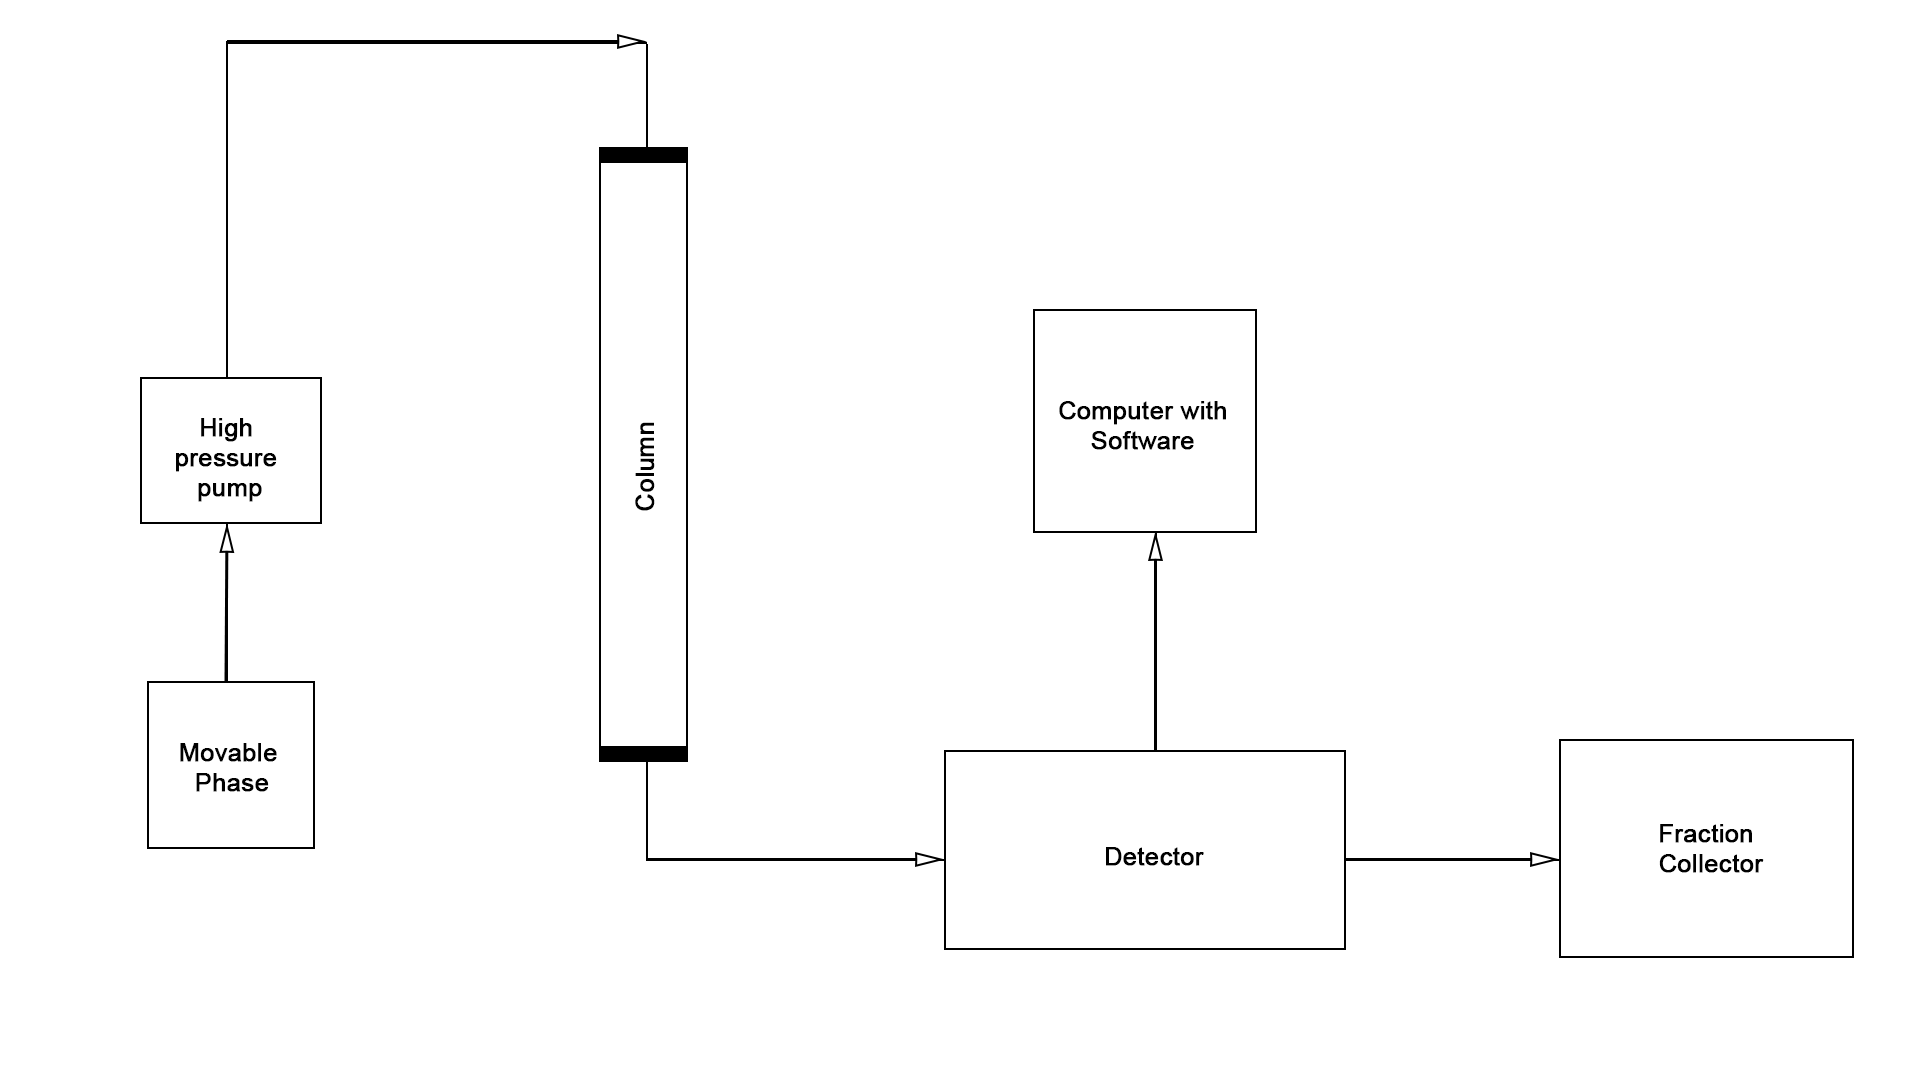
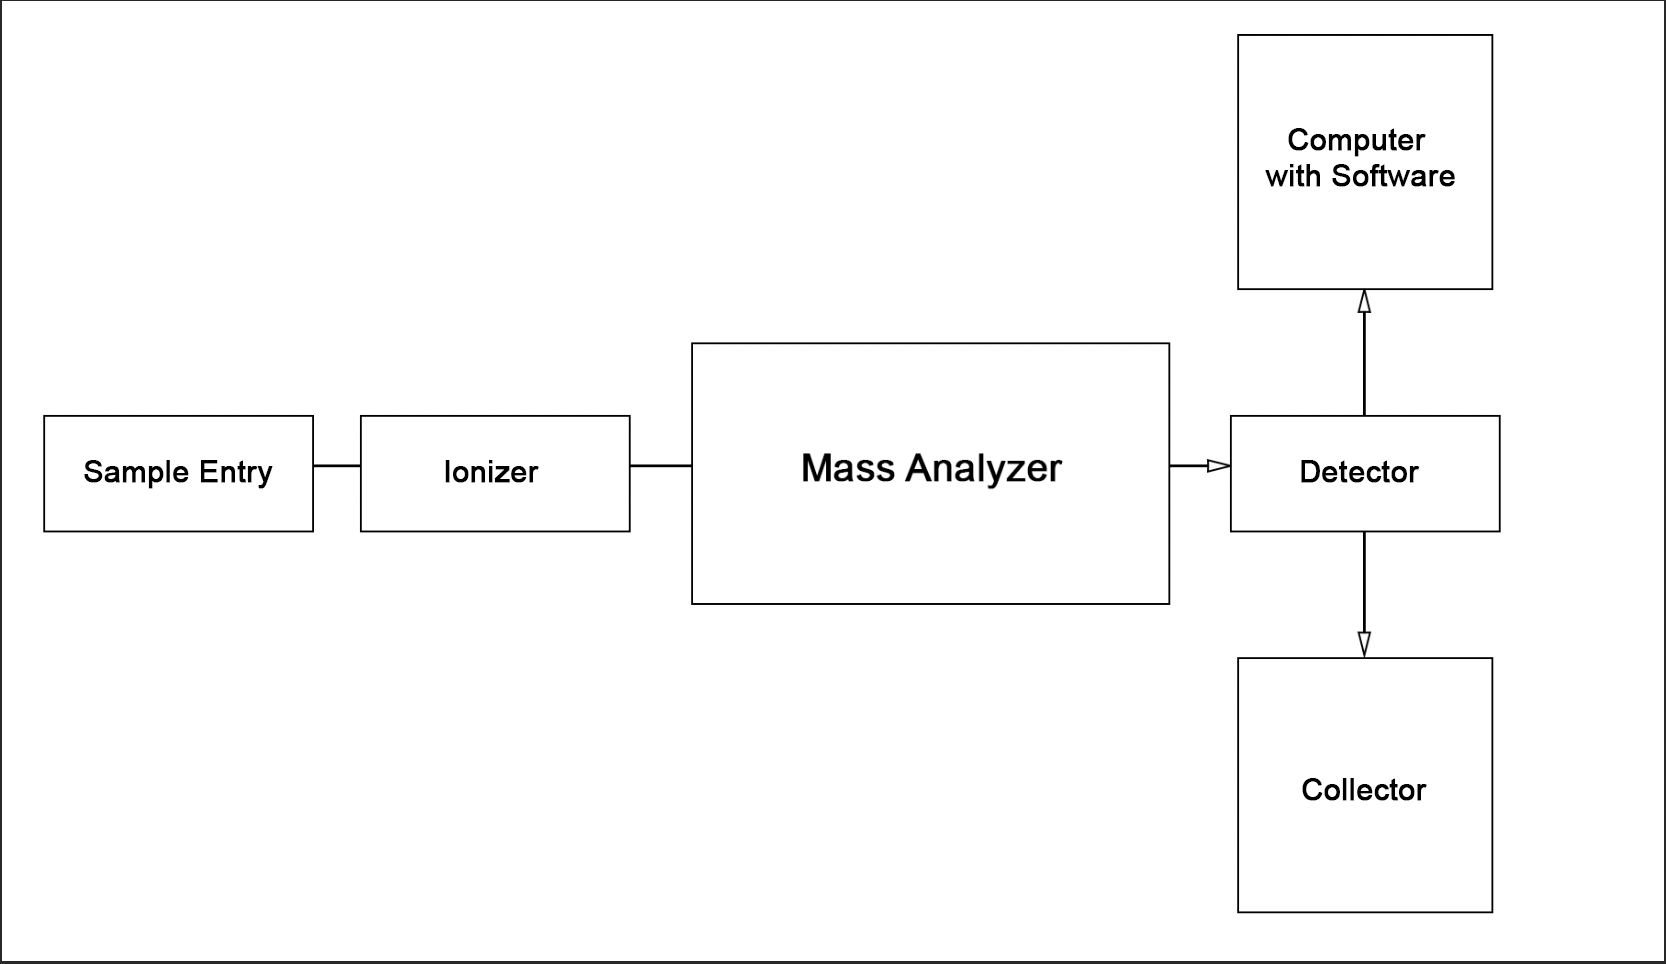
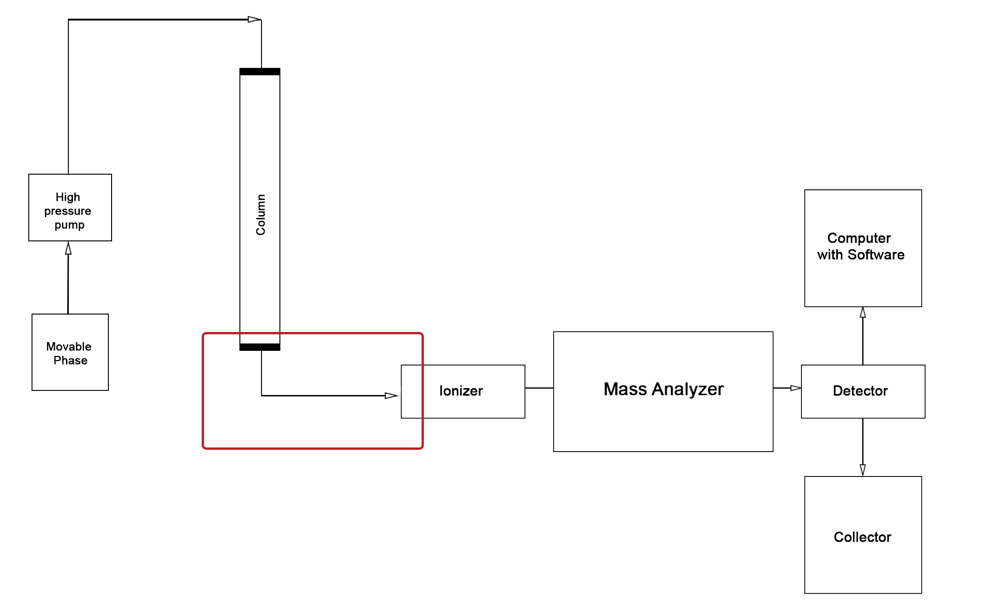
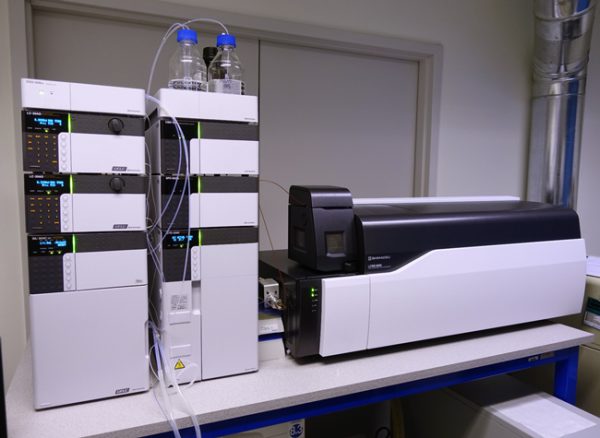
As illustrated in the figures above, the classic LC-MS instrument design consists of two system components, the reaction product of the first being fed to the second. Regardless of the apparatus’s specific focus, however, most chromatographs have four main parts, namely the biological sample introduction device, the chromatographic column, the detector, and the recorder (Figure 4).In the case of combined units, immediately after the chromatographic column in the instrument chain follows the mass spectroscopy chamber, the sample is ionized by any of the methods described.
The material for making chromatographic columns depends not only on the laboratory’s technical equipment but also on the nature of the eluent and sorbent. Traditionally, such columns have been made of metallic or glass materials, but recently quartz has become an increasingly popular choice for this task (“Silica columns,” 2019). The effective diameter of the latest columns is rarely huge and, on the contrary, is usually a few millimeters.
On the other hand, the column’s length is directly dependent on the materials chosen and can reach the mark of several meters. To allow long tubes to be placed in a temperature-controlled chromatograph chamber, that is, a thermostat, they are usually twisted into a spiral: a stationary phase is present in such columns. The standard procedure for introducing a liquid sample (blood) to be analyzed consists of a single biomaterial injection using a medical needle into a special injection nozzle.
Particular attention should be paid to the discussion of checking the purity and reliability of the recorded signals. Thus, to achieve a high quality of identification data, the device operation mechanism is checked using a pure individual compound. For this purpose, the mixture under study is divided into several samples, and a strictly defined amount of the control compound, the presence of which is assumed in this mixture, is injected into each of them.
If the identification by retention time is made correctly, the corresponding peak on the chromatogram after introducing the individual compound should increase. However, this method cannot be called unambiguous because there are many substances with identical retention times among the vast number of organic compounds, hence, preparatory work must be done to classify the likely compounds within the mixture being analyzed for a particular analysis.
The mixture’s separated components fall directly into the ionizer, which allows the individual molecules to be converted into excited states, synthesizing particles or ions whose trajectory in an external electric field is conditioned by their mass-to-charge ratio. An alternative to the use of strong magnets, which require high mains voltage, was the invention of quadrupole mass analyzers. It is worth noting that the quadrupole represents four symmetrically arranged circular electrodes, to which a specific combination of constant and inductive voltage is applied. Under the action of this electric force, ions fly parallel to the central axes of the electrodes and begin to oscillate.
Those ions whose amplitudes reach high values are neutralized upon collision with the electrodes. Only those ions whose mass-to-charge ratio values allow them to move freely in the quadrupole and be eventually detected acquire a fixed amplitude. Thus, not only the mass but also the charge of the components of the molecule is essential. It is essential to note that most mass spectrometers focus only on detecting positive ions and cannot identify anions at all.

LC-MS Analysis Procedure
Sample Preparation
Sample preparation of biological samples for medical applications analysis involves several sample processing steps and lengthy preparation times. Materials used for analysis in LC-MS facilities must meet non-volatile and appropriate molecular dimension requirements (“LC-MS sample preparation,” 2016). Blood isolated from an infant’s heel on the third day is immediately sent for analysis with initial sample preparation. It is worth noting that the choice of a particular day for infant blood sampling is due to the metabolic changes occurring in the infant’s body during the first two days: thus, if blood is sampled earlier, there is a high probability of inaccurate results and bias (“Neonatal screening test,” 2020).
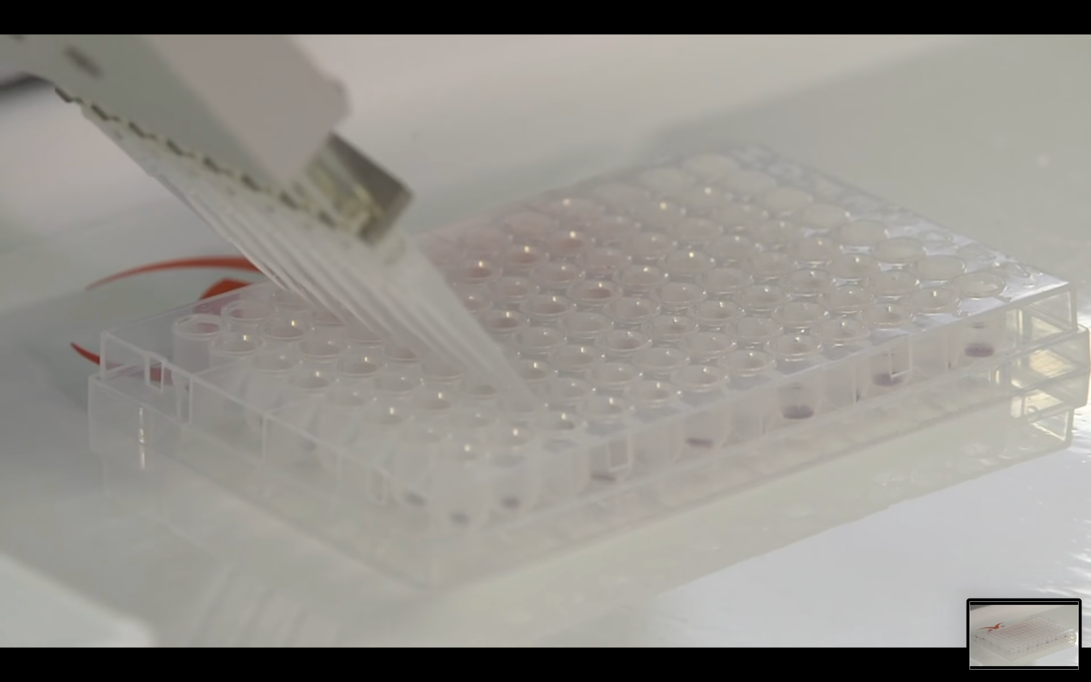
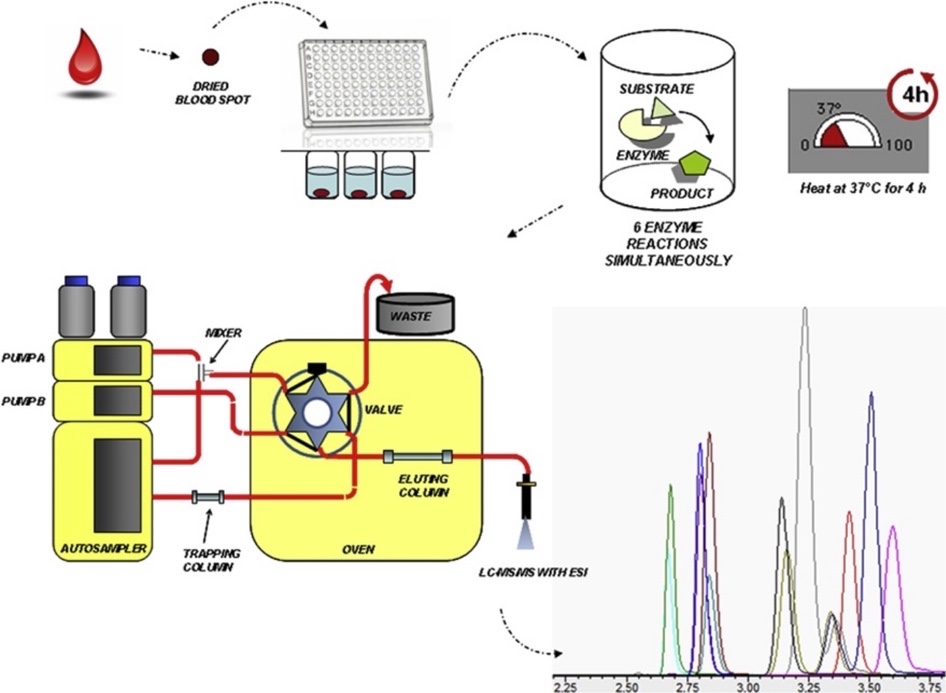
Thus, most often, isolated blood is processed using the dry spot method. In this method, drops of blood are applied to filter paper and subjected to drying. After that, an assay solution must be prepared in which, in combination with the extraction of the dried blood drops, a calculated amount of methanol is added to obtain the desired concentration. The resulting material is dispensed using a micropipette into a 96-well plate and sent to the next stage (Figure 9). On the other hand, if the LC-MS is equipped with an autosampler, the liquid chromatograph’s subsequent material processing stages are greatly simplified.
LC-MS Mixture Separation and Detection
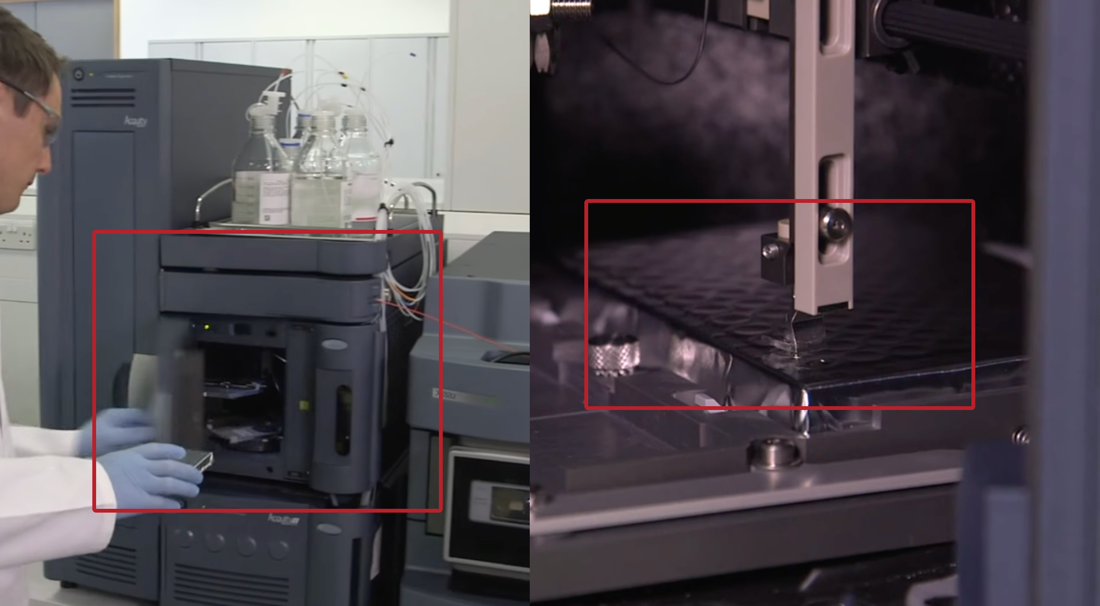
The prepared biomaterial is fed into a liquid chromatography chamber where, under the action of the added pressure of several tens of atmospheres, the blood flow rate is gradually increased to a constant preset value. More specifically, the components to be determined are introduced as part of the sample to be analyzed in a volume of 10-100 µl into the chromatographic column using a unique dosing device. The separated mixture exiting the column is fed component by component to the ionization chamber, where separation by mass occurs under an external field’s influence. It is worth recognizing that these processes remain uncontrolled by the technician because as soon as the medical engineer has placed the plate in the equipment (Figure 10), the interaction with the samples ends.
Computer Processing
Most modern LC-MS systems, mainly used in the neonatal clinical examination setting where time and quality of data acquisition are of crucial importance, are equipped with a computer to detect and record the signals being recorded automatically. The LC-MS output’s final chromatograms are a two-dimensional plot illustrating the dependence of the detection signals on the mass-to-particle charge ratio. It is worth admitting that the times when researchers had to perform calculations manually have rapidly gone, and modern computer analysis applications allow autonomously calculating the concentrations of initial substances and even predicting the nature of the substances detected in the spectrogram.
Undoubtedly, the resulting output spectrum is rarely immediately ideal for visual interpretation, hence, some additional software processing is necessary. The first step is to remove possible noise, usually performed using built-in functions (Ryding, 2018).
After that, the spectrum is slightly modified as a rule, and the peaks of interest become more prominent. It is worth noting that noise filtering can also be performed at the plant stage, but this requires narrower columns and smaller sizes of separated molecules. Finally, the resulting peaks can be subjected to visual analysis either utilizing built-in software functions, as described earlier, or by comparing individual values with a reference.
For example, the mass spectrum shown in Figure 11 unambiguously shows peaks at 60, 87, and 102. Considering that the highest value on the abscissa axis usually corresponds to the molar mass of the whole molecule, one can assume that the unknown substance in question is Butanoic acid, 3-methyl-. In this case, the peak at 87 may be characteristic of a cation that has lost one hydroxyl group. The detection of this spectrum in a newborn’s blood test may indicate possible abnormalities in the pH harmonization since the patient’s blood does typically not contain Butanoic acid, 3-methyl- or contains trace amounts of it. To summarize the procedure section, it is necessary to give a general drawing illustrating the whole process of work of the unit from the beginning to the end. Thus, this diagram is shown in Figure 12.

LC-MS Method to Newborn Screening
As noted earlier, newborn screening is a wholly safe but slightly painful procedure for the infant because blood must be pierced through the heel’s delicate skin or big toe to draw blood. On the other hand, this pain can be justified by obtaining high quality, reliable results that allow the patient’s possible pathophysiological conditions to be determined in advance. In this case, the parent is advised to go for this procedure, as it will help to predict the development of congenital diseases and, if identified, treat them in time before the first symptoms appear. The LC-MS method has already become routine in several developed countries, making it possible to identify many possible diseases.
The specificity of this method dictates notable limitations imposed on the range of possible examinations. In particular, LC-MS allows only metabolic pathologies to be examined, as the final result of the instrumental method is the detection of specific concentrations of individual molecules. Thus, with LC-MS, medical professionals can determine the qualitative and, more importantly, the quantitative composition of a newborn’s blood and then compare it to reference values. If any outstanding data are found, this can signal the development of the corresponding disease.
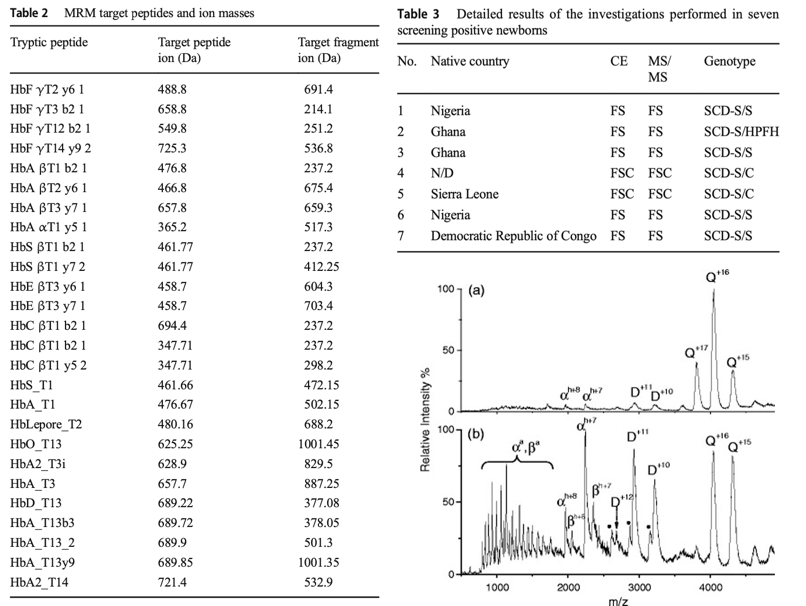
Examples of such pathophysiologies in which symptoms have not yet become apparent, as measured by the LC-MS, are numerous. This refers to the likely development of sickle cell anemia, in which the hemoglobin concentration is markedly reduced from the standard 12 g/dL (Hu et al., 2018). The results of a specific study conducted by a group of German scientists to reveal the effectiveness of the LC-MS for predicting sickle cell anemia are presented in Figure 13. It is a table of the masses of the individual components of the complex Hemoglobin protein, some of which are clinically associated with pathophysiology development. The figure’s upper right side shows results for seven patients from different countries whose blood was found to have reduced hemoglobin content.
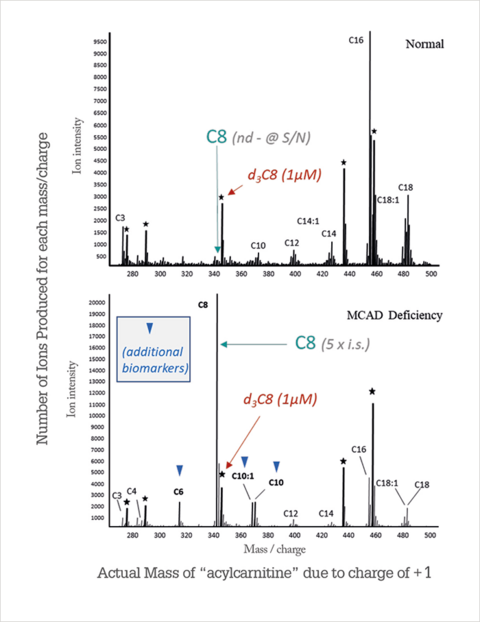
Another stunning example of clinical identification of biologically active molecules in a newborn’s dry bloodstain is L-carnitine’s determination. It is a useful substance synthesized by organisms in large quantities that are most often localized in the transverse striated muscles and liver. L-carnitine’s functional role is limited to the transport of long-chain fatty acids into the mitochondria through inner membranes to initiate beta-oxidation processes, accompanied by energy release. In other words, this molecule is an essential substance for catabolic processes. L-carnitine deficiency translates into morbid conditions with hepatic obesity, muscle weakness, coma, and even death. Screening the levels of this molecule allows us to predict the development of these conditions and, as a result, put the patient on a low-fat diet in time (Chace, 2018).
The results of L-carnitine measurements in a healthy and sick newborn patient are shown in Figure 14. It can be seen that the metabolic profile of eight-carb acylcarnitine for the sick patient is five times higher than the standard value, indicating accumulation of fatty acid metabolites in the mitochondria, which are typically removed by L-carnitine. Thus, compulsory lifetime diet and physician monitoring are introduced for this patient from the first days of life.
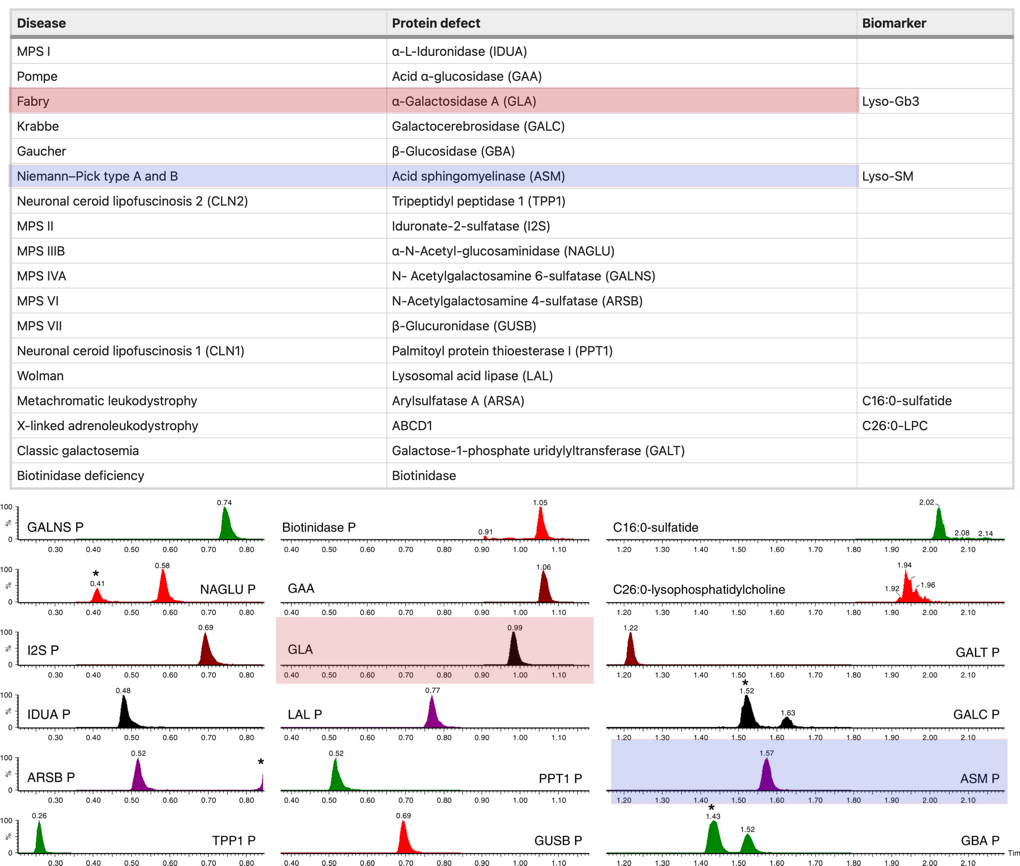
The logical development of the LC-MS method aims to increase the resolvability of the methods and reduce the main determinants of efficiency: speed of execution, cost, and covered substances. It is worth noting that American scientists in 2020 proposed a multiplex analysis to assess at least eighteen possible disorders in parallel. Moreover, the analysis time was significantly shortened to no more than three minutes. In other words, a health care provider could obtain a metabolic profile and interpret it in such a short period.
Conclusion
In conclusion, despite significant advances in medical technology, LC-MS continues to be a unique method for quantitative and qualitative identification of biomaterials with high accuracy and specificity to the target substance, especially in the presence of metabolites. The use of LC-MS in neonates allows early detection of and timely response to possible pathophysiological conditions. In this paper, the theoretical background of the method has been discussed in detail, the instrumental part of the unit has been reviewed, and the possibility of applying LC-MS to the detection of primary disorders has been shown with specific examples.
References
Butanoic acid, 3-methyl-. (2018). NIST. Web.
Chace, D. (2018). The birth of MS/MS screening. The Analytical Scientist. Web.
Champagne, A. (2017). LC-MS/MS: What is it? Why use it? Material Analysis. Web.
Cheriyedath, S. (2019). Liquid chromatography versus gas chromatography. News MLS. Web.
Chromatography. (n.d.). Web.
Diabetes. (2020). WHO. Web.
Hong, X., Sadilek, M., & Gelb, M. H. (2020). A highly multiplexed biochemical assay for analytes in dried blood spots: application to newborn screening and diagnosis of lysosomal storage disorders and other inborn errors of metabolism. Genetics in Medicine, 22, 1-7.
Hu, Z., Chang, S. M., Younis, R., & Alvarez, O. A. (2018). Optimal hemoglobin level for pediatric sickle cell patients who undergo adenotonsillectomy. Blood, 132(suppl 1), 4938-4945.
Introduction to mass analyzers. (2019). Shimadzu. Web.
Koester, V. (2016). What is HPLC? Chemistry Views.
LC-MS sample preparation. (2016). ThermoFisher. Web.
Lobitz, S., Klein, J., Brose, A., Blankenstein, O., & Frömmel, C. (2019). Newborn screening by tandem mass spectrometry confirms the high prevalence of sickle cell disease among German newborns. Annals of Hematology, 98(1), 47-53.
Loos, G., Van Schepdael, A., & Cabooter, D. (2016). Quantitative mass spectrometry methods for pharmaceutical analysis. Philosophical Transactions of the Royal Society A: Mathematical, Physical and Engineering Sciences, 374(2079), 1-25.
Medhe, S. (2018). Ionization techniques in mass spectrometry: A review. Mass Spectro Purify Tech, 4(1), 1-6.
Mucopolysaccharidoses fact sheet. (2020). NIH. Web.
Neonatal screening test. (2020). Pregnancy. Web.
Olsson, R. (2019). The importance of newborn screenings. Banner Health. Web.
Phenylalanine. (2018). NIST. Web.
Ryding, S. (2018). How to read LC-MS chromatograms. News MLS. Web.
Silica columns. (2019). MZ. Web.
Scolamiero, E., Casetta, B., Malvagia, S., Tanigawa, T., Forni, G., Funghini, S., & la Marca, G. (2019). Development of a fast LC-MS/MS protocol for combined measurement of six LSDs on dried blood spot in a newborn screening program. Journal of Pharmaceutical and Biomedical Analysis, 165, 135-140.
Temneanu, O. R., Trandafir, L. M., & Purcarea, M. R. (2016). Type 2 diabetes mellitus in children and adolescents: a relatively new clinical problem within pediatric practice. Journal of Medicine and Life, 9(3), 235-239.
Thiele, A. G., Gausche, R., Lindenberg, C., Beger, C., Arelin, M., Rohde, C., & Scholz, M. (2017). Growth and final height among children with phenylketonuria. Pediatrics, 140(5), 1-14.
Waters Corporation. (2018). Tandem mass spectrometry for diagnostic screening. Web.