DEYAAR Technical Analysis
- Each company seeks to grow, and growth margins are eminent when there is an upward trend.
- Trends in several aspects of business practices including sales output can indicate growth in a company.
- Some companies within the UAE have been growing, while others dwindling in performance.
- Using the Bollinger Bands, SMA, MACD, and the RSI, this paper analyzes the growth momentum of DEYAAR Company.
Each company seeks to grow, and growth margins are eminent when there is an upward trend. Trends in several aspects of business practices including sales output can indicate growth in a company. Some companies within the UAE have been growing, while others dwindling in performance (Person, 2007). Using the Bollinger Bands, Simple Moving Average (SMA), Moving Average Convergence-Divergence (MACD), and the Relative Strength Index (RSI), this paper analyzes the growth momentum of DEYAR Company.
Bollinger Bands
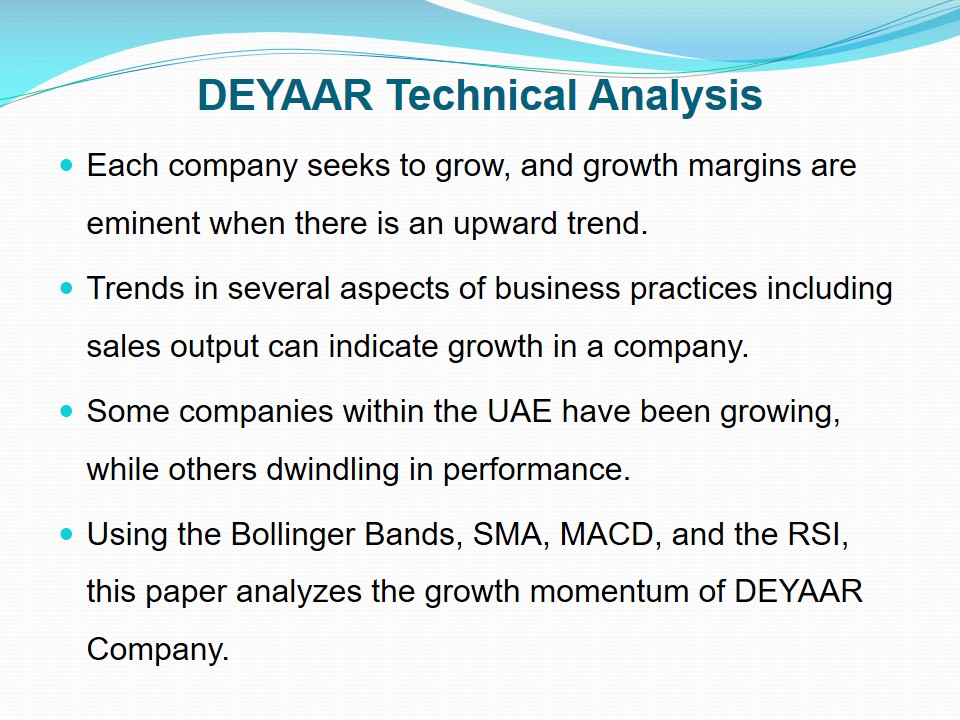
Bollinger band comprises of two price channel lines (known as bands) and a centre line indicating moving average. Measuring the price volatility, the bands either expand or contract depending on the price trends. As indicative in the Bollinger Band chart provided from DEYAAR company, the trends in the performance of the company shows a fluctuating performance but an uptrend (Bollinger Bands, 2011). A strong uptrend as is when prices fluctuate between the upper line (band) and the moving average (which is the 20th day of the month). The Bollinger chat above indicates an uptrend in the market stocks for DEYAAR company (GulfBase, 2014).
MACD
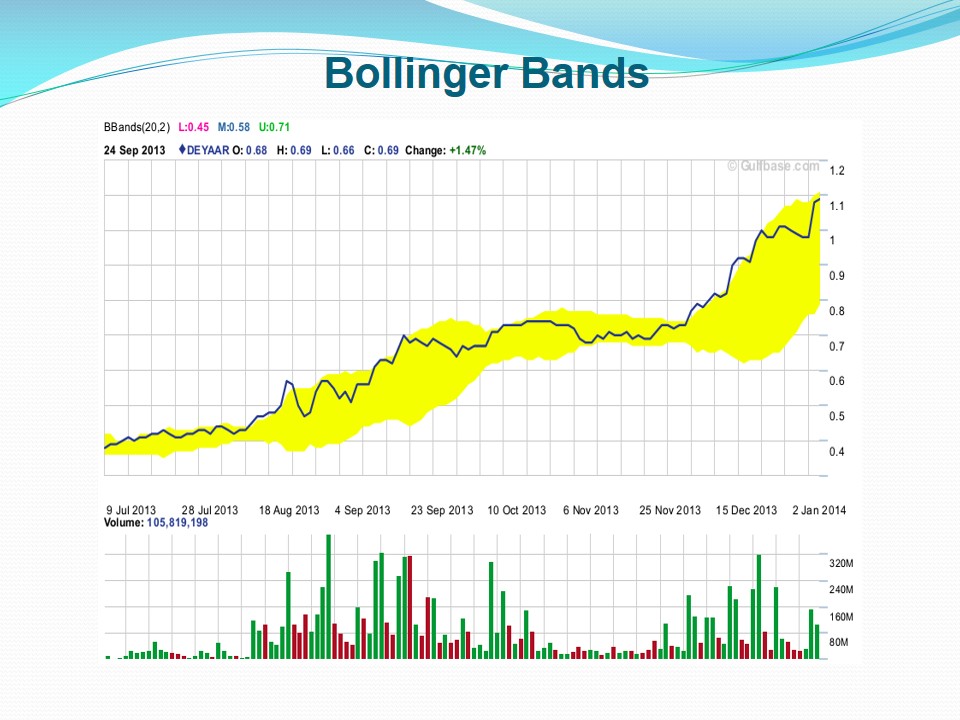
Moving Average Convergence-Divergence (MACD) is a technical analysis tool that examines and measures the differences between two moving averages. The MACD has two important aspects to consider. When the 12-day Exponential Moving Average (EMA) trades above the 26 day EMA, this is a positive MACD (12, 26). The chat above indicates MACD as (12, 24), meaning that the 12-day EMA is trading slightly below the 26-day EMA (GulfBase, 2014). However, this is somewhat a positive MACD in DEYAAR as the 12-day trading is more significant in analyzing momentum.
Relative Strength Index (RSI)
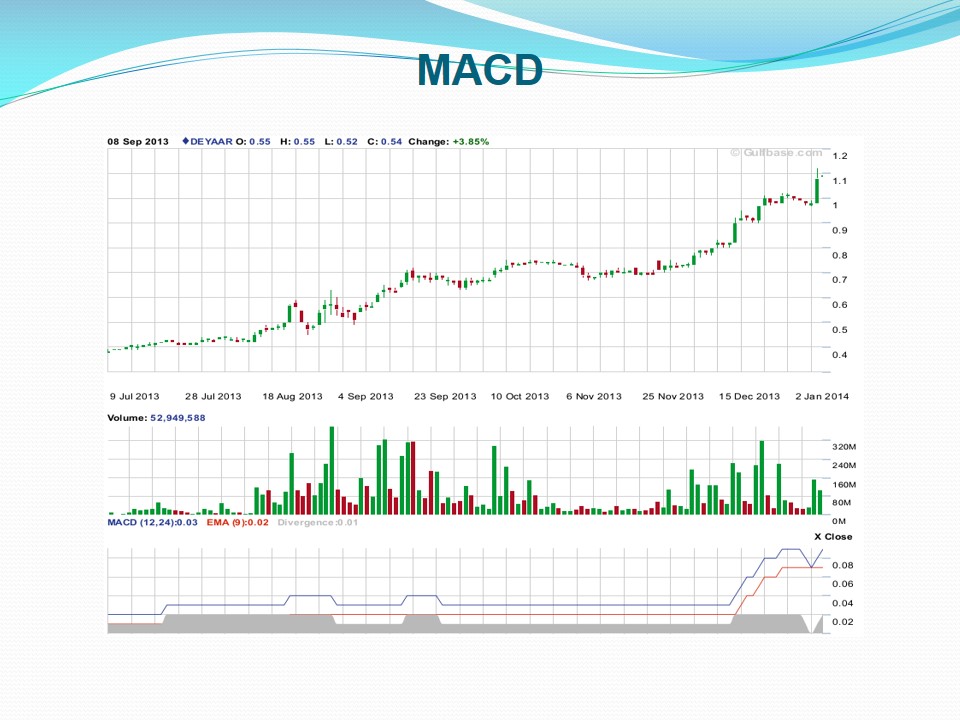
Relative Strength Index (RSI) is a technical analysis tool used in identifying the trends direction in the stock business performance. Uptrend range between RSI 40-80, while downtrend range between RSI 60-20. From the above RSI chart, DEYAAR has an RSI of (14):59.3912 ((GulfBase, 2014). Most of the stock performance as per the graph are above RSI 40, hence an uptrend in DEYAAR.
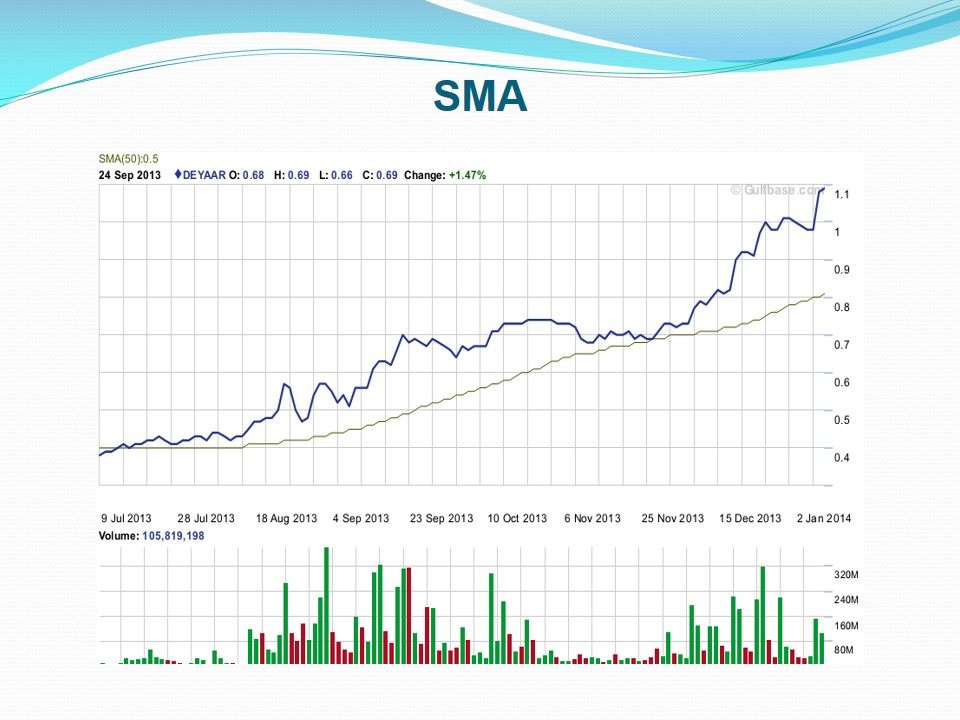
SMA
It is an average statistical tool that encompasses calculating the moving average by adding details of the closing price pertinent to the security within the stipulated time periods, and diving the total by the number of time periods available. When the SMA is relatively close to average, the company’s performance is an uptrend (Stock Chats, 1999). An average of SMA (50) in DEYAAR indicates an uptrend.
Summary: Uptrend in Stock Performance
- From the four analytical tools, the trend in the performance of DEYAAR stocks is an uptrend.
- The graphs provided by the analysis, have a clear indication that the performance of the company is increasing, as indicated by its stock rates.
- The behaviors of the trends in the graph show that the output of the company in terms of stock market is escalating with a given time.
- In terms of growth, the information provided in the Bollinger Bands, indicate clearly that DEYAAR is on a upward trend in growth.
- In the Moving Average Convergence-Divergence (MACD), the company continues to demonstrate a positive growth in the stock market performance.
- Similar results are eminent in the technical analysis tools, Simple Moving Average (SMA) and the Relative Strength Index (RSI).
Conclusion
- Using the four aforementioned technical analysis tools, the trend in DEYAAR’s business performance is on the rise.
- This means that it is true that real estate business in UAE is on a booming trend, as it is dominating the stock market.
- Being powerful technical tools, the results indicating DEYAAR as an uptrend business are quite influential in this analysis.
References
Bollinger Bands (2011). Technically Speaking. Web.
Gulf Base (2014). DEYAAR Development Co: Technical Analysis. Web.
Stock Chats (1999). Moving Average Convergence/Divergence (MACD). Web.
Person, J. (2007). Moving Average Formula & Strategy Guide. Web.