Background
The growth of a startup is one of the most significant issues affecting the teams behind new companies. While AppX has made significant impacts, reaching profitability after two years, the company continues to face challenges from its competitors, thus affecting its revenue. This analysis checks the company’s nets ads per month, user growth rate trends, monthly churn rate, sign-up to activation, activation to paid, and sign-up to paid rates. It uses the identified metrics to estimate the company’s expected performance. The metrics identified are crucial as they indicate key customers’ data, such as customer lifetime value (CLV) and revenue the company makes.
Metrics as Performance Indicators
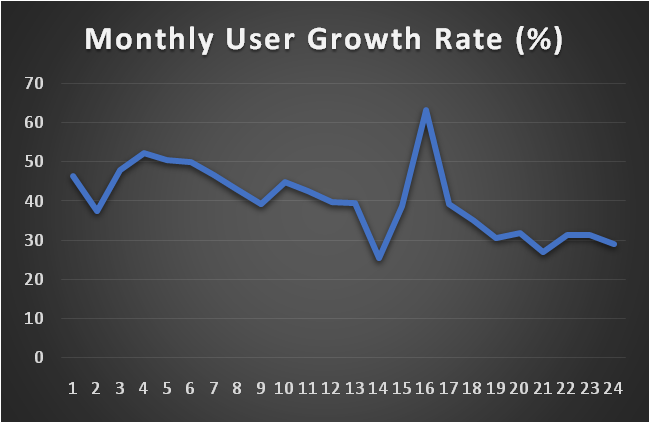
Software–as–a–service providers depend significantly on the number of customers using their solutions at any given time. This makes tracking and understanding how the number of users grows over a given period essential. According to Naidu (2019), several factors contribute to users becoming more active in using a given solution. An examination of AppX’s data shown in Figure 1 reveals that the company’s growth rate is reducing with time, which may be a red flag for the organization. The growth rate is also crucial as it indicates if the customers love the solution or not. A growth rate declining from 46 percent in the first month to 29 percent in the 24th month reveals that customers are finding issues with the software, and fewer people have become interested in the product. Having a small growth rate means the company will spend more on advertising but not convert the reached users to paying customers.
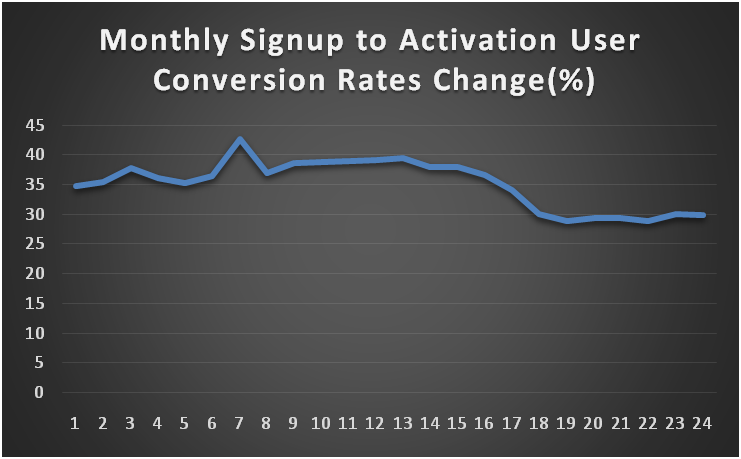
The company’s sign-up to activation rate was initially at 35 percent when the product was introduced and got some interest, peaking at 43 percent after seven months, as shown in Figure 2. However, the subsequent months reveal a steady decline in the number of users showing interest and those starting to try the product. The metric indicates that the company is spending money on advertising its solution and explicitly targeting users who are inappropriate for the software. Thus the company continues to spend money on marketing but does not convert those reached to users of the product. Marketing to the wrong target will continue to cost the organization as it will be spending money and not getting a return on its investment.
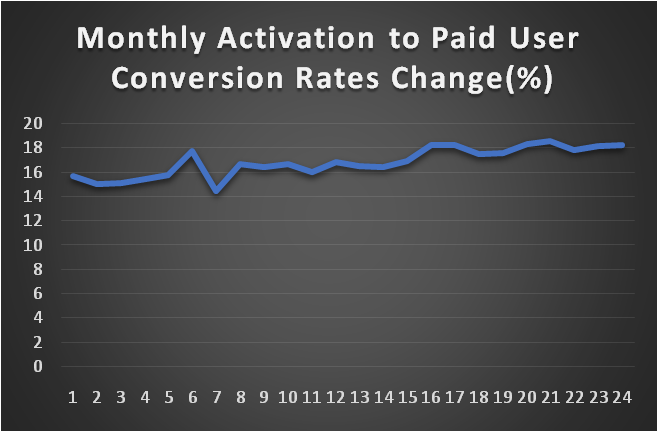
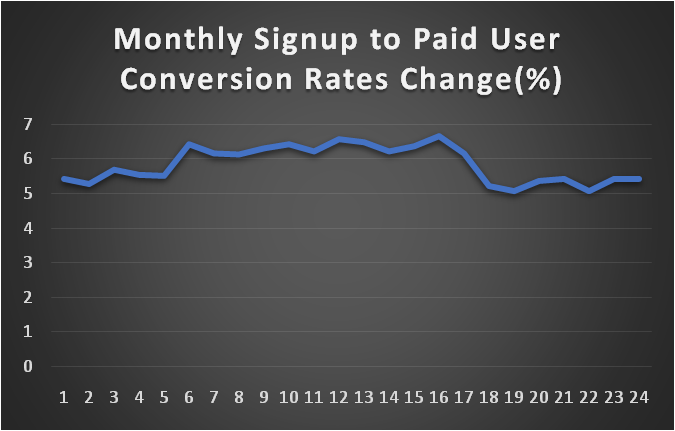
Activation to paid users reveals the extent to which the solution meets customers’ expectations. A low rate indicates that the users do not find the software worth paying for, or it is overpriced. According to Naidu (2019), software companies are increasingly adopting freemium services that match their customers’ budgets to win the competition wars. In Figure 3, the data shows that the company’s activation of paid users rose from 16 percent in the first month to 18 percent in the 24th month. An increasing monthly activation to paid user conversation rate shows that the company will get more revenue in 2022 as more customers use the software. The monthly sign-up to paid user conversation rate reveals a steady trend, as shown in Figure 4. This metric shows that the number of those reached via adverts eventually subscribed to use the software. Therefore, a rising rate indicates that the company can expect better performance in 2022, as more customers will pay for the solution offered by AppX.
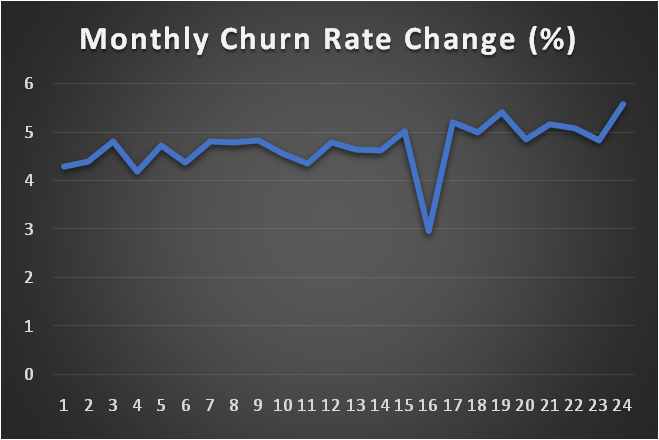
The company’s churn rate is low, although there is a rising trend. Figure 5 reveals that the company’s churn rate is rising, steadily moving from four percent in the first month and six percent in the 24th month. The graph shows that only four to six out of a hundred registered paid users remain after a given period, revealing that most people could be leaving AppX due to its pricing. Since the rate increases continuously, more registered users will be retained as paid customers, thus giving the company more revenue. Therefore, the company must reconsider its pricing approach and introduce alternatives that meet its customers’ budget.
Implication of the Revenue Metric on the Company’s Performance
The metrics reveal that AppX is losing more customers, even though its conversion to paid users is increasing. Since the company currently uses $20 million in marketing and sales, if it continues with its current practices, it will incur more costs as it tries to get more paying customers. However, this value can be reduced if the company can target a specific market, sell to it, and provide better software to meet its users’ needs. The marketing budget would go down and increase paid users with unique targeting.
Recommendations
The graphs reveal that AppX has low metrics attributed to its pricing, competition, and product design, which affect its future revenue. The following recommendations are crucial based on the potential impacts of these metrics on the company. Firstly, the company should introduce a new discounted subscription plan to attract more users to utilize the product for longer. Doing this will help the company to increase its monthly churn rate and the number of customers paying for the product. Moreover, introducing flexible plans will give the company a pricing advantage over its competitors. Secondly, AppX should hire a developer to improve the product’s user-friendliness and efficiency. This will improve the product’s quality metric and competitive edge against competitors and attract more customers to use the product. Thirdly, the company should change its marketing practices and shift from content marketing to other options such as search engine optimization and referral programs to reach more customers. This can also help AppX increase its chances of reaching more paid customers.
Reference
Naidu, H. (2019).What makes a SaaS company cross the chasm? –Analysing factors that make customers purchase a freemium service (Doctoral dissertation, Dublin Business School).