Disney’s capital structure was assessed using information acquired from Yahoo Finance. Trends in total assets, total liabilities, shareholders’ equity, and long-term debt were evaluated to arrive at a final conclusion. Additionally, three financial ratios, include debt ratio, debt-to-equity ratio, and capitalization ratio. The selected data and ration analysis results are provided in Table 1 below.
Table 1. Disney’s capital structure analysis
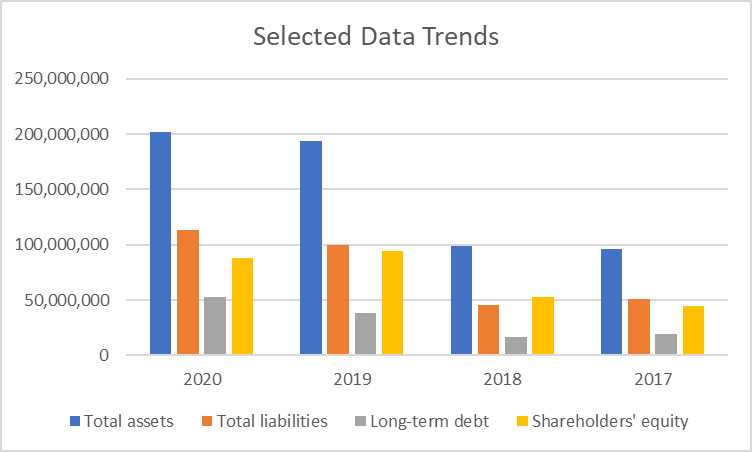
The balance sheet demonstrates that Disney experienced a significant rise in total assets in 2019 in comparison with previous years. The matter can be explained that Disney completed the largest acquisition in its history by buying by purchasing 21st Century Fox (particularly, the film and television catalog from 20th Century Fox). The analysis demonstrates that the purchase affected both total liabilities and total assets, which implies that the purchase was made using both debt and equity. The visual representation of trends in the selected data from the balance sheet is provided in Figure 1 below.

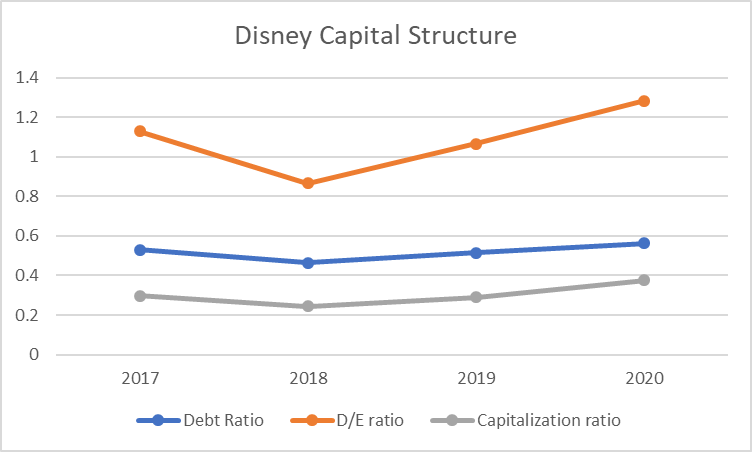
The historical analysis of the ratio demonstrates that Disney has been gradually increasing the share of debt in its capital structure. In 2018, all three ratios decreased as the company continued to pay off its long-term debt. However, in 2019, the company purchased the 21st Century Fox for more than $71 billion, which was partially financed by debt. As a result, the debt ratio increased by 0.08, the D/E ratio increased by 0.2, and the capitalization ratio increased by 0.05. In 2020, Disney was forced into additional debt to finance its operations due to the COVID-19 pandemic. The result of such actions was that the company’s debt ratio increased by 0.04, the D/E ratio increased by 0.21, and the capitalization ratio increased by 0.08. Thus, it can be stated that the trends in the capital structure of the company are worrying, as increased debt may lead to a decrease in the company’s flexibility and profitability. However, the current level of D/E ratio of around 1 is adequate. On average, Disney relies on debt and equity in equal shares. The trends in the three ratios are visualized in Figure 2 below.

In order to understand how Disney’s capital structure compares to the industry, two major competitors of the company, including Fox and Comcast, were analyzed using similar ratios. The weighted averages for the three ratios for the past four years are demonstrated in Table 2 below.
Table 2. Industry comparison
The analysis demonstrates that among the three companies Comcast has the highest leverage, while Fox has the lowest reliance on debt. According to all three ratios, Disney’s capital structure is adequate in comparison with its competitors. All the three companies under analysis experienced a significant increase in leverage in 2020 during the pandemic. Thus, if the situation with COVID-19 stabilizes, no concerns should arise about Disney’s capital structure.