Introduction
Terrestrial plants are primary producers in an ecosystem, and as such, they utilize light energy from the sun to manufacture food in a process called photosynthesis. To be specific, the Sun’s spectrum that is useful for this process is that emitting photons that fall within the visible spectrum with wavelengths ranging between 380 and 750 nm.
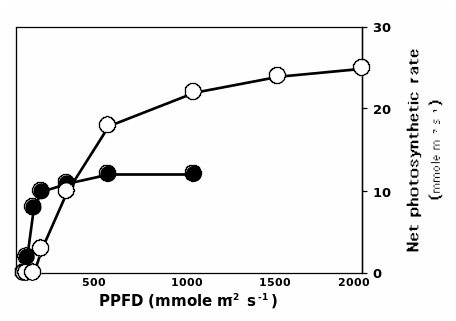
Among the plant biologists, this spectrum is known as Photosynthetically Active Radiation (PAR), i.e. µmole m-2 s-1. Under normal circumstances, the rate of photosynthesis would be enhanced by an increase in light intensity. A plot of the rate of photosynthesis against PAR would assume a curvilinear trend as shown in figure 1.

Since sunlight is the basic component for photosynthesis, in an ecosystem characterized by a diversity of plant species, competition is inevitable. Natural selection is the order of the day and hence the species with the best survival techniques would survive. Plants develop adaptive features that are often manifested biochemically, morphologically and physiologically to optimize on the capture of sunrays. Terrestrial plant species can be categorized as either “shade tolerant or shade intolerant (sun plant)” (Horn, 1971).
With these two categories, we can distinguish these terrestrial species characteristics qualitatively as summarized in appendix 1. Within each category, the gravity of tolerance or intolerance differs significantly amongst the different species. For instance, we explore two varieties of species, beech sugar and maple tree, which are both shade tolerant. Nevertheless, the former is relatively more shade tolerant (Huisman & Weissing, 2001).
Shade tolerant species would optimize their rate of photosynthesis under limited light relative to its counterpart (see graph 1). In a niche where light is the limiting factor, the composition of the resulting species is a factor of aggressiveness to light of the co-occurring species.
In a typical “temperate deciduous forest ecosystem, very little light penetrates to the forest floor where seedlings and saplings of the new generation of trees are located” (Larcher, 1995). As a result, these understory species derive their light from sunflecks, diffused light and the sunrays that pierce through to the ground thanks to the gaps created due to tree-falls.
In an effort to comprehend the plant dynamics with respect to varying light intensity, Woods’ case study was conducted in Michigan. Basically, this region represents a beech-sugar-maple forest of a kind that still survives following human settlement in the northeastern part of the US. It is a typical example of how light variation influences the species composition. Recent studies conducted by ecologists named this niche a ‘climax’ forest.
They reckoned that this system had attained a stable steady-state whereby only those species that can endure self-autogenic effect would dictate the entire system. The key autogenic effect in this ecosystem is shade. The hypothesis predicting the pattern of succession suggests that the ultimate succession is characterized by a relatively more homogeneous species, and is relatively conquered by shade-tolerant species. The reverse is true for early to mid succession ecosystems (Moorcroft & Pacala, 1998).
Hypotheses
The data collected is used to test the following hypotheses:
- Hypothesis 1A (H1A) – species diversity in a forest understory is affected by the light regime.
- Hypothesis 2A (H2A) – since beech is more tolerant to shade, it will reveal a relatively greater morphological plasticity following variations in light intensity.
- Hypothesis 2B (H2B) – the sugar-maple would grow faster than the beech following a gap opening.
- Hypothesis 2C (H2C) – beech would dominate the shade species and the opposite would be true for maple sugar following a gap opening.
- Hypothesis 3 (H3) – the leaves of shade species have shallow sinuses relative to those occurring in the sun species.
Materials and Methods
For the first hypothesis (H1A), the light intensity of two niches, one with a gap and the other with a continuous canopy, were determined. This was achieved courtesy of a 20 by 20 meter quadrant. Random analyses at 5 different locations per niche were measured and recorded. This was followed by establishing the number of maple and beech species per quadrant.
For the second hypothesis (H2A), 3 pairs of relatively equal sized seedlings or saplings (maples and beeches) derived from the same niche were identified. Five healthy leaves from the plant species were then analyzed to determine the specific leaf weight (SLW) (mg cm-2) and the specific leaf area (SLA) (cm2 gm-1). The leaf area was determined by the leaf area meter, while the leaf weight was a measure of the dry weight. Drying was achieved inside an oven at a temperature of 75°C for a period of 3 minutes.
For hypothesis H2B, maple and beech seedlings of between 6 to 8 inches were analyzed in this experiment. The seedlings were specifically derived from the same niche, growing pretty close to one another to neutralize the effects of light variations. Two pairs of seedlings were analyzed i.e. either from shade or gap.
The rates of vertical and horizontal growth were determined from branches by measuring the distances between 5 consecutive buds (see appendix 2). This was later used to determine the rate of growth, and as such, the corresponding seedlings were compared.
For hypothesis H2C, a guardant of 20 by 20 meters was used to determine the species population ratios for either gap or shade ecosystems. In each quadrant, the numbers of beech or maple species were determined. The ratio of beech to maple sugar was then established for both shade and gap environs.
Results
For the first hypothesis, as portrayed in appendix 3 below, the species diversity of an understory is a function of light availability. The gap system has a 1531% average light intensity more than shade system. The number of species present in the gap system is 5 more than that present in shade system.
Standard deviation of gap and shade systems = 123.173, 14.92 respectively.
For H2A, as exhibited in appendices 4A, 4B and 4C, the p-values for Gap vs. Shade species are as below:
For leaf area (Beech) had a p-value of 0.007 which is < 0.05, we therefore reject the null hypothesis and state that there is no significance difference in the change of leaf size when comparing gap vs. shade species. On the other hand, maple leaf size (0.168>0.05) exhibit a significant difference in gap vs. shade species.
For leaf dry weight: for the beech (p-value = 0.012<0.05), we reject the null hypothesis and state that there is no significance difference in leaf weight on gap vs. shade species. The opposite is true for maple species (p-value = 0.575>0.05) and hence we retain the null hypothesis.
For the specific leaf area (SLA), we retain the null hypothesis for beech species (p-value 0.0541< 0.05) and state that there is significance difference in the SLA for gap vs. shade species. The opposite is true for maple (p-value = 0.033<0.05) where we reject the null hypothesis. Finally, for specific leaf weight (SLW), both species have p-values > 0.05 thus, we retain the null hypothesis and state that there is significance difference in SLW on the gap vs. shade species.
For H2B, the below table is obtained:
Table 1
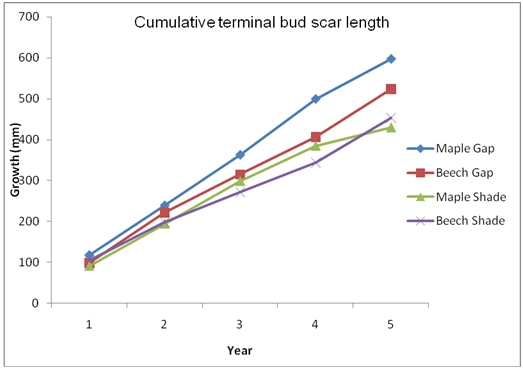
From appendix 5, the following trends of growth rates of both maple and beech species can be attested.
Graph 2 of cumulative growth rates of species.

For H2C, the ratios of maple to beech species are shown below.
Table 2
At p-value 0.75 (>0.05), we retain the null hypothesis and state that the ratio of beech to maple would be > 1:1 in shade and < 1:1 in gap.
For H3, according to appendix 6, the p-value (0.48) obtained is less than 0.05 hence; we reject the null hypothesis. As such we state that there is no leaf morphological difference in gap vs. shade species.
Discussion
The main objective was to study leaf dynamics of maple and beech species with respect to changes in the light intensity. A number of hypotheses were formulated with regard to the same, specifically, species diversity in a forest understory is affected by the light regime (H1A). The results obtained echoed these findings, portraying an increase in species density to a tune of more than 1500% increase once exposed to gap.
This is owed to species diversity where extra 5 species were identified in the gap system. We also hypothesized that since beech is more tolerant to shade, it would reveal a relatively greater morphological plasticity following variations in light intensity. This hypothesis was tested by the leaf area, leaf dry weight, SLA and SLW. With the findings established by this research, however, only the SLW attested this hypothesis.
The others gave contradicting results. This could be attributed to human error while collecting data. In the other hypothesis, we expected that the maple-sugar would grow faster than the beech following a gap opening. this was confirmed by the graph 2 above, and we can see that a 39% increase on the maple population was achieved.
Also, we anticipated that beech would dominate the shade species and the opposite would be true for maple sugar following a gap opening. The result turned positive as portrayed in table 2 above. Finally, we predicted that the leaves of shade species would have shallow sinuses relative to those occurring in the sun species (Holmgren, Sheffer & Huston, 1997). This result was supported by t-test (p =0.48> 0.05) and as such, we retained the null hypothesis.
In a conclusion, the experiment was fair since most of the findings were confirmed statistically. Nevertheless, in future, in order to improve on the credibility of the results, data collection ought to be done with utmost keenness.
References
Givinish, T. J. (1988). Adaptation to sun and shade: a whole plant perspective. Australian Journal of Plant Physiology, 15 (1), 63-92.
Holmgren, M., Sheffer, M., & Huston, M. A. (1997). The interplay of facilitation and competition in plant communities. Journal of Ecology, 78 (3), 1966–1975.
Horn, H. S. (1971). The Adaptive Geometry of Trees. New York: New York University Press.
Huisman, J., & Weissing, F. J. (2001). Biological conditions for oscillations and chaos generated by multispecies competition. Journal of Ecology, 82 (9), 2682–2695.
Larcher, W. (1995). Physiological Plant Ecology. Berlin: Springer Verlag.
Moorcroft, P. R., & Pacala, S. W. (1998). Terrestrial model and global change: challenge for the future. Global Change Biology, 4 (4), 581–590.