Abstract
The core behind performing this experiment was partly to investigate the electric field pattern between dipoles and, to estimate the charge per unit length of a conducting wire. In order to achieve these, two subsequent setups were arranged. In the first setup the aim was to create dipoles (12cm apart) and, consequently trace equipotential lines vital in predicting of electric field patterns between the two point charges. This was achieved by a pair of probes. Vitally, the direction of the field was determined by a two-point probe. In the second setup however, oppositely-charged coaxial rings were arranged with objective being: to determine electric field (E) between rings using two approaches which were to be affirmed by average electric field (Eavg).
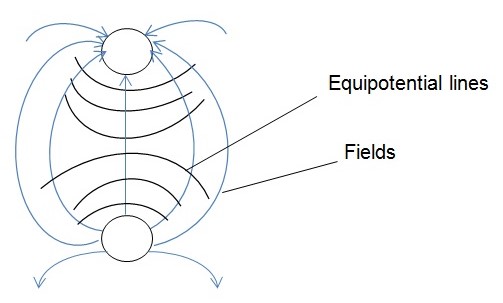
The experimental results revealed that: electric field lines point away from the positive towards the negative charge dipole. Moreover, these lines cut equipotential lines perpendicularly while at the same time emerge and enter the dipole surfaces at normal (Becker 15). As regards the second setup, it was revealed that, just like potential difference, the electric field strength is inversely proportional to the separating distance between two oppositely charged conductors. The charges per unit length (λ) from the two approaches were not consistent to each other (more than 50% difference) courtesy of experimental errors. However, this difference with respect to Eavg was immaterial (0.15%) showing consistency. The errors in the experiment can be attributed to uneven charge distributions due to non uniform mixing of water. This can be minimized in future by thoroughly mixing the water before use.
Objective
The main objective of carrying out this experiment is partly to investigate the electric field pattern between dipoles and, to estimate the charge per unit length of a conducting wire.
Procedure
In this experiment, two subsequent setups were arranged. In the first setup the aim was to create dipoles and, consequently trace equipotential lines vital in predicting of the electric field patterns between the two point charges. This was achieved courtesy of two submerged but oppositely charged pennies in a water tank, fixed 12 cm apart and, placed along the central axis between the walls of the tank. Employing the services of a pair of probe, a fixed point (zero potential) as well as six equipotential lines was determined in the half of the tank on the grid submerged in water. A duplicate of the same grid but not in water was drawn and later completed on the other half ready for analysis. Significantly, the direction as well as the magnitude of the electric field was determined prior to analysis.
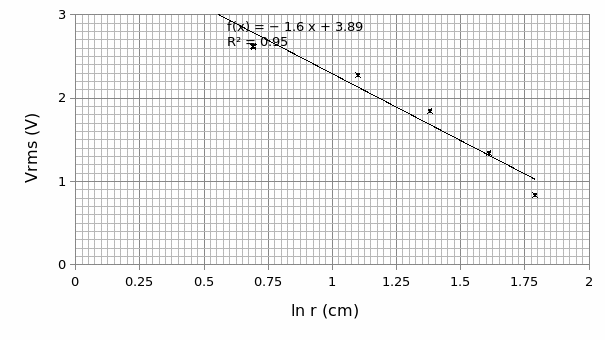
In the second setup though, the aim was to estimate the charge per unit length of a conductor. The setup was synonymous to the previous one however; the pennies were substituted by two rings of different radii which were to form oppositely-charged coaxial rings in the tank. While holding the inner ring at a zero potential, five distances between the rings and along a common axis (measured as 0° on the positive X axis) were located to determine the Vrms at respective radii (r). The same were done at, 90°, 180° and 270° measured counterclockwise. The average voltage values (Vavg) of Vrms between 0° and 90° at common radii were recorded for analysis. A graph of Vavg against ln (r) was then plotted for analysis.
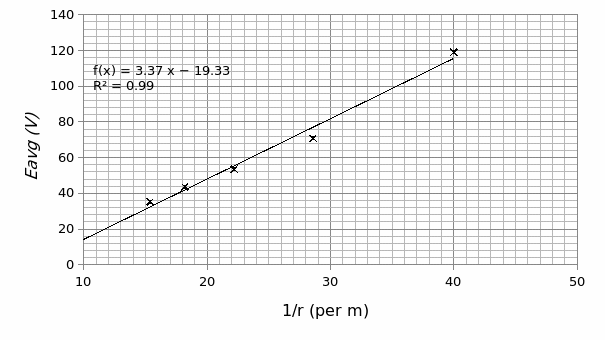
Also, using a two point probe (0.5cm apart) and, along any two axes (180° and 270°), a pair of E (electric field strength) was determined at five different radii (r) between the rings. The average E (Eavg) and their respective radii were recorded for analysis. Later, a graph of Eavg against 1/r was then plotted for analysis. Vitally, E at the outside the outermost ring was also determined for the purpose of analysis.
Experimental data

Table 1: Showing radii (r), Vrms at 0° and 90° and Vavg
Table 2: showing radii (r), E (180°), E (270°) and Eavg


Results
To obtain the average value (Vavg) as is in Table 1, you take: [Vrms (0°) + Vrms (90°)]/2. Therefore, Vavg at r (0.02m) = (2.58+2.66)/2 = 2.62 V.
To obtain E at 180° and 270° as is on Table 2, you take: Vrms (in the raw data)/ (distance between two-pin probes).
Therefore, E at 180° = 0.522/0.005= 104 V/m.
E at 270° = 0.672/0.005 = 134 V/m.
To get Eavg = [E (180°) + E (270°)]/2.
Therefore, Eavg at 0.0025 = (104+ 134)/ 2.
=119V/m.
From Graph 1, with respect to equation V(r) = -λ (ln r)/2πεoεn from Gauss’s law, the slope (m) is given by λ/2πεoεn.
Given: εo (permittivity of free space) = 8.85×10^-12, εn= 80, m (from Graph 1) = -160.4 V/m and, π= 3.142, λ can be obtained from the expression below.
-λ= -m (2πεoεn)
= -160.4 (2×3.142×8.85×10^-12×80)
= 7.14×10⁻⁷.
Alternatively, from Graph 2 the value of λ can be obtained from Gauss’s law in the expression: E= λ/2πεoεn(r).
Therefore the slope (S) = λ/2πεoεn.
Thus, λ = 2πεoεn (S)
= 2×3.142x 8.85×10^-12x80x3.367
= 1.5×10⁻⁸.
The percentage error in the two calculations= |λ|/ (λavg)*100
Δλ= 1.5×10^-8-7.14×10^-9.
= 6.99×10^-7
λavg= (λ119-λ35.3)/ Δr119,35.3
= (21.2×10^-6 -2.42×10^-6)/ (0.065-0.025)
=4.7×10^-4
Therefore, % error= (6.99×10^-7)/ (4.7×10^-4) x100
=0.15%
Discussion and analysis
Bearing in mind the objective of the experiment and, with respect to the first setup as is in figure 1 above, it can be concluded that: electric field lines point away from the positive towards the negative charge dipole. Moreover, these lines cut equipotential lines perpendicularly while at the same time emerge and enter the dipole surfaces at normal. For the second setup, the electric field lines between the two rings, as predicted from the Vrms pattern, reveal that: equipotential lines form concentric circles between the rings and, the electric field lines are radial emerging and entering the outer and the inner ring respectively but normally (Serway 12).
As regards the second setup, the plot of electric field potential (E) versus 1/r (graph 2) displays a direct proportion relation. This indicates that the electric field strength is inversely proportional to the separating distance between two oppositely charged conductors. This is to say that the strength is highly felt as you approach a positive charge. This observation concurs with the observation in graph 1 in the sense that: the potential difference (V) is inversely proportional to the separating distance and as such, determines the magnitude of E.
The charges per unit length (λ) from the two approaches were not consistent to each other courtesy of experimental errors. The difference between the two was more than 50%. However, with respect to the average field per unit length, the calculated error was immaterial (1.5%). These errors can be attributed to uneven charge distributions due to non uniform mixing of water. This can be minimized in future by thoroughly mixing the water before use.
Conclusion
In a synopsis, it can be concluded that the objective of the experiment was achieved were it not for experimental errors. This is so because it was possible to trace electric field patterns between dipoles which were consistent with theoretical observation. Moreover, it was also established that, even with different approaches of calculations as long as the meaning of Gauss’s law is not altered, the charge per unit length (λ) remains constant.
Works Cited
Becker, Joseph. Physics 51-Electricity and Magnetism. Carlifornia: San Jose State University Press, 2003. Print.
Serway, Raymond. Physics for Scientists and Engineers with Modern Physics. Denver: MacMurray, 1996. Print.