Abstract
The objective of this experiment was to investigate the relationship between the electric potential (V) and the electric field and hence, determine the electric field pattern and strength E between a pair of parallel conductors.
The experiment was such that two setups were arranged. The objective of the first setup was: to trace electric field patterns on a separate grid akin to the one embedded in a tray of water bound within two charged parallel conductors. The difference in the second one comes with an inclusion of a ring in between the conductors. For the sake of analysis, a data of RMS (V) at six regular intervals between conductors were recorded and then plotted.
From the analysis, it was established that the results concurred with the theoretical to a greater degree. It was established that the electric field lines: point away from positive to negatively charged conductor, they emerge and enter a conductor normally and, they cut equipotential lines at right angles. It was also established that a computerized plot of RMS versus distance (x) gave a linear relation with the gradient equivalent to electric field strength E (57.30V/m). Using other approaches of calculations, the results gave consistent results with discrepancies of 5% and 8% for the average E and the two-pin probe respectively. With regards to the second setup, E within the ring was minimum (0.5V/m) though theoretically, zero is an ideal result. The uncertainties could have been as a result of experimental errors courtesy of impurities within in water. This can be minimized in future experiments by the use of purified water.
Objective
The objective of carrying out this experiment is to investigate the correlation between the electric potential (V) and the electric field and hence, determine the electric field pattern and strength (E) between a pair of parallel conductors.
Procedure
In the first set-up, a pair of parallel charged conductors 12 cm apart from an AC source was placed in a water tank and, with the aid of a digital multimeter (DMM), the root mean square voltage (RMS) was traced at regular intervals on a grid placed inside the water tank to establish six equipotential lines on half of the tank. This was achieved by selecting a reference fixed location and varied locations using a pair of probe. Equipotential lines synonymous to the ones traced on the grid were traced on a separate grid for analysis. These were later to be completed on the other half owing to the symmetry of the pattern. A graph of RMS (V) against x (the distance between the reference point and the equipotential lines) plotted for analysis. The directions of the electric field lines were established by the aid a two-point probe. This was achieved by taking note of the positions of the red and black probes where the DMM records maximum reading.
The second setup and procedure was similar to the previous one with the difference being an inclusion of a ring between the conductors. The objective was to deduce the pattern traced by the inclusion of a neutral conductor.
Experimental data
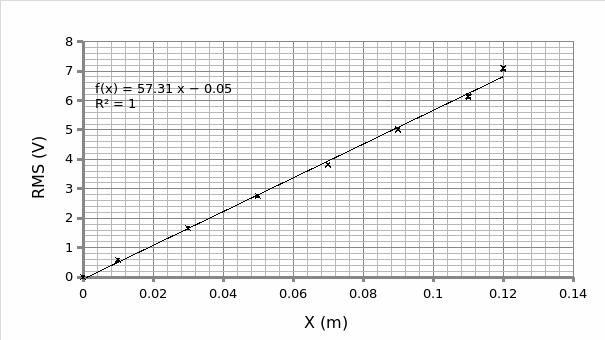
Table 1 of the position of the equipotential lines (x) and RMS (V)


Results
From the graph, the electric field strength between the two parallel conductors can be obtained from the linear fit connected by the equation y = mx + c. The gradient (m) gives the actual electric field strength (Eactual) i.e. m = 57.30V/m.
Alternatively, the average electric field strength (E) can be obtained by obtaining the quotient of potential difference between the plates and the separating distance between the plates. Thus;
E = (7.09 – 0.001)/ (0.12 – 0.00) = 59.075 V/m
Percentage error between the two values is obtained from the expression (59.075 – 57.30) / (57.30)* 100= 3.1%≈ 3%.
The electric field strength as obtained by a two-pin probe is calculated from the formula (V2-V1) / (d2-d1) where: (V2-V1) is the maximum potential difference between the probes and, (d2-d1) is the distance separating the probes. Therefore, picking the highest point on the grid (0.285V): E= 0.285/0.005 = 57 V/m. Picking the lowest point (0.238V): E= 47.6V.
Percentage error in E obtained by a two-pin probe is given by: (Emaximum– Eminimum)/ (2*Eactual)* 100 = (57-47.6) / (2* 57.3)* 100= 8.2%.
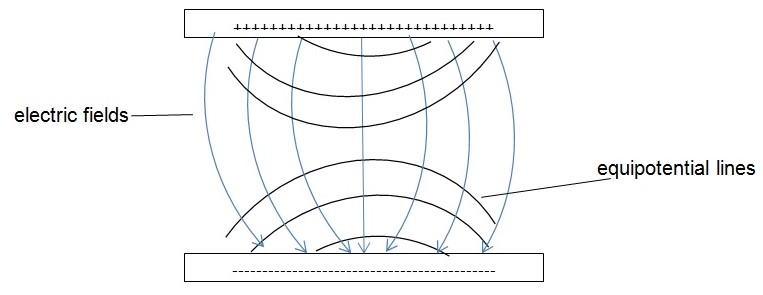
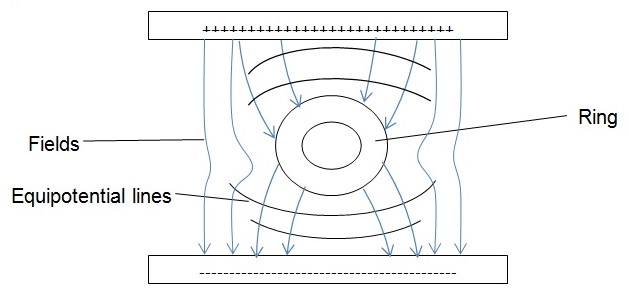
On the diagrams 1 and 2, you notice that the field lines are cutting the equipotential lines at near normal (perpendicular). Comparably, the field lines enter and emerge from the neutral conductor at near normal. Moreover, the electric field lines point away from the positive conductor towards the negative conductor.
In reference to the second set-up, the E within the ring can be obtained from the expression: (V2-V1) / (d2-d1). Thus, taking points within the ring, the average E= (3.13- 3.12) /0.02= 0.5V/m. Outside the ring, taking any two consecutive points but on different equipotential lines (e.g. 5.94V and 4.48V), you get E ≈73V/m.
Discussion
In this lab, the objective was to investigate the relationship between the electric potential (V) and the electric field and hence, determine the electric field pattern and strength E between a pair of parallel conductors. From the results obtained from the first part of the experiment, it is evident that the electric field strength (E) as obtained from the three alternative methods gave near consistent results were it not for discrepancies accrued in the course of the experiment. The actual E as obtained from the computer linearized fit gave (57.30 V/m). Calculations as obtained from the average E gave an error of 3% which is within the expected margin of error (5%). However, the two-point probe gave a big error of 8% which is beyond the expected margin. The errors could have been as a result of non-uniform charge density between the conductors owing to the immobile minerals in water. This brings one factor to the fore that determines the magnitude of E which is basically the permittivity of the medium (Becker 3). In future experiments, this error can be minimized by the use of purified water free of mineral elements.
The experimental analysis drew a correlation between the separations between charged conductors and potential difference. The two are connected by a linear equation (y=mx+c) where: the gradient (m) is proportionate to the electric field strength. From the analysis, the preciseness of E increases with the increase in the number of contact proportions between the charged conductors.
On focusing on the electric field patterns, the diagrams (1 and 2) reveal that the lines point away from the positively charged towards the negatively charged conductor. Moreover, they emerge and enter a conductor at right angles. On observing the relationship between the equipotential lines and the fields, it is evident that the two cut perpendicularly against each other. With respect to the first setup, the electric field lines, which are presumed to be uniform for parallel conductors, did not exhibit the same. This is attributed to the experimental error derived from the degree of permittivity of the medium (Becker 4). The second setup gave almost consistent results were it not for uncertainty regarding experimental setup with the focus being on the immobile impurities. This is so because within the ring E is expected to be zero but not 0.5V/m as obtained from the experiment. Expectedly, E anywhere outside the ring is predicted to be uniform (≈73V/m) and, greater than at the center.
Conclusion
The objective of performing this experiment was to investigate the electric field pattern of a pair of parallel charged conductors and, consequently determine the electric field strength of the same. Conclusively, the objective was met. This is so because it was established that: the electric field lines point away from a positive charge towards a negative charge, they emerge and enter a conductor normally and, they cut equipotential lines at right angles. Also, it was established that electric field strength within a neutral ring placed inside electric field is zero.
Work cited
Becker, Joseph. Physics 51-Electricity and Magnetism. Carlifornia: San Jose State University Press, 2003. Print.