Oman Agriculture Development Company SAOG is a member of OMZEST Group and is based in Oman. The company is located at Sohar, where it has an 800-hectare farm. The company mainly deals in the production of dairy products. Other products of the company are vegetables, juices, and beverages. It also ventures into the trading of various products, training, services, and construction. The brand names of its different products are Sohar, Sunfarms, Moo Cow, Nakhal, Nizwa, and Sun Up.

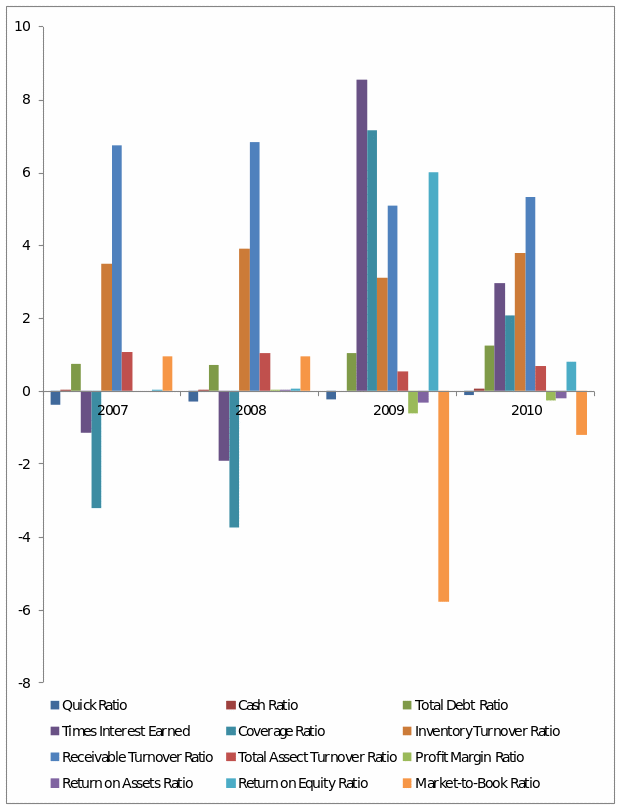
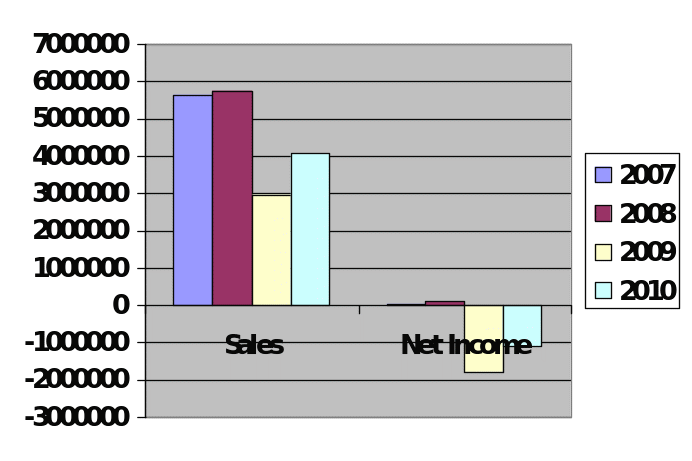
A comparative chart for the last four years can be seen in Figure 1 above. After a careful study of the figures, it is clear that in terms of profitability, the year 2008 (with a ratio of 0.02) was the best for the company and the year 2009 (with a ratio of -0.60) was the worst. In 2007 and 2010, the ratios were 0.00 and -0.27 respectively. Even the sales were highest in 2008. Return on the assets is an important factor for any company. In 2008, the ratio was 0.02, whereas, in 2009, it was -0.32. In Figure 2 we can see the ‘Sales’ and ‘Net Income graphs. Although the year 2008 has been the most beneficial for the company, yet in comparison to the year 2009, the company has managed to improve the figures in 2010. There has been an increase of 39.19% in sales and the net income has also increased. In terms of ‘Market-to-book Ratio’ also 2010 has been better. Even the ‘Profit Margin Ratio’ has risen from -0.60 to -0.27. But the year 2009 has been good for the company in terms of its ability to cover up fixed interest charges with the current earnings. The ‘Times Interest Earned’ ratio in 2009 is the highest i.e. 8.54. But in 2010, it decreased by 65.33%, to 2.96. The ‘Total Debt Ratio’ has increased from 1.05 in 2009, to 1.24in 2010. The ‘Receivable Turnover Ratio’ has also increased from 5.08 in 2009 to 5.33 in 2010 i.e. an increase of 4.92%.

So we can conclude that in comparison to the year 2009, 2010 has been a better financial year for the company.
Ratio Analysis
Ratio analysis is done to evaluate the performance of the company as compared to the previous years. It also sets the standards of performance in the future. Such analysis also helps the company management in identifying the areas where improvement is required and also the most promising areas. Investors and stockbrokers can assess the creditworthiness of the company by going through the ratios. Professor Harvey B. Lermack wrote, “The performance of a firm can be assessed by computing key ratios and analyzing: (a) How is the firm performing relative to the industry? (b) How is the firm performing relative to the leading firms in their industry? (c) How does the current year’s performance compare to the previous year(s)? (d) What are the variables driving the key ratios?…….” (Lermack, 2003).
But there are certain limitations also to such an analysis. It is difficult to decide which ratios are favorable at times and which are unfavorable. Since the ratios are based on past performance, the future projections cannot be perfect. This is because the ratios are not stable. Further, the ratios are based on the financial statements which in turn are based on the costs and not the value. As such, financial statements don’t include values such as management expertise. Comparison between the ratios of international companies is difficult because the accounting procedures and standards are different in different countries. Erich A. Helfert wrote, “….there is a wide range of choices among many individual ratios and measures, some purely financial and some economic. No one ratio or measure can be considered predominant.” (Helfert, 95)
Current ratio (Total Current Assets / Total current liabilities)
This ratio is related to the company’s ability to meet its short-term obligations. As a precaution, it should be high enough. As compared to 2006, the Current ratio in 2010 has decreased from 0.98 to 0.41. The reason for the decrease is that the increase in the total current assets in 2010 (as compared to 2006) is less, percentage-wise, than the increase in the total current liabilities (as compared to 2006), again percentage-wise. The current assets have increased only 8.16%, whereas the current liabilities have increased 158.15%. Owing to the formula, the ratio is thus decreased. From the computed ratios, we can see that this ratio has decreased with each passing year, except 2010. Now, this is a great cause of concern for the company.
Quick Ratio ([Cash and Equivalents – Inventory] / Total Current Liabilities)
The inventories have been subtracted from the cash and equivalents because they are the least liquid. In 2006, the Quick ratio was -0.535 whereas, in 2010, it is -0.12. The main reason for this change is the change in the cash and equivalents, which has increased manifolds, to be precise, 1129.20%. The dividing factor i.e. the current liabilities has increased only 158.15%. Hence the difference is observed.
Cash Ratio (Cash / Total Current Liabilities)
If the cash ratio is high, it means that the company has enough cash which is not good. Excess cash should be invested to gain returns. However, from the table, it is evident that the Cash ratio in 2010 is at an increase of 500%, from 0.01in 2006 to 0.05 in 2010. But the increase doesn’t mean that the ratio is high. It is only the comparison. The ratio is low and it means that the company must have invested its funds elsewhere. This is a good sign for the future. This increase is because the increase in the cash and equivalents is far more than the increase in the current liabilities. The percent wise increases are 1129.20% in cash and equivalents and 158.15% in current liabilities.
Total Debt Ratio ([Total Assets – Total Equity] / Total Assets)
There has been an increase of 93.75% increase in this ratio. The deciding factor for this ratio is the total equity. An astronomical decrease in the total equity is the reason for the increase in the Total Debt Ratio. The increase in the debt ratio is not a good sign because it shows that the company is going into debts year after year.
Times Interest Earned Ratio (EBIT / Interest)
The increase in this ratio, from -1.16 in 2007 to 2.96 in 2010 is because the EBIT has decreased more (percentage-wise) than the interest (percentage-wise). The ratio was highest in 2009, which shows that in 2009, the company was more capable of covering its interest charges. But a decline in the ratio is 2010 (as compared to 2009) shows that the company has become less capable as far as covering the interest charges is concerned.
EBIT/Interest Ratio ([EBIT + Depreciation] / Interest)
The EBIT/Interest ratio has increased from -3.22 in 2007 to 2.07 in 2010 i.e. an increase of 64.28%. From the table, we know that the depreciation has been almost constant (minor fluctuations). The increase in the EBIT/Interest ratio shows the company’s present ability to pay the interest from the earnings, leaving scope for paying taxes and new investments. The difference between the Times Interest Earned Ratio and the EBIT/Interest Ratio is that in EBIT/Interest Ratio, before the division, depreciation is added to the EBIT.
Inventory turnover Ratio (Cost of Sales / Inventory)
We see that there is not much of a difference in this ratio. There has been a nominal charge of 8% (from 3.50 in 2007 to 3.78 in 2010). It doesn’t mean that the figures haven’t changed. We notice that although the ratio has increased, the figures for sales and inventory in 2010 have decreased in comparison to their respective figures in 2007. But there is a point. The decrease in sales is 22.64%, whereas the decrease in the inventory is 28.42%. The sales and inventory both have decreased means that the company products are not in that much demand. The management should take some remedial actions immediately.
Inventory Days Ratio (Calendar days / Inventory Turnover Ratio)
This ratio depicts the number of days for which stocks were held. There is a decrease in this ratio from 104.36 in 2007, to 96.56 in 2010. It’s a good sign because the more days stocks are held, the cost keeps on increasing.
Receivable Turnover Ratio (Net Sales / Account Receivables)
This ratio tells us how many times of the accounts receivables the money is collected from the debtors. The ratio has decreased from 6.74 in 2007 to 5.33 in 2010. A decrease in this ratio means that the collection from the debtors has decreased. This is not a good sign because late collections mean more interest on the amount.
Days Receivables Ratio (Calendar days / Sales Receivable Ratio)
This ratio tells us in how many days the payments are collected from the debtors. The ratio has increased from 54.13 in 2007 to 68.54 in 2010. Again an increase is seen here. It means the company is not paying attention to the collection part. Giving more days to the debtors means piling up more interest.
Total Asset Turnover Ratio (Sales / Total Assets)
This ratio tells us how professionally the company is utilizing its assets. The figures denote the number of dollars being earned for each dollar of the assets. This ratio has decreased from 1.07 in 2007 to 0.69 in 2010. The decrease in this ratio shows that the company is not properly utilizing its assets.
Profit Margin Ratio (Net Income / Sales)
This ratio has decreased from zero in 2007 to -0.27 in 2010. This is a matter of great concern for the company management. It means that the company is going into losses. If the same approach goes on, the stakeholders will withdraw their money and the company will be in the doldrums.
Returns on Assets Ratio (Net Income / Total Assets)
This ratio has also decreased from zero in 2007 to -0.19 in 2010. This shows that the company assets do not help generate income. The company should think of acquiring some new profitable assets.
Return on Equity Ratio (Net Income / Total Equity)
This ratio has increased from 0.02 in 2007 to 0.79 in 2010. But in 2009, the figure was 6.01. It means that the year 2009 was best for the shareholders. For each dollar of their investment in the company, they earned 6.01 dollars. But in 2010, there was a drastic plunge.
PE Ratio (Price per share / Earnings per share)
There has been a drastic decrease in this ratio. It has dipped from 63.40 in 2007 to -1.39 in 2010. This shows that the company shares have lost ground in the share market. By this, the credibility of the company is affected.
Market to Book Ratio (Market value per share / Book value per share)
This ratio has decreased from 0.942 in 2007 to -1.223 in 2010. It means that the company has been unsuccessful in creating value for its shareholders.
Note: The code of Oman Agriculture Development Company is OADI.
References
Helfert, E. A. (2001). Financial analysis: tools and techniques: A guide for managers. New York: McGraw-Hill Professional.
Lermack, H. B. (2003). Steps to a Basic Company Financial Analysis.