Introduction
This experiment was necessary to study the reaction of food coloring with bleach. However, the principles on which the experiment was based can be applied to any other reactions. The main purpose of this test was to determine the reaction rate of two substances. The rate of a chemical reaction is the quantity of chemical that is reacted or generated for a given time interval (“Rate and Order Reactions”). The rate law demonstrates how the rate correlates with the concentrations of the components of the reaction. It is possible to note that “the power of the concentration in the rate law expression is called the order with respect to the reactant or catalyst” (“Rate and Order Reactions”). There are zero-order, first-order, and second-order reactions.
There are several aspects of chemical reaction rates that are necessary for the understanding of the results of the experiment. The first important characteristic is absorbance. It demonstrates the amount of light absorbed by a given sample. It is also called optical density, extinction, or decadic absorbance (Helmenstine). This characteristic can be measured by means of a spectrophotometer.
This device allows collecting necessary data in order to conduct quantitative analysis. A spectrophotometer calculates absorbance by measuring the quantity of light that goes through a given sample. The absorbance will be zero if all light passes through (Helmenstine). However, if the light does not pass through a sample at all, the absorbance is absolute. In order to calculate it, the Beer-Lambert law is applied.
Another important aspect is the correlation between concentration and time. However, as absorbance is directly proportional to concentration, it was used to determine this correlation. Also, the collected data allowed determining the order of the reaction with respect to a given substance. The results of the calculations and graphs helped to demonstrate that it was the first-order reaction. The hypothesis of this work is that the reaction between the given substances is a first-order reaction.
Procedure
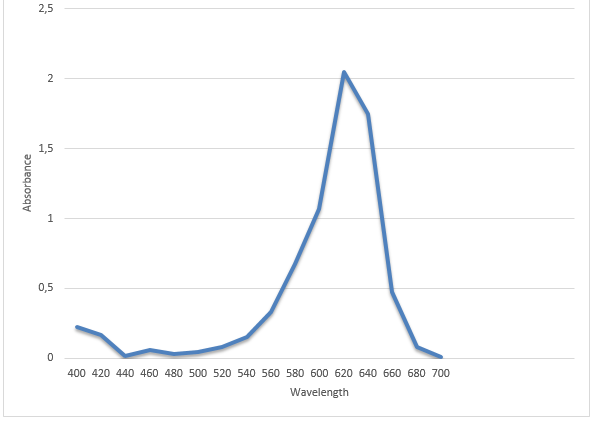
The stock solution that was prepared for this experiment contained six drops of the blue dye and distilled water. A 400ml beaker was used to mix the substances. The next step was to measure the absorbance of the stock solution. In order to do it, the stock solution was poured into the test tube. Then, it was put in the spectrophotometer. The wavelength was set from 700nm to 400nm, reducing 20nm each time. After the data was collected, the maximum wavelength at which the absorbance was the highest was determined.
The next part of the experiment was to determine the right proportion of Clorox and blue dye solution to do the rate study. 1 mL of Clorox was mixed with different amounts of the blue stock solution using a graduated cylinder. The first proportion was 1 mL of Clorox and 10 mL of the blue dye solution. After mixing two substances, the discoloration time was measured. This pattern was repeated several times with different amounts of the blue dye. This experiment was completed when the discoloration time was about fifteen minutes.
The final part was to make absorbance versus time measurements. The Spectronic 20 was blanked with water. Then, the blue dye and Clorox were mixed together and transferred into the cuvette to record the absorbance every minute.
Results
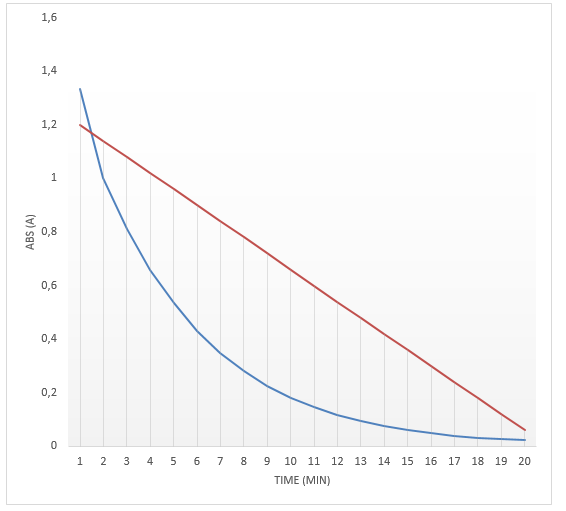
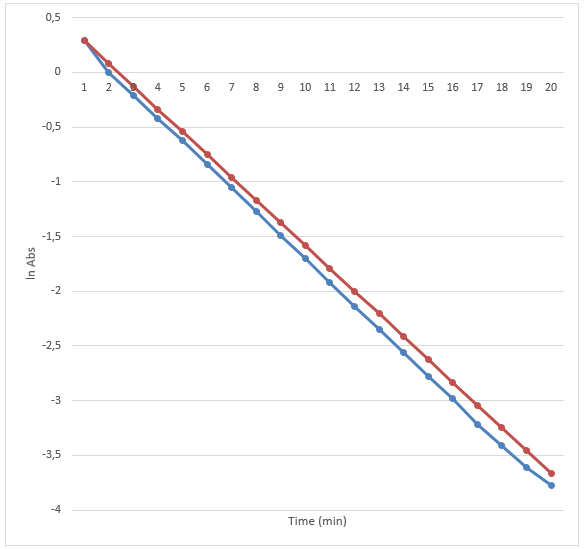
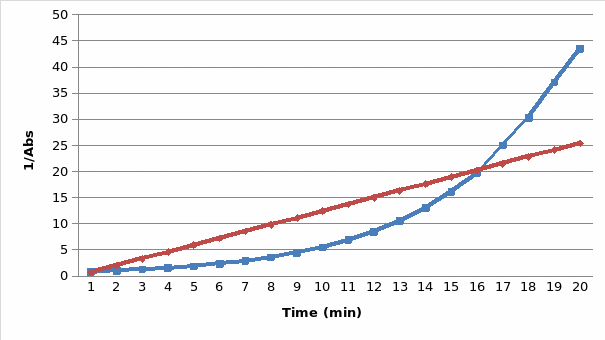
The results are presented in the two graphs attached to this report. Figure 1 demonstrates the correlation between the absorbance and wavelength. The highest absorbance was 2.05. The wavelength at the highest absorbance was 620. Figure 2 demonstrates the correlation between time and absorbance. The best proportion was 1 mL of Clorox and 30 mL of the blue dye solution, and the discoloration time was 14.26 minutes. Figure 3 demonstrates the correlation between concentration and time. Figure 4 demonstrates the correlation between time and 1 divided by concentration.


Discussion
The main goals of this experiment were to determine the maximum wavelength at which the absorbance was the highest, the best proportion of Clorox and the blue dye solution, the discoloration time, and the correlation between absorbance and time. The experiment revealed that the maximum wavelength was 620, and the discoloration time was 14.26 minutes. The best proportion was 1 mL of Clorox and 30 mL of the blue dye solution. The correlation is presented in figures 2, 3, and 4.
In order to determine the absorbance, the Beer-lambert law was applied, A= Ebc. A is the amount of light absorbed by the solution for a given wavelength; E is the molar absorptivity; b is the distance that the light travels through the solution; c is the analyte concentration (“How to Calculate Molar Absorptivity”). The spectrophotometer that was used in this experiment calculated the amount of light that was absorbed by the sample applying this law. The results were shown on the display of the spectrometer.
In order to determine the best proportion and discoloration time, the same pattern was repeated several times until the discoloration time was approximately 15 minutes. The result was 14.26 minutes. This proportion was necessary to conduct the third part of the experiment in which the correlation between absorbance and time was determined.
The final part of the experiment allowed measuring the absorbance of the obtained proportion of Clorox and the blue dye at the maximum wavelength. The results confirm the initial hypothesis. The reaction was first order as its rate was directly proportional to the concentration of one of the reactants. Therefore, if the concentration doubles, the reaction rate will double as well. It might be seen in figure 2. The absorbance was used in this experiment instead of concentration because they are directly proportional. The data presented in figure 3 also prove that the reaction is first-order because the plot resulted in a straight line. Finally, if it was a second-order reaction, figure 4 would present a straight line. However, it demonstrates a different correlation.
There were some random errors that occurred during the experiment. The first error occurred in the second part. As the measurements were made visually, they could not be accurate enough. For this reason, the measurements were repeated several times. It helped to minimize the inaccuracy in collecting data.
Another error occurred in the third part. As recording the absorbance depended on the speed of transferring the resulting substance into the cuvette, it might have also caused inaccuracy in the measurements. Therefore, it affected the results. However, such errors could not significantly change the outcomes of the experiment. That is why they can be neglected.
Conclusion
The experiment helped to determine the reaction rate of Clorox and blue food dye. Clorox is a bleach that is used to remove color or make it lighter. Food dye is a substance that is used to color food or drinks. The mix of food dye and bleach was colorless. In order to determine the absorbance for this reaction, it was necessary to measure the quantity of the light that went through the resulting solution. Other important data included discoloration time and the right proportion of the two substances. Analysis of the collected data revealed that this was a first-order reaction.
Works Cited
Helmenstine, Anne. “Absorbance Definition.” ThoughtCo. 2017. Web.
“How to Calculate Molar Absorptivity.” WikiHow. Web.
“Rate and Order Reactions.” Science. Web.