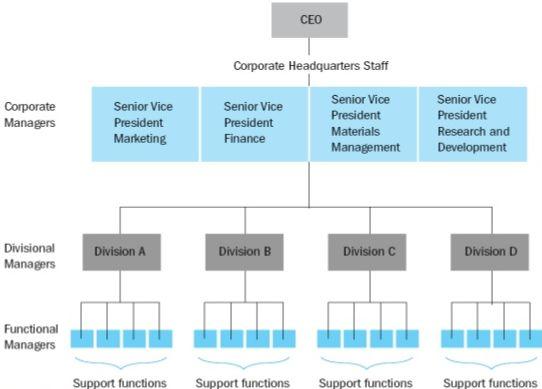
General Electric is an organization that facilitates its operations in several industries. This necessitates an organizational structure that would allow for the facilitation of a coordinated effort by several relatively independent entities (see appendix A). In the case of General Electric, each of the company’s divisions is run by a senior officer who develops strategic approaches within the range of their responsibilities (Thompson 2017).
For instance, the Energy Infrastructure division deals with energy generation and management of resources such as water, gas, and oil, as well as a range of issues associated with the domain, such as environmental concerns and the shift towards sustainable sources of energy (Street Insider 2008). Therefore, it is possible to conclude that General Electric utilizes a multidivisional organizational structure (Thompson, 2017). The distribution of responsibilities allows General Electric to address industry-specific challenges with sufficient responsiveness and focus and maximize the available resources.
The company is known for its adherence to formal rules and procedures. The recommended business policies and procedures are strictly defined in the company’s Code of Conduct (General Electric n.d.). In addition, the course of actions is outlined for the situations where the recommended procedures are considered inappropriate or conflicting with related business activities, in which case legal counsel is strongly advised.
The Code also encourages the stakeholders to issue their own policies that would be compatible with those of General Electric and specifies the necessity of compliance with the company rules regardless of the introduction of new procedures (General Electric n.d.). In other words, the company is relatively formalized. While the degree of compliance is not documented, it is reasonable to expect that the specified rules are followed in the majority of cases, considering the specificity of statements in the Code.
As was mentioned above, General Electric consists of several major divisions with distinct goals and priorities. As a result, horizontal differentiation is prominent in the company. For instance, GE managers that deal with transportation and healthcare solutions approach their tasks differently in terms of resource management, accounting, and human resource management. It is also important to mention that the size of the divisions both necessitates and encourages the creation of unique corporate cultures within each of them, a practice that is also common for horizontally differentiated organizations (Wilton 2014).
However, it should be noted that despite the significant differentiation, there is no indication that the said divisions coordinate their decisions. While each department utilizes a strict set of rules and strategies, there is no evident connection between them aside from the basic coordination of manufacturing procedures. In other words, the company does not demonstrate sufficient vertical integration in its operations (GE Sustainability n.d.). While such an approach weakens the control over the process, it also allows individual departments to pursue their own agendas, increasing the organization’s overall flexibility.
General Electric’s decision-making procedure is undergoing a transformation intended to minimize centralization. The decision to pursue a decentralized model was introduced as a part of the plan to create several units within the company instead of a centralized bureaucratic mechanism existing at the time (Lambsdorff & Beckstrom n.d.). Currently, the said units interact with internal and external parties in a manner characteristic for independent organizations, which can be defined as decentralized decision-making. It has been estimated that the said approach has facilitated a massive increase in organizational performance and growth of the company’s market value in the decades following the change.
The shift towards a decentralized decision-making model has created a need for the adoption of an organic approach to bureaucratic structure. First, the diversity of goals decrease the possibility of reliance on standardization and requires the involvement of the concept of mutual adjustment n order to achieve a desired level of coordination. By extension, communication in such a setting occurs primarily through virtual methods rather than in a traditional face-to-face manner, mitigating the time constraints.
The resulting entity does not resemble a traditional bureaucratic structure and has been defined as a boundaryless organization. In this mode, General Electric is able to focus on adaptive behavior and avoid unnecessary rigidity.
The company has a compliance program that emphasizes a commitment to upholding ethical values. The program is based on a three-step framework that aids the prevention of ethical issues, timely detection of problems as early as possible, and facilitates a relevant response. The ethical principles are formulated in The Spirit and The Letter, a formalized document that specifies the company’s stance, outlines the procedure and identifies its reporting mechanism as a part of an open reporting environment (GE Sustainability n.d.).
One of the standards used by the company to cover ethical issues is the ongoing adjustment of the program intended to decrease complexity without compromising its integrity. Next, predictive analytics is used to detect non-compliance with the standards. Finally, once the issue is detected, a response is developed in the form of horizontal risk-mitigating intervention. The responses are unified whenever possible, which was shown to result in better outcomes (GE Sustainability n.d.).
The consistency and responsibility demonstrated by General Electric have resulted in a number of awards, including the tile of one of the most ethical companies in the world. Considering the overall success of a program, it is possible to suggest technical development of the detection phase as the most viable way of strengthening its ethical positioning.
Appendix A

Reference List
GE Sustainability n.d., Integrity & compliance. Web.
General Electric n.d., General Electric Company code of conduct. Web.
Lambsdorff, M & Beckstrom, R n.d., Why trust plays a central role in decentralized organizations. Web.
Street Insider 2008, General Electric (GE) simplifies organizational structure into four segments. Web.
Thompson, A 2017, General Electric’s (GE) organizational structure for diversification (analysis). Web.
Wilton, P 2014, What are vertical and horizontal market differentiation?. Web.