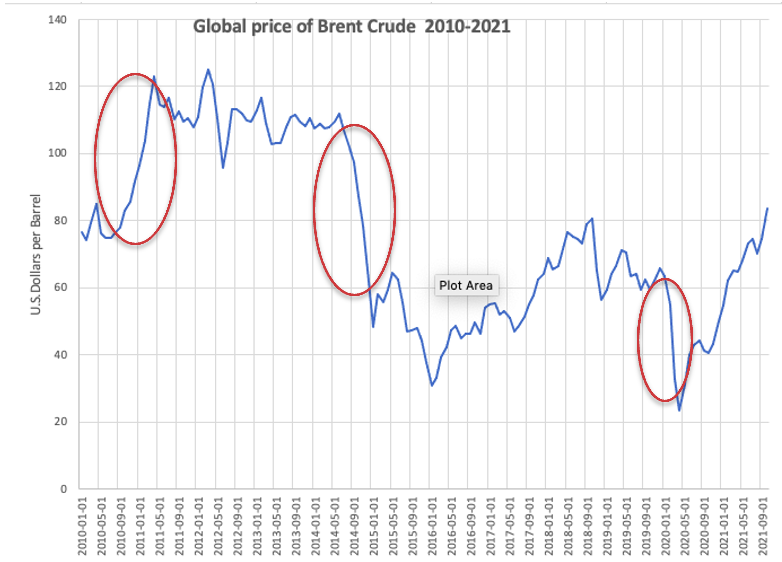
The number of factors that influence oil prices is always large. And now, there are so many of them that an ordinary investor does not understand at all which news to follow and which to ignore. Is it worth worrying about changes in US crude oil inventories, or should one primarily monitor the decline in supplies from Iran? Sometimes it is not easy to answer such questions – much depends on the specific market moment. For the purpose of this assignment: the historical change in the price per barrel of Brent was selected from 2010 to 2021. It is assumed that this time is the most interesting for understanding the influence of modern political and economic trends on price fluctuations.

Based on the resulting graph, you can see several critical fluctuations. First, the price per barrel of Brent rose rapidly throughout 2010. In March-December 2010, oil prices stabilized after the global crisis at $ 70-80 per barrel; growth resumed at the very end of 2010. The subsequent fluctuation was in 2014 and represented a sharp collapse in the price of Brent – the oil brand lost 51% in value from January to December. It is also important to note the drop in price registered from January to May 2020.
The fluctuation that happened in 2014 seems to be interesting to investigate in detail due to its amplitude and causes. Analysts attribute the decline in prices to an oversupply of oil on the world market due to several factors. Thus, the United States and Canada have increased their production, which was facilitated by the emergence of hydraulic fracturing technology, making it possible to reach deposits in shale formations that were previously inaccessible for drilling (Prest, 2018). The volume of production in the United States has surpassed nine million barrels per day. This is the highest rate in more than 30 years (Prest, 2018). At the same time, there has been a slowdown in economic growth in China, which has the highest energy consumption in the world. The Japanese economy has fallen into depression, and the eurozone is on its doorstep (Prest, 2018). In the United States, the emergence of cheaper oil has led to a decrease in gasoline prices to their lowest level in several years, which in turn contributed to the acceleration of growth of the largest economy in the world.
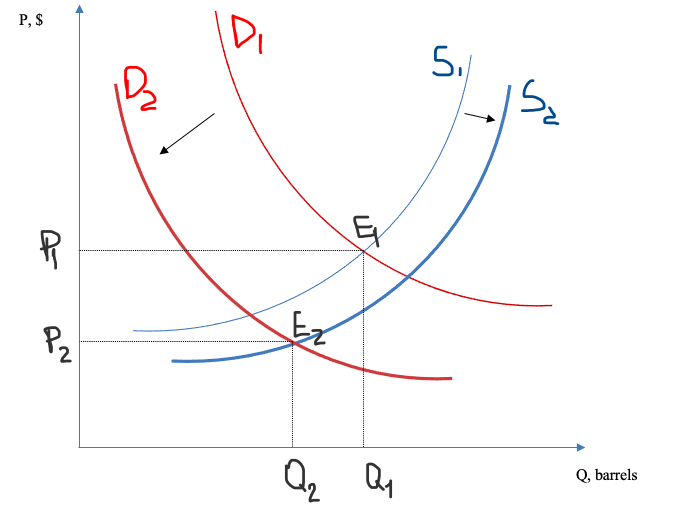
As can be seen from the example of 2014, the jumps and falls in Brent oil prices are accompanied by a complex of reasons. In this case, it is both the supply side with increasing production in the United States and the demand side, which in turn weakened significantly due to the economic contraction of significant economic and geopolitical players, China and Japan. In addition, it can be assumed that OPEC’s decision not to cut production added fuel to the fire for a reason (Prest, 2018). It is impossible to exclude geopolitical reasons and the desire to undermine the growth of the American economy, which could occur against the backdrop of the sale of large quantities of oil. The latter argument can, of course, be disputed and cannot be objectively assessed. In any case, in 2014, the collapse in prices for Brent played several factors that worked together.
Here is how the fall of Brent prices happened in 2014 can be illustrated on a supply and demand graph. The chart focuses on the impact of increased supply amid US shale oil production and OPEC’s unwillingness to cut production and the effect of weakening demand due to the weakening Chinese economy.

References
International Monetary Fund. (2021). Global price of Brent Crude. FRED Economic Data. Web.
Prest, B. C. (2018). Explanations for the 2014 oil price decline: Supply or demand?Energy Economics, 74, 63–75. Web.