Abstract
As we enter into 21st century, the availability of traditional energy sources like fossil fuels is elongated to the maximum supply factor and inter-associated subjects of ever escalating demand and limited supply have resulted in exerting pressure for increased voice over “ energy security “ as both consumers and producers fight back to control costs , geopolitics , environment and prices.
These issues associated with advancement in technology have pushed an historic escalation in LNG projects globally with Qatar turning to be the market head in LNG liquefaction capabilities. This research study will offer an insight into the growing and evolving part that LNG will play in catering the globe’s energy demands in the near future.
In the literature review section of this research study, the historical background of usage of LNG predominantly as a regional fuel in the regions of Asia-pacific, the European region and North American / Atlantic Basin will be provided. Further, it will also discuss about the increasing demand for LNG globally and how the increase in demand for LNG will affect LNG markets globally will be discussed in detail.
A detailed debate will be made about the ever growing globalization of the LNG markets worldwide and whether LNG could be traded as international merchandise in the future.
Further, there will be some symposium about the both long-term and short-term LNG contracts and will also address about the safety and environmental concerns relating to LNG and will deliberate about how the environmental antagonism to LNG might influence the long run development of the global market for LNG with particular attention to USA where many ongoing LNG import terminals have been obstructed by environmental activists.
Finally, this research study will conclude with findings that how LNG is progressing into an international, market-driven product that is connecting the international gas markets. (Sakmar 2009:1).
Introduction
In 21st century, energy has become one of the vital international political issues. The globe is witnessing multiple energy confronts, soaring energy prices, climate change, global resource competition and energy poverty. Further, the emergence of new vibrant economies like Brazil, Russia, India and China (BRICs) have hastened and worsened the present energy trends.
India and China are emerging as new demand centres in the global energy system, whereas Brazil and Russia have become as significant energy exporters. The global economy is still reliant on varied energy resources namely natural gas, coal, oil, which is known as fossil fuels.
This is quite distressing as these resources are depletable, notably costlier, geographically saturated and very polluting thereby resulting in global warming. The existing substitutes for fossil fuels like biomass energy, nuclear energy, and hydro-power are highly contentious due to their negative risks or side-effects.
Further, global energy demand is set to increase many fold in the ensuing decades, especially in the developing and emerging world. It is estimated that global energy demand is likely to exceed by over fifty percent by 2030 and up to eighty percent of this increased demand will be catered by fossil fuels. (IEA 2007b). (Lesage, Graaf & Westphal 2010:2).
Energy experts are of the view that in the 21st century, traditional energy sources are shrinking slowly and intertwined issues of a steady increase in demand and constricted supply have compelled to new demand for “energy security” as both consumers and producers resist to manage costs, price, geopolitics and the environmental impacts.
These issues, matched with technological upgradation have kindled a historic surge in LNG projects around the globe with Qatar surfacing as the global leader in LNG liquefaction capacity.
The consumption of major portion of LNG is happening at the same province or region where it is extracted due to unfeasibility and cost of transporting natural gas, especially through pipelines over long distances. LNG is cooled at about -161° C at which point it compresses into a liquid form. LNG engrosses about 1/600th of the volume of natural gas thereby making more choices for storage and shipment.
Poignantly, LNG offers a sea-borne answer to the unfeasibility of functioning in far-off natural gas markets through the pipeline or for makes use of otherwise “grounded” gas stockpiles. Liquefaction also helps the storage of natural gas for usage during peak demand phases in the regions where underground storeroom facilities are not available and plays a significant role in markets where “peakshaving” happens.
Under “peakshaving “ process , utility companies will liquefy natural gas when it is available in excess in the market at off-peak prices, and then it will convert back to the gaseous form when there are peak demand periods. (Sakmar 2009:2).
LNG production on the global level had increased from 2.1% to 2,819.4 Bcm (99.5 Tcf) in the year 2005. Of late, there has been a considerable increase in gas production thanks to the advent of cutthroat competition that exists in customary power and gas markets coupled the lower prices.
The advancement of technology has introduced combined –cycle gas turbine (CCGT) technology, which has facilitated the enhancement of the economics of generating power from gas. CCGT technology has many advantages like with markedly higher operating efficiencies and lower capital costs, which have offered natural gas as a viable alternative over the coal which have higher emission features. (Tusiani & Shearer 2007:2).
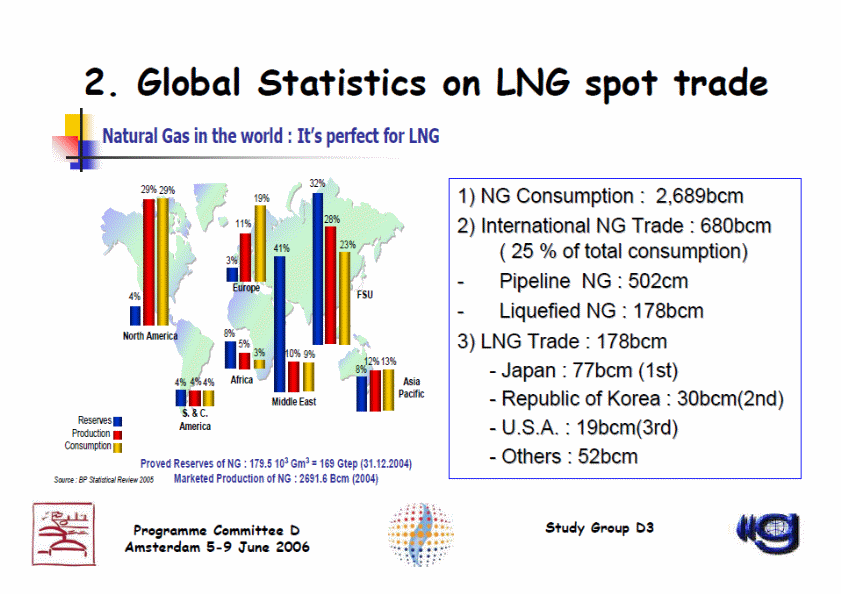
This has resulted in the increase of the demand for LNG around the globe, and natural gas exports rose to 680 Bcm (24 Tcf) which represented about 9% in 2004, which symbolised about one-fourth of total global consumption. However, as on date, about 74% of these exports are being made through pipeline deliveries.
Out of aggregate of global natural gas consumption, LNG shares of about 6.6%. (Tusiani & Shearer 2007:2). The global fleet of LNG ships was estimated about 21,000 million deadweight tons symbolising an eight percent increase in just 3 years as of 2007 and this was about 2.4% of the aggregate of the global fleet.
This will probably kindle the growth for LNG in the North American market. In the coming two decades, it is estimated that global demand for this energy source will grow by 2.75%. Further, during the past decade, the transport and production costs have been slashed by fifty percent and the cost of re-gasification and sea transport declined by a quarter and by a third respectively.
Major producers of LNG on an international level are Russia, Qatar, US, UK, Canada, Indonesia and Algeria. Smaller producing nations are Latin America, Middle East and Asia as these nations are obtaining natural gas as a result of their oil production.(Branch 2007:65).
By 2030, Venezuela is predicted to emerge as a significant LNG supplier to Europe and North America. By 2030, Middle East, Central Asia, Russia and Australia are anticipated to become new exporters to China.
LNG supply from Russia is anticipated to grow less rapidly despite the fact of its vast resources since lion’s lion’s lion’s share of Russia’s gas reserves is technically arduous to extract and supply to market. According to IEA WEO 2006, Russia is also anticipated to start the export of gas to Asia well before 2030. (Alfdala, Reklaitis and EI-Halwagi 2010:34).
LNG imports by Taiwan have increased by 90% in January 2010 as compared to January 2009. According to Bureau of Energy Statistics, Taiwan imported about 691,000 tonnes of LNG during 2010 as compared to 469,000 tonnes of LNG imported during 2009.
It is to be observed that Taiwan is importing LNG from Malaysia, Indonesia and Qatar and two spot cargoes from Trinidad and Nigeria. (Lngunlimited, 5 March 2010:1).
About sixty four million American families use natural gas as fuel for their homes. If LNG supply is disrupted, it may affect the livelihood of millions of Americans. If more LNG imports are perused by USA, then it will have less pressure on the prices to be paid gas consumers in America. It will also minimise the impact and less pressure on energy prices on American consumers and industry. (www.lngfacts.com).
It will critically offer an overview of the growing role of LNG in meeting the global energy demands in future and will investigate into whether LNG is the future energy of the world and critically conclude with findings that LNG is evolving into an international market driven commodity in future.
.Due to strict adherence of codes, standards and guidelines applying to LNG, LNG industry is being considered as one of the safest fuel in meeting the global demand in the near future. The flexibility offered by LNG demonstrates its ever increasing function in international energy trade.
There are presently 32 liquefaction plants in operation and about 51 LNG reception terminals in the world. Further, there has been plan for in the pipeline for more than 70 LNG terminals and about 30 planned liquefaction expansions and plants all over the world.
According to experts from the BG group, global LNG production is set to increase from ” 175m tonnes per annum in 2008 to 275 m by 2011.” However, demand may surpass the supply between the years 2011 to 2015. EIA (Energy Information Agency) has predicted that U.S LNG imports would soar to 4.5 trillion cubic feet in 2030 from just 0.6 trillion cubic feet in 2005.
LNG globalisation can be symbolised from the orders for methane tankers which are soaring, and it is predicted that aggregate fleet of tanker is likely to increase by fifty-six percent in the next five years and is anticipated to soar by 7.5% per annum until 2015.
Thus, this research essay will critically examine in depth about the growing and evolving part that LNG will play in catering for the globe’s energy needs in the near future.
Literature Review
Issues Involving the Globalization of LNG
The recent global economic recession which affected badly both Europe and U.S.A has begun to make a brunt on global LNG demand.
Though, there has been less appetite for LNG in Asia due to global economic recession, China and India showed substantial interest in sourcing excess LNG available in the market.Due to this, flexible LNG is possible to turn out to be a really global commodity, searching for markets where it can seize the best netback value. (Goldthau & Witte 2010:229).
Over the next few years, flexible LNG in abundant volumes will come into manufacturing and LNG will retort mainly to price signs, although customer relations and politics will also play a role in its ultimate destination. In U.S.A, the import of LNG has come down substantially due to development of shale gas.
As of date, among the three regional markets, U.S gas prices are now the lowest. Though, there is availability of shale gas in U.S.A, its cost will be too high. Thus, in the long run, both LNG and shale gas will be the main source of energy for U.S.A. (Goldthau & Witte 2010:232).
Price of LNG is influenced by U.S gas market and is normally priced against the Henry Hub index, with due regard to location differentials.
However, due to fast evolution of LNG spot market and the enhanced accessibility of shipping which not committal to long-run contracts has ended in an ever escalating globalisation of spot LNG prices again driven on the margin by U.S. market prices. Further, it is to be observed that majority of the globe’s long-run supply of LNG remains protected from competitive market elements.
Due to involvement of technical intricacies of the LNG business and its requirements of massive scale investments up front, the gas manufacturers, frequently involve the national oil companies which seem to be engrossed in the manufacture and liquefaction phases and assume control of the LNG shipping, offering on a CIF basis or ex-ship basis.
This arrangement originated from the gas producers’ intention to have control over the LNG project’s flourishing and to safeguard their upstream interests. Moreover, LNG buyers are gaining rights in LNG terminals in the aggressive markets thereby to have more control over the ultimate of sale of the gas. (Michael, Tusiani & Shearer 2007:76).
Since January 2006, as per EIA historic data, oil prices have stayed above $ 55 per barrel, and this has resulted in the enhanced demand for LNG. Further, the demand for LNG appears destined to increase inevitably as major consuming nations like U.K, U.S.A and Canada which actually witness irreversible slowdowns in their gas production.
Some critics have argued whether there is adequate gas reserves inconsonance with global demand. It is to be noted that at current level gas productions, there are adequate gas resources to last for at least seven decades from now where as it is estimated that current oil reserves will last for only 42 years from now.
For instance, despite North America holds not less than 5% of global gas stocks, it symbolises for about twenty-eight percent of global utilisation, whereas Middle East contains about 36% of global gas stocks but only consumes about just 10%. (Michael, Tusiani & Shearer 2007:27).
China has issued a white paper titled “The problem of Energy Security During the Period of High Oil Prices “ which discusses about the international competition for energy resources, which has escalated in 2007 and regional vie and competition has aggravated and obscured the international security issues.
China’s white paper also looks at energy security as part and parcel of globalisation drifts and thus viewed it as an international issue. (Amineh & Yang 2010:46).
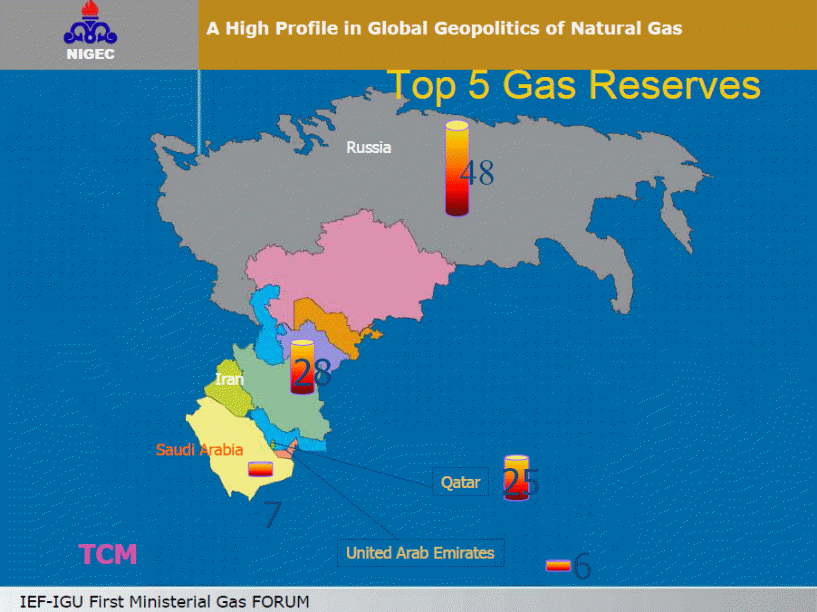
Verified global gas reserves are marginally concentrated than oil reserves. The Middle East region and the Russia hold about 2/5 and 1/5 respectively of established global gas reserves respectively.
If the ongoing LNG projects are accomplished in time, the capacity of liquefaction and carrying of LNG would reach a volume of 214 million tons per annum. LNG offers a substitute to long- outdistance transport through pipelines and conveys more opportunities to supply since LNG cargoes can emanate from varied sources. The flexibility offered by LNG demonstrates its ever increasing function in international energy trade.
LNG globalisation can be symbolised from the orders for methane tankers which are soaring, and it is predicted that aggregate fleet of tanker is likely to increase by fifty-six percent in the next five years and is anticipated to soar by 7.5% per annum until 2015. Both the size of the gas tankers is growing and at the same time, they can cover more distances by travelling more than 7000 miles without any refuelling.
In the near future, LNG market is likely to be governed by national oil companies like PETRONAS (Malaysia), Pertamina (Indonesia), Sonatrach (Algeria) and Qatar Petroleum.
Globalisation of LNG market is on the cards. With the abnormal increase in LNG projects, there exists a vibrant competition between nations owning gas reserves that can be supplied as LNG. In order to compete with offers from Qatar, Australia has reduced its prices for its deliveries to China.
Sourcing gas from Qatar is considered to be of high cost to the Asian market as compared to supply of gas from Indonesia or Australia to these provinces. Further, if gulf nations want to penetrate into European market, they are likely to witness the competition from Trinidad and Nigeria. China is anticipated to import large quantum of LNG as its total gas consumption is expected to soar to about 66 billion m3 in 2010. (Geman 2009).
The Three Separate Natural Gas Provinces
The market for LNG has been traditionally located into the following three separate provinces.
Europe
In 1964, the globe’s initial market for LNG was actually created in Europe when the first consignment of LNG was sent to UK from Algeria. Shortly after that LNG deliveries were made to Italy, Spain and France. Between 1990 and early 2000, other European nations like Portugal, Italy, France started to import LNG.
Immediately, after the discovery of LNG in the North Sea of UK, import of LNG was ceased by UK and however due to recent fall in the reserves of gas, which compelled the UK to restore the LNG imports. Thus, in 2006, European Union alone accounted for import of 42.7 million tons of LNG. (CERA2008).
About twenty –six percentage of the major consumption of energy of the member nations of EU is sourced from LNG thereby making it a very momentous energy for not only at present but also for upcoming periods. If new sources of LNG supplies are not identified, or if LNG is used as an alternative fuel for other energy sources, then there may be a gap in the supply of LNG in Europe in the near future.
It is estimated that between 2010 and 2020, Europe will require to identify further natural gas supplies of about 120 to 150 Ccm from various distant sources, if demand as estimated by IEA and EIA is to be catered with.
Europe, as of 2009, has received about forty-seven percent of its natural gas supplies from various far-off sources, which may also have a direct effect on its future fuel policies to make sure that there are enough energy supplies. If no further sources of LNG are to be identified, Europe could witness a disparity in supply of LNG as demand is expected to go up from 2011 onwards.
The IEA interim gas report of 2010 also depicts that there has been growing demand for LNG in Europe. (Likvern2010).
Of late, LNG shipments to Europe are at the peak levels as this region organizes itself to cater for the pinnacle demand in the chilly winter months.
Britain, Spain, Belgium and other import terminals in these regions are functioning at the full facility to absorb shipments lured by European prices that stay greater than those quoted in the USA market but less than the prices offered in Asian markets.
In the year 2009, all the European LNG terminals were operating at their full capacity level, and this demonstrates that there is ever increasing demand for LNG in the European markets.
Further, the squeeze on import capacity also acts as a restraint as some spot LNG cargoes are not able to find a place to be delivered in Europe.
Atlantic Basin / North American Region
There have been strong pipeline connections between Canada, USA and Mexico and exports to these nations are normally regarded as part of a structured supply mix. With a wide-ranging pipeline system in the process and with availability of large gas reserves, Atlantic/ North American region has traditionally been capable to supply the whole of its natural gas needs from indigenous sources.
However, there have been some constraints in supply in USA during 1970s and USA had to rely on imports from Algeria. 1980 and 1990s have witnessed the elimination of price controls for natural gas in USA, and different regulatory initiatives made LNG non-competitive and due to this many LNG import terminals were established in USA during this period.
Though, this region has witnessed a lesser quantum of LNG imports, it is estimated to be the chief resource of demand growth for LNG over the following years. According to Cambridge Energy Research Associates (CERA), in the year 2006 alone, Atlantic / North American Basin Region imported about 13.7 million tons of LNG.
It is to be observed that the international LNG market of the future will make LNG fungible merchandise globally. Developing new sources of LNG needs vast capital outlay for liquefaction tankers, trains and regassification terminals.
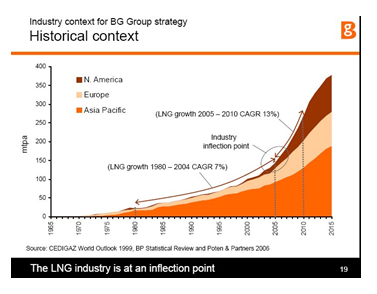
Hence, transportation of LNG has been primarily limited by the non-availability of adequate pipelines apart from flourishing LNG trade in Eastern Asia. Thus, LNG is presently at an infection point. (Cohen 2006).
From the above graph, one can understand that the international LNG trade is estimated to grow about one-hundred fifty percent by the year 2015 with huge share of additional exports emanating from USA. (Cohen 2006).
If adequate new sources of LNG supply are not identified or if LNG is being used as an alternative for other energy sources, then Europe may witness a shortfall in supply of LNG in the near future.
- It is estimated that as of now and 2020 , additional LNG supplies of about 120 to 150 Gcm have to be developed from long distant resources to meet the demand projection made by IEA and EIA.
- About forty-seven percent of LNG needs are received by Europe from far-away resources throughout 2009 and this is forecasted to surge to more than seventy percent all through 2020.
- Europe’s LNG outlook is to make sure that assurance of supplies of energy will be more dependent on the escalating reliance on LNG from more far-away supplies.
- Europe may witness a disparity in LNG demand and supply commencing as early as 2011 or 2012. (Likvern 2010).
According to Cambridge Energy Research Associates (CERA), this province has traditionally been the largest market for LNG. In this province, the globe’s largest LNG importer is Japan trailed by Taiwan and South Korea.
In recent times, China has been importing LNG in large quantum to cater for its indigenous demands followed by India. Thus, as the growing economies, both China and India are expected to import in large quantities in the near future. According to CERA, this region has accounted for import of about 102 million tons of LNG.
Pacific / Asia Region
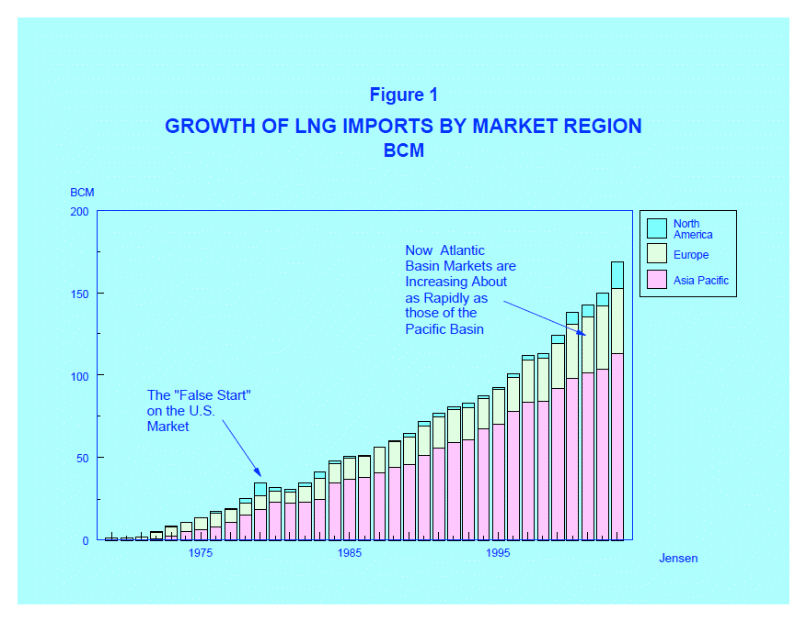
Three nations in the Pacific Basin namely Taiwan, Japan and South Korea – vouched for sixty-eight percent of international LNG imports in 2002. Seven European nations vouched for about twenty –eight percent of global LNG imports and USA accounted for the balance four percent.
It is to be observed that Japan is the globe’s largest LNG consumer as it imported in 2002 about 54.7 million tons of LNG. Nonetheless, Japan’s international LNG trade declined to just 48 percent in 2002 from that of 66 percent in 1990s. (Cohen 2006).
Major LNG Suppliers around the World- Will the LNG is the alternative fuel of the future?
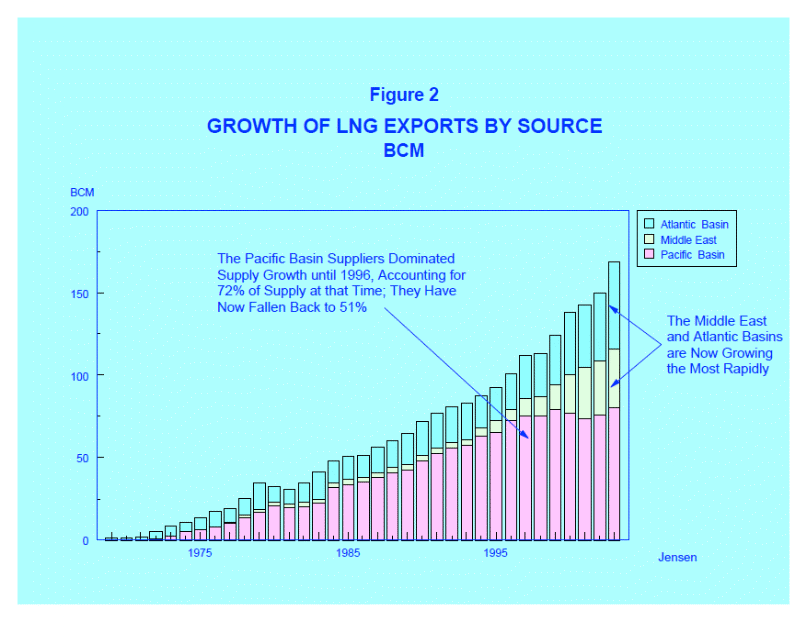
Qatar is in the process of making the Gulf into the globe’s largest centre for LNG market. Libya and Algeria are considering the natural gas production as their long –term economic interests. Oman LNG production capacity is estimated around 10 mt/y and its Qalhat LNG is said to have made sale arrangements with “National Offshore Oil Corporation of China”.
Algeria’s production capacity is around 17.6mt /y. Algerian government has set a mark of enhancing its natural gas production to 28.7 mt/y by the year 2012. Egypt’s major LNG manufacturers are namely Egyptian LNG (ELNG) and Spanish Egyptian Gas Company (Segas).
The global economic recession may act as a barrier for the growth plans of LNG industry as the economic slump is liable to end in a reduced aggregate of energy consumption and hence its brunt on the global LNG trade stays ambiguous.
Due to worldwide economic downturn, the prices of LNG in the globe’s two supreme market viz South Korea and Japan have fallen down severely over the second half of 2009 from $ 20 per million Btu (British Thermal Units) in August 2009 to $ 9.15 /m Btu by December 2009”. (Ford 2009:51).
Analogues’ decline was also witnessed in the fast developing economies like India and China but is likely to be recouped in the long run. According to experts from BG group, universal LNG production is set to increase from about”175m tonnes per annum in 2008 to 275 m by 2011.” However, demand may surpass the supply between the years 2011 to 2015. (Ford 2009:51).
In the last five years, global demand for LNG except North American market increased by 3% and the analogues demand growth is estimated for the succeeding five years with increasing demand anticipated from growing economies like India, China and Middle East, which are using gas as a substitute for the coal and oil and using the LNG for manufacturing power. (Alfadala, Reklaitis and El-Halwagi 2009:37).
Venezuela is expected to turn out to be an important LNG supplier to Europe and the North America in the coming years. During the projection period, China is expected to import LNG from Central Asia, Russia, the Middle East and Australia.
Though Russia is having enormous LNG reserves, Russian supply is anticipated to grow less rapidly since much of the Russian gas is theoretically intricate to extract and has to cross many obstacles for transporting to market. However, Russia is also seen as another probable major supplier to Asian market before 2030.
Recently, Russia’s Gazprom announced its maiden entry into the North American markets. Further, by 2014, Gazprom is planning to supply LNG to Rabaska terminal, which is being constructed in Levis, Quebec.
According to experts, US LNG market is not a “demand-pull” market but is only a “supply-push” one. In this category of market, other parts when they need LNG will source heavily since they do not have a significant storage facility as US will attract LNG supplies when there is low demand.
Thus, according to Credit Suisse LNG report, U.S is able to attract LNG supplies, especially during the low demand time period and will absorb the world’s excess when there is no place to store it. While future shipments to the USA will basically rest on the relative price and demand around the world, the fundamental need for LNG in the US remains strong (Alfadala, Reklaitis and El-Halwagi 2009:35).
Escalating international trade of LNG spot contracts thereby replacing long-term contracts: Long term Contract v Spot Market
A spot contract may be defined as a LNG supply contract where tenure is less than one year. The part played by spot contract in LNG is going to be more and more significant than what LNG market has anticipated.
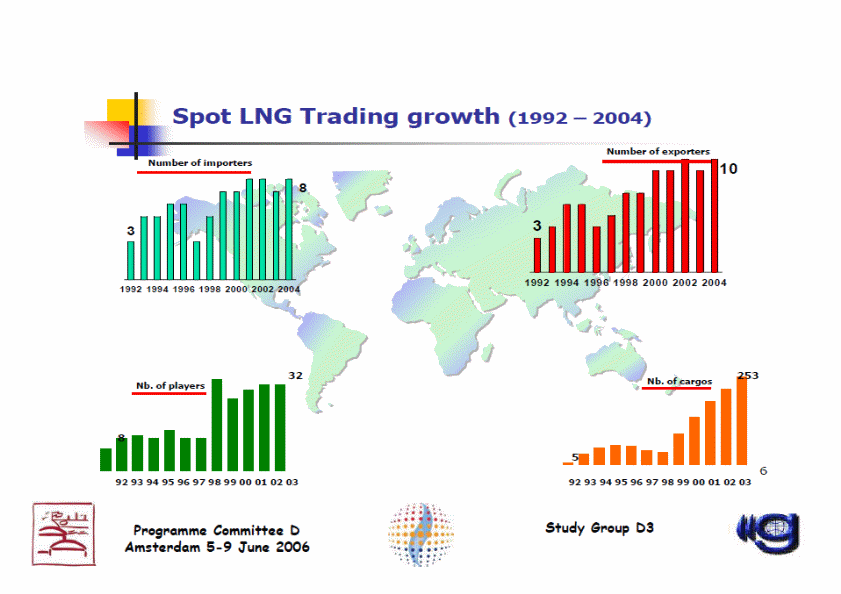
Long term contract running to 20 years has always been predominated and there has been low liquidity in LNG global market. The spot market for LNG is very small and there have little precedents where LNG consignment meant for USA rerouted to Spain under spot market. (Cohen 2006). Nonetheless, LNG global market has witnessed a great swing both in pricing and contracts.
There are demands from new markets like China and India (Dahej Regassification Terminal) and new exporters like Idku liquefaction plant in Egypt through flexible than earlier contracts but predominantly dealing in long-term deals, and as well as there are some short run contracts spanning to 1 year which are very few in numbers in global level.
As per BG Group’s survey, in 2005 alone, about 12% of LNG supply contracts consisted of spot and short term contracts while 88% of LNG supply contracts were long term contracts. (Cohen 2006). It is to be noted that large chunk of new players is anticipated to emerge into the LNG market, particularly from the MENA (Middle East & North Africa) markets, which are depicted in the following picture:
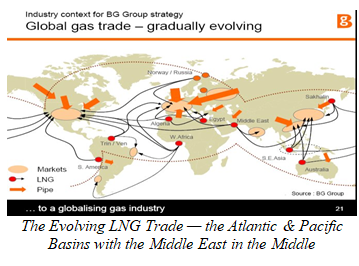
Basins with the Middle East in the Middle
Moreover, LNG from MENA will be marketed under long-run equity setup or contracts in both Pacific & Atlantic markets. Further, spot markets from MENA will remain small and as in the case of crude oil, LNG trade will never be fungible. (Cohen 2006).
As of today, LNG is being predominantly sold in the global market on long-term contracts for about 6 to 8 USD / MMBtu. Crude oil is being traded around $15 / MMBtu. Thus, LNG price is as cheap as compared to price of the crude oil as it is available at half of the cost of oil-based fuel.
LNG is sold in small volumes to ferries in Norway at about $18 / MMBtu. Thus, the whole probable savings for shippers are being eaten by small-scale liquefaction and costly transportation by trucks.
So as to minimise the price of the LNG, the gas must be transported from full-blown liquefaction units and efficient transportation to the LNG terminals must be assured by small –sized LNG feeders. LNG feeders are being presently in operation, and the first feeder vessel started its operation in 2004. (Dnv.com 2010).

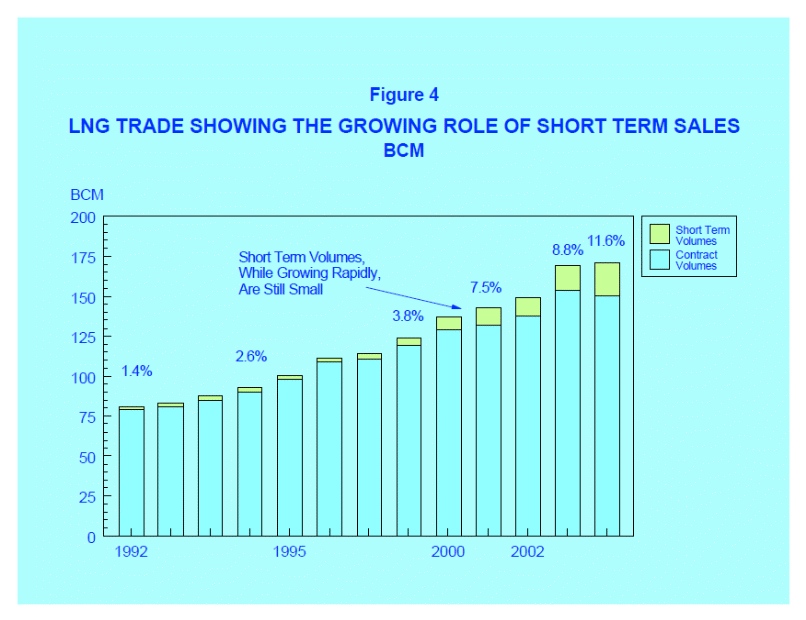
Of late, LNG markets have witnessed the upcoming of spot or short-term market. The LNG spot market has increased from zero figure before 1990 to just one percent in 1992 to a whooping figure of 8% in the year 2002. (8.4 million tons or 400Bcf). Short-run trade is estimated to continue to rise to 20% of LNG imports in the ensuing decade.
New varieties of Master Sales Agreement (MSAs) are fastly being employed to redress the business-related relationships growing under the emerging LNG spot trade.
MSAs are usually containing of a core MSA that contains “general conditions and terms “and a brusquer “confirmation memorandum” that contains a freestanding agreement between seller and buyer to buy one or more loads of LNG. MSA plays a significant role in the upcoming LNG spot market and helps a number of transactions.
For instance, MSAs allow the disposal of LNG generated over and above entrusted SPA sales for an LNG liquefaction venture. Producers might also employ MSAs to dispose extra loads at higher prices to other places where demand is high due to seasonal peaks. MSAs might also be employed by buyers to meet the additional demands due to temporary or seasonal demand. (Alfadala, Reklaitis & El-Halwagi 2009:37).
Majority of the experts is of the view that LNG spot contracts may increase to 15 to 30% of international LNG trade in the foreseeable future.
In the near future, spot contract for LNG is possible to soar due to freeing of market in Spain and Korea , accessibility of excess production facilities , the re-birth of the U.S LNG markets , the bulk orders given by new players like China and India and the availability of additional LNG transportation capacity. (IEA 2009:32). The above figures include both the short-term and spot LNG sales and swap transactions. (IEA 2009:32).
About 4 bcm/a of LNG cargoes were imported by U.S.A under short-term or spot contracts in the years from 2000 to 2002. Further, in 2003, LNG loads meant for Europe were diverted to U.S.A due to prolonged high scale of prices which pushed to a surge in spot buying. (Whitney et al 2009:101).
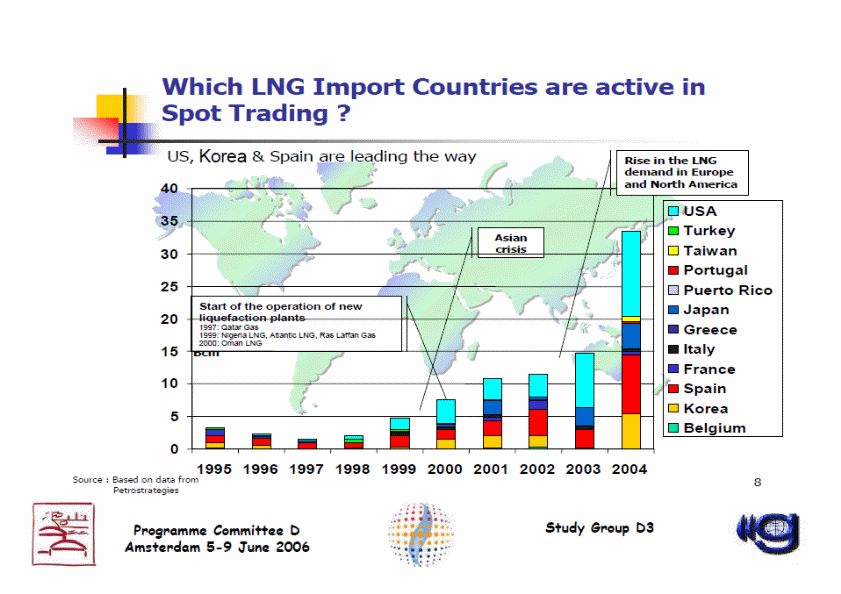
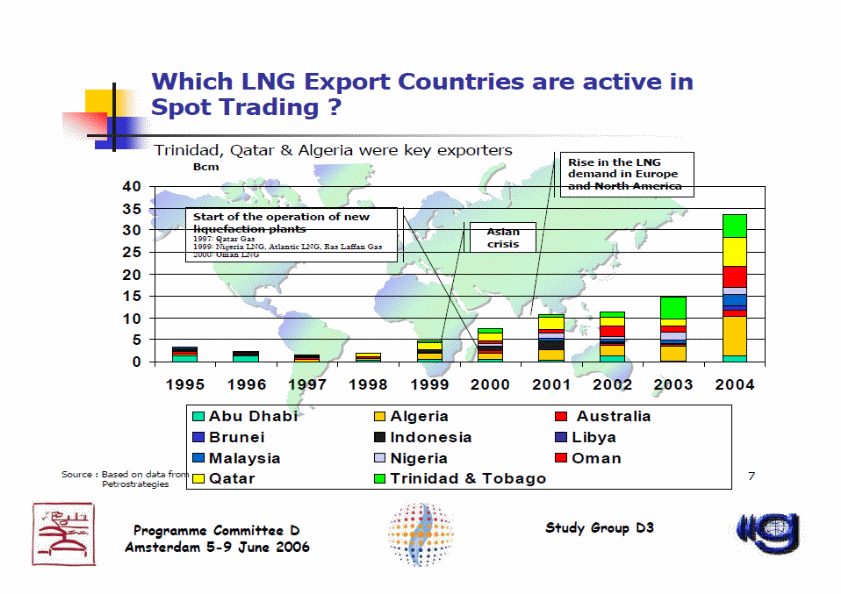
The spot LNG purchases in U.S.A are guesstimated at 12.6 bcm in 2003, which is a sharp increase over 2002 figures. LNG monthly imports in 2007 fluctuated from a high of 99 Bcf in April to a least of 20.8 Bcf in 2007. Since, very little quantity had been imported under long term contracts, U.S importers took the route of short term contract for their deliveries. (Whitney et al 2009:101).
Table 1: Share of Spot contract in International LNG Trade (%).
Whether LNG Will Be an Alternate Fuel for the Future?
The demand / supply balance of the globe’s three giant natural gas markets, the Europe, Asia/Pacific and US, is likely to transform, for the time phase 2009 to 2012. This will again have effect on the vibrant of the international LNG market and it is very probable that the Atlantic Basin, given its approach to the globe’s two principal natural gas markets, will play a more important role than ever before. (Balteskard 2009).
LNG has many salient features. LNG will not pollute either in water resources or in land or in the atmosphere as in the case of burning of fossil fuels. Further, even if there has been spill in the ocean while transportation, LNG will not explode or catch fire in its liquid state. LNG is not a new phenomenon. It has been conveyed successfully and used for many years. (Katulak 2005).
U.S.A has more LNG operations than any other nations as it is having 113 LNG receiving facilities. Attracted by its salient characteristics, U.S.A has initiated on a major drive to increase its LNG importation and employ the same in the ensuing decade and well ahead as its demand for LNG is expected to increase, while customary domestic supplies of other fuels started to decline.
Further, LNG storage and receiving terminals have excellent safety record even though these facilities are located in thickly populated areas. About sixty years ago, there was one tragic accident in USA, which occurred during the infancy of the industry, and it offered lessens both to the government and LNG industry. After this, well-structured construction design and safety norms have been framed and are being in use as of date.
In U.S.A, periodically, there have been minor fires and small vapor releases have been reported and however, there has been no reporting of a fatal accident. Thus, safety record in LNG industry is unmatched as far as fuel industry is concerned. According to experts, even in bad scenario, the most anticipated damage would be restricted in size.
Liquefied natural gas is having salient features as it does not burn and also there is no chance of an explosion. It is flammable within a restricted magnitude of 5 to 15% with air, if LNG is warmed and converted back into natural gas. LNG will not explode in a liberated atmosphere.
Further, during transportation also, there exists methods, and various equipments are used to transport the same safely. Codes, standards and regulations have been framed to make sure about secure and safe operations, thereby employing multiple stratums of protective measures.
According to US Federal Energy Regulatory Commission, present natural gas supplies are enough but establishment of new LNG facilities will be required by 2011 else there will be deficits.
Further, LNG facilities need a 3 to 5 years lead time for the construction of new LNG facilities. Thus, in view of the proven LNG industry with reliability and safety, it can be said LNG will definitely be the alternative fuel in the ensuing feature. (Katulak 2005).
Safety Aspects Of LNG as an Alternate Fuel as Compared to Fossil Fuels
One another factor which facilitates globalization of LNG is its safety aspects as there have been a few accidents involving LNG transportation. LNG industry is having long standing commendable record of reliability and safety.
There have been comparatively very few happenings involving loss of human lives, the one that occurred in Skida, liquefaction site in 2004 and one in Cleveland, Ohio that occurred in the consuming market in 1944. As of date, LNG trade has recorded more than 40000 safe voyages thereby covering more than 100 million miles.
On the sea voyages also, there have been very few incidents or safety issues either on the high seas or in the port during the transportation of LNG. There have been two reported serious groundings LNG Taurus and El Paso Kaiser both occurred in 1979 where there was no loss of cargo.
This excellent safety record stands in the sharp opposition to LNG big brother namely oil and other fossil fuels, which are encountering with catastrophe like recent BP oil spill, Exxon Valdez oil spill, Amoco Cadiz, Torrey Canyon, Erika, Aegean Sea and Prestige.
Unlike oil cargos, there have reliability on LNG vessel deliveries and there has never been a report of poignant gas shortages in LNG dependent nations like Japan where about 260 billion m3 delivered and Korea received 56 million m3 in 2002 alone.
The LNG receiving facilities and production centres’ safety record is also quite welcoming with relatively few incidents. As of date, there are about fifteen liquefaction terminals, fifty-one marine LNG regassification terminals and countless peak-shaving centres of which more than 100 are located in the United States.
In the last sixty-five years, the globe has encountered only just two colossal accidents that aggravated public antagonism against LNG that too mainly in USA ending in loss of some human lives.
On the safety side, LNG industry could virtually demonstrate that it can confront the worst storms like Hurricane Katrina. With the major oil refineries and oil extraction platforms underwent major break, LNG terminals situated in the Gulf of Mexico demonstrated that these facilities are much trouble –free to repair and restore normalcy than that of oil refineries. LNG industry is able to maintain such high safety standard mainly to adherence of high engineering standards.
Increasing Role of LNG in Catering the Global Energy Demand
LNG is outperforming as a best substitute for CNG. Considering the pipeline gas, LNG offers lower onboard storage weight, more consistent fuel quality, volume and lower pressure risk. Though LNG tanks are securely insulated, at times, there is a chance of heat transfer into the tanks which is obvious.
LNG operation has become more stringent than CNG as it is reported that there has been weathering limit fuel storage time onboard of the vessel and fuel vaporization. Thus, LNG fuel is more costly than compared to CNG even if the cost of compression work is taken into consideration with that of sourcing CNG. (U.S. Federal Transport Administration 1998:84).
Due to ardent supporters of global warming stiff opposition against use of fossil fuels, LNG become the most favourite fuel for power manufacturing industry. In near future, natural gas will also be used in fuel cells for automotive power and fuel cells energised by natural –gas-to –hydrogen technology could support an increasing percentage of automotive transport. (Downey, Morgan & Threet: 31).
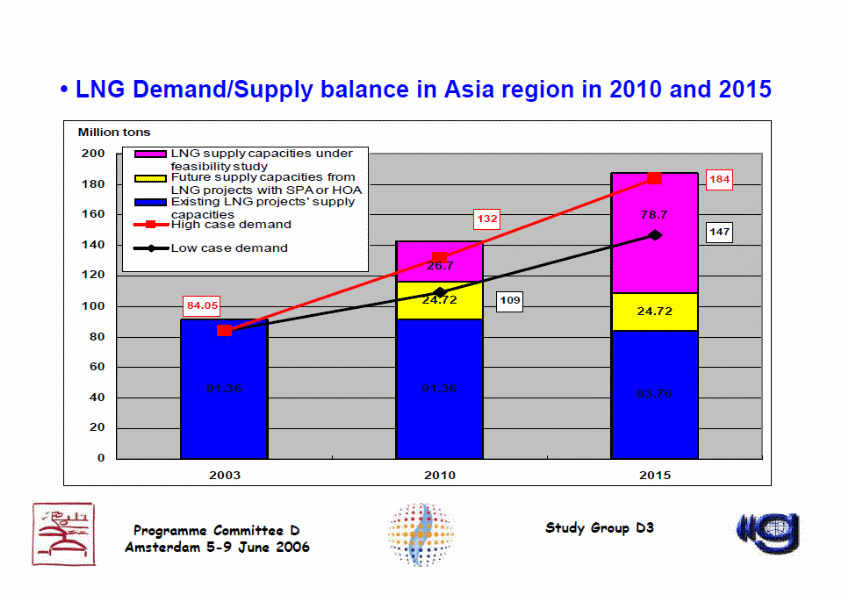
In the near future, the increasing global needs of energy have to be met by producing more energy to cater for the demand but at the same time, restricting and even reducing greenhouse gas emissions. (Barden, Pepper & Aggarwal 2009: 55).Hence, reliability on coal and oil is going to be minimised and at the same time, it will place more emphasis on LNG consumption. (Weirauch 2007:21).
Thus, increased LNG business will make the distinct regional markets to be more integrated one since contract terms and pricing are more flexible.
Though, environmental and safety issues will restrict the import optionality in certain markets, like that of USA, LNG is no doubt will become a significant component in the international fuel supply blend. Thus, the vibrant in the evolving LNG markets will influence that LNG, will, indeed, become the fuel for the twenty-first Century. (Alfadala, Reklaitis and El-Halwagi 2009:41).
Experts are of the view that based on the current consumption pattern; LNG demand will be soaring to about 200 million MT/per annum in 2010. This increased demand for LNG will pave the way to the introduction of extra 161 new vessels into the international LNG carrier market from 2005 to 2010.
This will increase the LNG ship fleet to 336 at the end of the year 2010. This anticipated increase in the demand for LNG careers simply denotes the increase in the demand for gas.
Thus, the increase in the demand for LNG and as the same have to be transported from one end of the globe to the other end of the globe, this will result in the introduction of larger vessels of 145,000 m3 to 250,000 m3, which will reap the economies of scale and will enhance the profitability of the transporting company. (Ariweriokuma 2008:188).
International LNG trade is estimated to grow over the next twenty-five years. As per IEA outlook However, there are also risks involved in the transportation business of LNG. A narration of accidents involving LNG carriers was given by Lakey and Thomas (1983). Further, there have been many instances of LNG spills on the decks of the LNG ships. (Wright 2006:11).
There have been many instances of lightning strikes followed by fires on LNG ships. However, these business risks are inherent in every business and this risk can be mitigated by availing insurance covers. Thus, LNG, will, indeed, become the global fuel for the twenty-first Century. (Alfadala, Reklaitis and El-Halwagi 2009:41).
There has steady increase in growth of LNG portfolios worldwide and thanks to the deregulation of LNG import markets both in USA and Europe which facilitated the recent materialization of a modified, “integrated” LNG approach.
LNG markets in Japan prolong to function under “take-or- pay” contracts with administered utility as purchasers while LNG market in European and USA seem to be footing on the fundamentals of tolling-style structures whereby providers of LNG can have access to the freed market for LNG by agreeing to pay an operating fee to the operators of regassification terminal and still can have the right to gas at the other end of the terminal.
As a substitute to the tolling understanding, some LNG integrated partners are subscribing equity ownership in the new LNG regassification terminals.
According to IEO 2010, the aggregate of natural gas consumption globally has increased by 44 %. Further, it has been estimated by IEO that global consumption of natural gas is set to reach to 156 trillion cubic feet in 2035 from that of 108 trillion in 2007.IEO 2010 has estimated that natural gas consumption is likely to expand by a mean of 1.8% per annum from 2007 to 2020.
LNG stays as a major energy source both for electricity manufacturing and for industrial uses throughout the IEO projection phases. About forty percent of aggregate consumption of gas in the year 2007 was consumed by the international industrial sector and is prone to preserve the similar trend through 2035. (IEA WEO 2010).
LNG is being preferred fuel source in the new generation capacities in the power manufacturing sector, as it is having relative fuel competence, quick erection timeline, low emissions and lower capital outlays. (IEA WEO 2010). The aggregate of consumption of LNG for power plants all over the world remained thirty-three percent in the year 2007 and is anticipated to surge to 36% up to the year 2035. (IEA WEO 2010).
LNG utilization in non-OECD states increases about three times exceeding gas utilization in OECD nations with an enhancement of 0.6% pa for OECD states and 1.9% pa for non-OECD states from 2007 to 2035.
Due to this, non-OECD states vouch for seventy eight percent of the aggregate of worldwide increase in utilization of natural gas as the allocation of aggregate of worldwide natural gas utilization of non-OECD state’s swells to fifty-nine percent in 2035 from fifty percent in 2007. (IEA WEO 2010).
The major allocation of projected growth of worldwide natural gas extraction is expected to materialise in non-OECD states, with the hefty chunk of amplification originating from the Middle East with an projected augmentation of 16 trillion cubic feet between 2007 and 2035, Russia and other nations of non-OECD Eurasia and Europe vouches for six trillion cubic feet and Africa vouches for 7 trillion cubic feet as depicted in the following chart. (IEA WEO 2010).
Moreover, Qatar and Iran has the competence to amplify their natural gas extraction by an aggregate of 12 trillion cubic feet which is about twenty-five percent of the aggregate increases in the worldwide gas extraction (IEA WEO 2010). A poignant portion of this increase is anticipated to arise from a sole offshore field which is named as South Pars on the Iranian side and North Field on the Qatar shore.
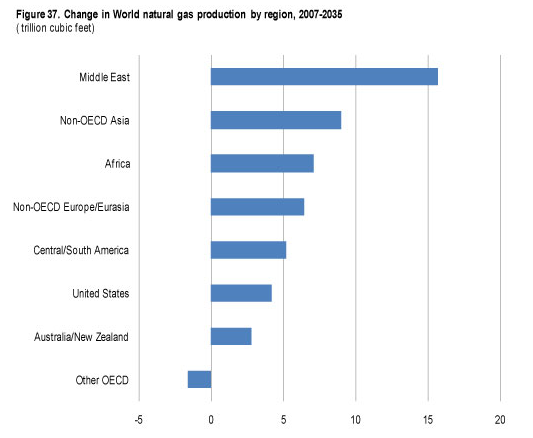
Further, the availability of shale gas , tight gas and coalbed methane gas are yet to be estimated fully , according to IEO 2010 , there has been major increase in the supply of the above particularly in U.S.A and also available in China and Canada.
U.S.A is engaging update expertise to tap the new gas resources like engaging expertise like hydraulic fracturing and horizontal drilling which have assisted to recognize nations’ major shale gas reserves and have assisted to augment the cumulative of natural gas resources in U.S.A by about fifty percent in the last ten years. (IEA WEO 2010). It is estimated that shale gas will account for 26% of total natural gas production in U.S in 2035.
According to IEO 2010 estimates, Canada’s shale gas, tight gas and coalbed methane gas will account for 63% and China will account for 56% of their aggregate domestic gas production in 2035. (IEA WEO 2010). As per IEO 2010, LNG will account for an increasing share of global natural gas trade. Further, the global natural gas liquefaction capacity is likely to increase by 2 to 4 times and to 19 trillion cubic feet in 2035 from just 8 trillion cubic feet in 2007.
As far as liquefaction is concerned, the majority of the increase is likely to be developed from Australia , Middle East , where a massive amount of new liquefaction facilities are in pipeline of many of which is expected to start their operation within the next decade (IEA WEO 2010).
To cater the global demand, the global gas production will be required to be increased to 50 trillion between 2007 and 2035. Major portion of this increase is expected to emanate from non-OECD nations, of which about 89% increase is expected to happen between 2007 to 2035.
Thus, the production of non-OECD natural gas increases by a mean of 1.8 percent per annum to 111 trillion cubic feet in 2035 from just 67 trillion cubic feet in 2007 whereas gas production in OECD nations is likely to increase by just 0.4 % per annum to 45 trillion cubic feet in 2035 from that of 40 trillion cubic feet in 2007 (IEA WEO 2010).
Table 2: World natural gas production by region and country in the Reference case, 2007-2035 (trillion cubic feet).
Globalization of LNG
According to Chevron Global Gas, globalization of LNG is materializing as Henry Hub prices have turned to be the yardstick not only for Europe but also for spot LNG consignments around the globe as of today. The commercial and industrial boom that had started in the 1990’s which fostered ever-increasing appetite for alternative and economical energy resources.
Further, there have total changes in the governmental policies both in Europe and USA which supported use of natural gas which is more environmental friendly as contrasted to oil or coal or other fossil fuels. Moreover, gas-fired power plants have been established in these developed economies. Besides, Asian tigers China and India are emerging new economic super power during this century and they have stimulated higher demand for LNG.
EIA (The U.S Energy Information Administration) has projected that demand for global natural gas will increase to 182 trillion cubic feet (about 5.15 trillion m3 in 2030 from that of just 95 trillion cubic feet (2.69 million m3) in 2003. The global LNG trade will in turn is expected to increase with massive increase in exports from Australia , Qatar and other nations like Trinidad while nations like China , India and USA is expected to import poignant quantities in the near future.
The boom in the LNG trade has impacted the business in various ways. For instance, the LNG fleet has increased to an estimated 350 in 2010 from that of just 100 in 1998 with almost all the new carriers are having capacities which is higher than of that existing fleet. Likewise, the quantum of receiving terminal phases also witnessed mammoth increase with some existing plants going for expansion.
The capacity of liquefaction also witnessed significant growth with the 17 trains will be joining which are under construction with the present 15 trains. Further, another 20 trains are under planning phase. Tremendous pressure is being exerted on the capacity of the industry to establish brand new LNG infrastructure.
There has been a skyrocket increase on the demand side in the engineering services as delivery of cryogenic equipment has become a restricted access. Thus, the capacity limitation may impact not only the schedule of operations and constructions but also probably their quality.
Globalization of LNG is becoming more competitive thereby exerting pressure on companies to plan for efficiencies and cost savings. The global LNG markets have also observed the emergence of many new operators with no or little experience in LNG logistics, pushed primarily by arbitrage and profitability of the industry. There is a surge in the both spot and short –term contracts in LNG trade recently.
As a prelude to globalization of LNG, industry exhibits abundant caution to cater environmental confronts by meaningful planning and risk analysis. This can be regarded as a positive trend for LNG industry as it is seeking to establish LNG supply chains without hindering the environment.
To take active part in the LNG globalization, LNG industry is pumping huge capital to cater the globe’s appetite for natural gas which is anticipated to surpass the demand by 2030. Trillions of dollars are being invested into liquefaction, pipelines, receiving and shipping, terminal technology and infrastructures as both customary and new players working for challenging opportunities globally.
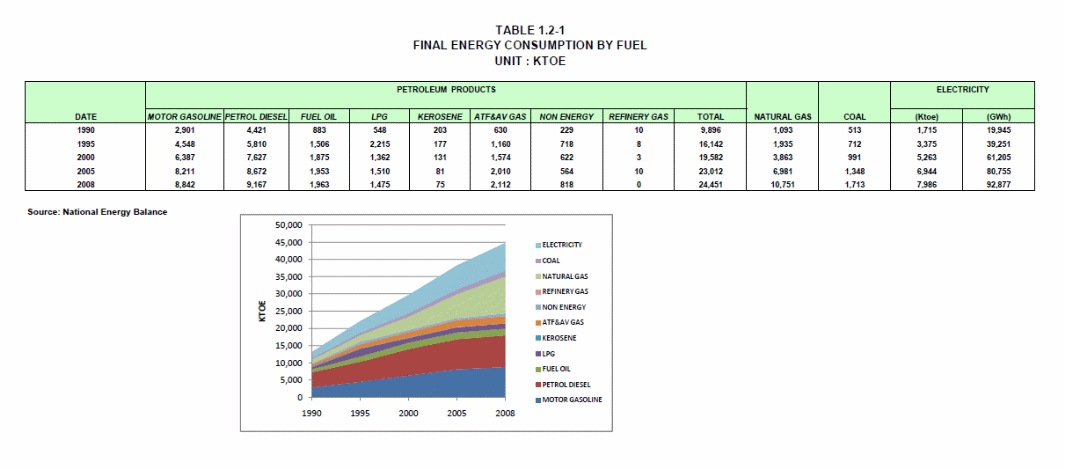
A Growing Resource for LNG Exports employing Coal Seam Gas
Australia is tapping a new source of Coal Seam Gas and will export the same as LNG around the world. Thus , Coal Seam Gas has not only established enough to equalize declining gas reserves somewhere in Australia but also gas reserves are great in numbers which may result in exporting of surplus gas in the guise of LNG.
Coal Seam gas is like that of Shale gas and has been ignored as a substitute for LNG until recently. Further, according to Australian gas companies, there Coal Seam gas contains about 98% of methane and contains only a very small quantity of carbon dioxide and nitrogen. Hence, Coal Seam gas is regarded as a clean gas and will be functioning as a substitute for LNG.
Coal Seam gas (CSG) is presently accounts about fifteen percent of gas production in the Australian Eastern states whereas in Queensland, it accounts for more than 70% of gas production. As per Consultants Energy Quest, CSG production is increasing overwhelmingly as they are not only proven but also probable reserves. Australian oil companies like AWE is also planning entering into CSG areas.
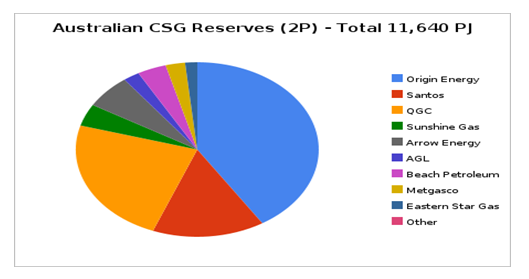
There is no verified data available as regards to Australian CSG reserves as of date. However, according to “The Australia”, there is larger quantity of CSG reserves available in Queensland than that of Western Australia’s offshore. Queensland State has vast resources of coal-seam gas according to SMH. (Gav 2008).
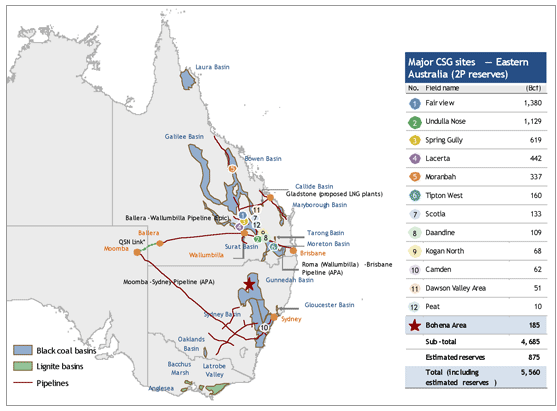
Notes: Reserves announced up to 1 January 2007.
Employing CSG for LNG is a new development in this field. Ever rising LNG prices have compelled the need to alternate or analogues to LNG which resulted in the discovery of CSG. Further, CSG cost of production is very low as compared to LNG.
The Asian customers like China is ready to pay about $12 per gigajoule while at the same time,the cost of rising CSG is guesstimated around $ 2.6 per gigajoule (Gav 2008).
Experts are of the view that Australia is having enough gas reserves which could speed up its LNG exports, enhance the inland gas consumption for power generation and employ CNG for vehicles and still left with adequate gas reserves which could last about four decades. (Gav 2008).
Can LNG Market be globalized by interconnecting the same?
The ever increasing demand for LNG on global level mingled with present short supply has transformed the LNG market to a seller’s market from a buyer’s market. What the crude oil did five decades ago is now consecrated on LNG which is being driven as an international market-driven commodity. When one looks at the LNG market for 2007, it is evident that there has been flexibility of LNG pricing.
For instance, U.S.A in the first half of 2007, received record quantity of LNG mainly due to lower price existing in European markets as prices in Europe went much lower than the U.S price.
However, in the last quarter of 2007, due to competing markets, especially in Asia / Pacific market, which purchased a mammoth quantity of LNG to compensate outages in nuclear power plant in Japan which started to pay higher prices and due to this, imports of LNG by U.S declined to lowest levels since 2002.
Nonetheless, depending upon the price, in the Atlantic region, shipments were diverted to Spain or U.S from Nigeria or Trinidad.
There has been tremendous development in the LNG commerce in the recent years which has raised questions like whether it is possible to trade LNG as a global commodity. A variety of factors have to happen for this which includes the following:
- An enhanced flow and patterns of global commerce in LNG
- The creation of single and uniform price around the globe.
- Possibility of liquid trading
- Flexibility in supply of LNG (Stoppard 2008).
Out of the above, the creation of a uniform and single price for LNG will be most difficult to accomplish due to variances in the international pricing pattern of natural gas globally due to distance involved and transportation costs.
It is to be noted that natural gas price is linked with the global oil price which often witness frequent fall and rise. In majority of the European markets, this being witnessed where there is a close connection between oil prices and movement of gas prices which is typically sanctified by contract and hence there is inverse relationship between oil and gas price.
However, in UK, this is differing as nearly fifty percent of the gas consumption is traded on spot markets through NBP (the virtual National Balancing Point) as the major trading point in the exit / entry footed system.
Between Qatar and UK, there has been long term contracts thereby supporting large infrastructure projects which were finalised at NBP prices instead of tied to oil prices. The other fifty percent LNG contracts were entered on the basis of North Sea prices which have relation to many indices like inflation, coal, fuel, electricity and oil. (IEA. NG Review 2006).
In the Asia / Pacific province, two largest LNG importers Korea and Japan, the LNG contracts are tied to oil prices, so as to negate the peril of price competition with oil. As the LNG liquefaction train needs substantial investment, LNG suppliers enter with a pricing model that offers a floor price.
For suppliers, this floor price restricts the decline in the LNG price to some degree even if the oil price prolong to decline continuously. By contrast, purchasers are safeguarded by a price cap which limits LNG price increases when oil price soar above some level. (IEA Nat.Gas Mkt Review 2006).
As far as North American market is concerned, LNG market is functioning similar to the European market with long –run, oil footed contracts. Between the 1980s and 1990s, gas market was liberalised and a “hub” structure was created whereby natural gas is now dealt at more than forty principle trading centers or Hubs which are spread over across North America.
The widely known is Henry Hub which is situated in Louisiana which is being extensively used as a reference point for fixing the price of LNG which determines the futures contracts for gas in NYMEX.
As of now, LNG is being traded on a regional basis, the estimated increase in LNG integrated which will throw more chances for arbitrage paving to a magnitude of unification of regional gas prices. Global LNG markets will enjoy greater flexibility due to the emergence of Qatar as major supplier of LNG in recent days.
LNG market watchers are of the opinion that there is every possibility of convergence of regional gas market, Henry Hub pricing will turn as a common or uniform price mechanism and could be termed as a de facto LNG floor price for the international LNG market.
Is Qatar Is The Major Source Of Supply Of Lng In The Near Future?
Of late, Qatar has emerged as a poignant global LNG supplier as the Qatar’s geographic position enables it to supply both for Asian markets and European markets at analogues’ costs while the U.S market also falls within its competitive accomplishment.
Many giant LNG projects have emerged on-stream during 2009-10 with major of them come under the group of flexible LNG policies and typically assigned for the United States and Europe market.
According to report in Gulf times in its August issue ,in the last 5 years , LNG has become a poignant ingredient of the international energy supply mix and recent investigations reveal that LNG demand growth will stay robust with international LNG demand is estimated to swell by 10% per annum through 2015.
According to Lehman Bros LNG report, by 2011, new projects in Qatar will be the major players for global LNG growth and are anticipated to add about 5.4 Bcf/d of additional LNG by the end of the year 2011. Expansion of LNG handling facilities by Qatar will facilitate Qatar to continue to reap benefits of its LNG resources and to expand its client base.
In the Asian market, Qatar has emerged as a largest single supplier and if additional handling facilities are added then it will make the Qatar to expand its exports to gas starving nations around the globe. According to Credit Suisse report, Qatar has a locational advantage as it is equidistant between Asia/pacific and Atlantic markets in shipping terms. This geographical location advantage will facilitate Qatar
It is to be noted that as long as US dollar is weak, the demand for LNG will be strong in the markets outside the U.S. For example, PetroChina, Shell and Qatargas inked the first long-run Qatar-China LNG supply contract. This long run contract is for 25 years contract where 3 million tonnes of LNG per annum will be supplied from Qatargas IV project from Doha, which is likely to bring in about 7.8 million tonnes of LNG on-line by the year 2010.
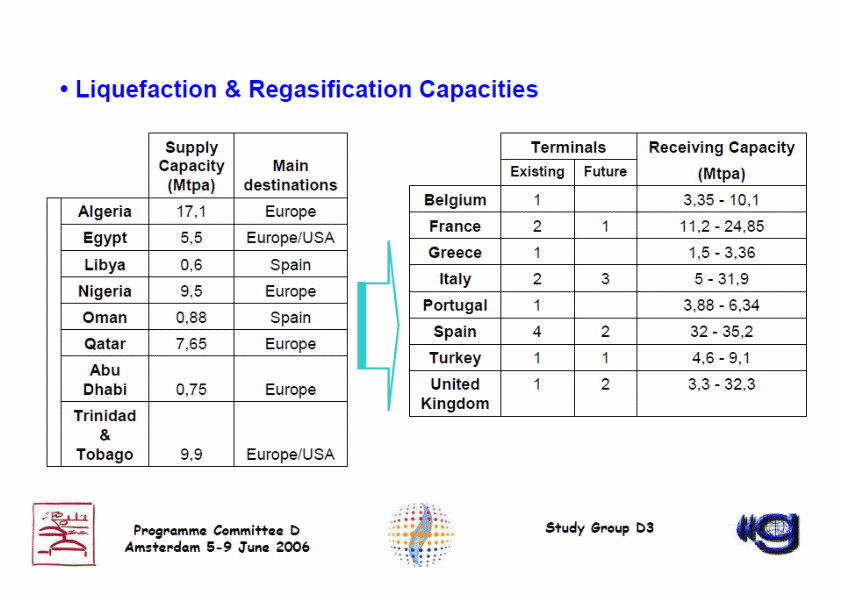
As per CERA Insight August 2008 report, when there is a lower demand for LNG due to storage restrictions, U.S will enter into market and will buy the LNG at an advantageous price.
However, of late, convergences of factors have made NG floating storage as a viable solution. This has resulted in the excess capacity of shipping capacity which made the charter rates to fall and with the enhanced regassification quantum in major traded markets like U.S.A and U.K.
Thus, new vistas like use of more floating storage will offer more destination flexibility to sellers of LNG which will facilitate them to keep the LNG at ocean to maintain the option open to retort the fluctuations price in the near future. Further, when it will become functional in the year 2011,the planned LNG Storage Hub in Dubai which will be the first of its kind in the globe, which will offer more flexibility to the global LNG markets.
The proposed Dubai storage will offer an aggregate storage capacity starting from 40 to 65 billion cubic feet (Bcf) and will give clients the capacity to trade, store and pre plan supplies of LNG. Sakmar & Kendall 2009: 9).
The Qatar’s talent to offer both market flexibility and supply and the permutation of end –markets keen to pay premium prices augments Qatar’s status as the globe’s major LNG supplier.
In this part, a major inference for Qatar is the prospect that Qatar, with its anticipated International Mercantile Exchange (IMEX) and Energy City Qatar will turn to be a chief energy trading center in the near future. Thus, the envisaged flagship contract for IMEX will be the first of its kind in the global LNG contract which will offer a distinctive podium to administer gas risk and further will usher the growth of the spot LNG market.
The growth of a striking trading platform of LNG will facilitate producers, users and investors to hedge their revenues or the costs.
Though, both the supply and demand for LNG will fix the price for the LNG, the growth of real international LNG market will offer better transparency and over the period, will result in a better market divergence and growth of LNG infrastructures and projects not only in Qatar but around the world. (Sakmar & Kendall 2009: 9).
LNG Market Performance, Prices and Production of Trinidad and Tobago
Table 3: Henry Hub Prices, July-August, 2009 (US $/MMBtu).
Table 4: Liquefied Natural Gas Monthly Production Budget Year 2008-2009 MMBtu of Trinidad and Tobago.
Table 5: Five Year Average Liquefied Natural Gas Production Schedule (MMBtu) of Trinidad and Tobago.
Train 1 started production in 1999, Train 2 in 2002, Train 3 in 2003 and Train 4 in December 2005.
During the review phase of July to August 2009, aggregate gas production averaged 59,850,350 MMBtu, which registered an increase of thirteen percent during the review period. Production of LNG was relatively stable in Train 1 while other productions in other plants witnessed fluctuations due to operational problems.
During the phase of April to June 2009, Tobago and Trinidad exported 115,827,937 MMBtu. (www.energy.gov.tt) Out of this, the chief exports were sent to United States which accounted for 38% of total exports whereas European markets imported about 35%. During the last quarter of 2009, Argentina started to import LNG.
Table II emphasizes the 5 –year mean LNG production schedule of Trinidad and Tobago In spite of prolonged global economic crisis, prices mirror a prolonging upward trend following the least Henry Hub price in May 2009 and quoted $ 3.33 MMBtu. Henry Hub average stood at $ 3.67 MMBtu during the period July to August 2009. Henry Hub review prices are illustrated in the Table 1.
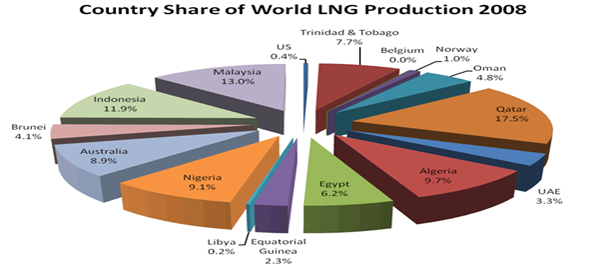
In the global LNG trade, Trinidad and Tobago occupied seventh position during the year 2008 and its major exports were to USA market. The nations’ export of LNG amounted for about eight percent of global LNG exports.
Trinidad registered an increase of 2.48% of LNG production in the year 2008 as compared to the year 2007. Trinidad’s LNG export is being shipped to various points in South America, North America, Europe, the Caribbean and Asia. During the year 2008, Trinidad exported 731,633,534 MMBtu of LNG which is 5.59% increase over the 2007 figure.
During the 4th quarter of 2008, about 34% of the LNG produced in Trinidad was exported to USA, 29% was exported to Spain, 13% was exported to Korea and 8% was exported to UK. In addition to the above, Caribbean imports of LNG from Trinidad stood at 7%, Asian markets (Taiwan and India) accounted for 2% while the balance 7% was exported to Belgium, Brazil, Portugal and Greece (www.energy.gov.tt).
Conclusion and Recommendations
There are adequate gas resources to last for at least seven decades from now where as it is estimated that current oil reserves will last for only 42 years from now. The demand for LNG appears destined to increase inevitably as major consuming nations like U.K, U.S.A and Canada which actually witness irreversible slowdowns in their gas production.
If no further sources of LNG are to be identified, Europe and USA could witness a disparity in supply of LNG as demand is expected to go up from 2011 onwards. In the year 2009, all the European LNG terminals were operating at their full capacity level, and this demonstrates that there is ever increasing demand for LNG in the European markets.
According to IEO Energy Outlook 2010, the aggregate of natural gas consumption globally has increased by 44 % as of date. Further, it has been estimated by IEO that global consumption of natural gas is set to reach to 156 trillion cubic feet in 2035 from that of 108 trillion in 2007.IEO 2010 has estimated that natural gas consumption is likely to expand by a mean of 1.8% per annum from 2007 to 2020.
According to Chevron Global Gas, globalization of LNG is materializing as Henry Hub prices have turned to be the yardstick not only for Europe but also for spot LNG consignments around the globe as of today.
According to report in Gulf times in its August issue of 2009 ,in the last 5 years , LNG has become a poignant ingredient of the international energy supply mix and recent investigations reveal that LNG demand growth will stay robust with international LNG demand is estimated to swell by 10% per annum through 2015.
LNG is increasing used by power manufacturing units and industrial sectors, there is no doubt the demand for LNG will be substantial in the near future. Many new players have come in the field of LNG supply and demand and this demonstrates that LNG will be the future fuel for the globe an LNG globalization is not far off.
This research essay recommends that the global LNG supply quantum should be increased by finding new reserves and by tapping more Shale gas, CSG and tight gas reserves. LNG Spot contract should be encouraged to derive more advantages to the suppliers and a uniform price for LNG around the world should be framed to materialise the objective of globalization of LNG.
Statement of Research Questions
- This research will critically evaluate the issues of globalization of LNG.
- This research will examine whether LNG will be an alternative fuel of the future replacing conventional fuels. (Fossil fuels).
- This research will critically examine the growing role of LNG in meeting the global energy demands in future.
- This research will investigate the escalating international trade of LNG spot contracts thereby replacing long-term contracts.
Research Methodology
This chapter will aim to justify the methodological decisions taken and used to investigate this research problem, through the choice of research design, data collection method, measurement tools, sample and size. The objective is to match the most appropriate methodological approach to the problem, bearing in mind time frame restrictions and limited resources.
Many collections of published works, which deal with the recent ideas and debates of the globalisation of LNG will be examined, analysed and then deliberated. Some case study examples and evidence from across the world have also been widely discussed in this research. To support the theme and idea, this research has utilised the data’s published by the WEO, Credit Sussie on the subject to support its findings.
Research philosophy
Research philosophy describes the way researcher think about the development of knowledge which affects the way researcher go about doing research. There are varieties of research doctrines: “positivism, Interpretivism and realism.” (Saunders et al 2006).
This research is based on mixtures of all these three philosophy but most of the part of this research follow realism approach as this recognise the importance of understanding people’s socially constructed interpretations, understand the social forces, structures and processes that influence and people’s view and behaviours.
As per positivists view, a data cannot be regarded as proven if it has not been tested empirically. (Saunders et al 2006).
According to Interpretive philosophy the reality of knowledge depends on understanding and interpretation and realities can differ across time and place. This philosophy action is not governed by discrete patterns of cause and effects but by rule that social actor use to interpret the world. But it is implicitly conservative because it ignores the possible structure of conflict in the society and the possible sources of social change.
Realism shares some philosophical aspect with positivism and it also recognises that people are not object to be studied in style of natural science. (Saunders et al 2006).
Research approach
Research approaches can be classified into two categories: First one is inductive approach, in which we collect the data and develop theory as a result of analysis. Whereas deductive approach is another method in which we develop the theory and hypothesis and design research strategy to test hypothesis. (Saunders et al 2006).
This research will use the deductive approach for this research as this approach focus on:
Moving from data to principle
The majority of the qualitative researchers select to shift from data to the theory and from the particular to the general. Thus, examination and study of data is footed on logic of exposing things from the data and generating theories on the footage of what the data includes and of moving from the specific features of the data towards more generalised theories or conclusions. (Denscombe 2007:253).
The need to explain the causal relationship between the variables
The independent variable is the one that has the effect or brunt on the dependent variable. Any change in the independent variable will automatically impact the dependent variable. It is to be observed that smoking increases the chances of lung cancer. However, lung cancer does not increase the chances of smoking. In this illustration, there exists a dependent and an independent variable.
Smoking tobacco is an independent variable and lung cancer is a dependent variable. Likewise, in this research, globalization of LNG is the independent variable and increasing demand for LNG, polluting fossil fuels, limited availability of fossil fuels, increased supply of LNG, availability of enhanced Liquefaction facilities of LNG.
Existence of short-term contract or spot contract for LNG, and availability more number LNG carriers to transport LNG, are all acts as a dependent variables. (Denscombe 2007:49).
The collection of quantitative data
Quantitative data collection might expose issues that are worth exploring in more detail by employing qualitative interviews to understand the research issues in an exhaustive manner. Competitive data can be employed very efficiently without the requirement for intricate statistical analysis.
Collection of quantitative data includes, questionnaires, surveys, rating scales, checklists test and other more formal types of measurements apparatus or instruments. Quantitative data is the most generally gathered from the available data and it is easy to collect and translate data into meaningful metrics or yardsticks.
Thus , quantitative data collection methodologies is to categorize the features , count them and then build statistical models in an effort to illustrate what is being observed. Quantitative data is normally gathered automatically from structured questionnaires or from operations that include chiefly closed questions. (Denscombe 2007:49).
The necessity to select samples of sufficient size in order to generalise conclusions. (Saunders et al 2006)
To generalise from the sample to the entire gamut of collection of data , the researcher do not need any assumption that the compilation of facts which one may judge by the samples that have a constitution influenced by any further cannon of ‘ uniformity” that is at once associated in the statement that the collection sampled has the analogues just described.
Thus, a finite gathering of facts which has any definitive constitution whatever this composition more or less analogues, the researcher can say with probability that we can judge the whole gamut of data with help of fair samples of that entire data to arrive at a conclusion for the research. (Various 2008:84).
Research strategies
This part o research deals with research strategy of collection of data and analysing method and how this study is going to handle constraints in this research based on the research questions and objectives. Although there are various research strategies, this research will follow experimental strategies because:
It defines the theoretical hypothesis
A proper theory is a logical series of rule like statements namely theoretical hypothesis of which their combination includes at least one –unavoidable theoretical phrases of its own. Thus, a theoretical hypothesis is a hypothesis that absolutely contains hypothetical phrases.
A theoretical hypothesis compact with a constructed replica or with a structure of hypothetical variables that intercepts in the functional relationships between dependent and independent variables. Theoretical hypothesis hypothesize the subsistence of hypothetical variable or constructs of this type or moreover they compact with functional interrelations between them or with their development as such.( Madsen 1988 :50).
Selection of samples
There are two varieties of sampling that is available to a researcher. They are probability sampling and non-probability sampling. Probability sampling is footed on the notion of the events or people that are selected due to researcher familiarity of some notion of the probability that these will be symbolization of cross-section of events or people in the entirety of population that is being researched upon.
Non-probability is carried out in the absence of such knowledge about whether those embodied in the sample are symbolizing the entire population. (Denscombe 2007:13).
Use of dependent and independent variables
In any research, the researcher will try to quantify the association between one band of variables which can be called as determinants or predictors and some criterion or outcome variable in which the researcher is interested. This resultant variable which the researcher’s goal is to illustrate is known as dependent variable.
A dependent variable is a factor whose value reckons on the level of another factor which is referred as an independent variable. In the illustration of cigarette smoking and mortality due to lung cancer the number of cigarettes and duration of smoking smoked are independent variables upon which the mortality due to lung cancer and hence , the lung cancer mortality is the dependent variable.
Likewise, in this research, globalization of LNG is the independent variable and increasing demand for LNG, polluting fossil fuels, limited availability of fossil fuels, increased supply of LNG, availability of enhanced Liquefaction facilities of LNG. Existence of short-term contract or spot contract for LNG, and availability more number LNG carriers to transport LNG, are all acts as a dependent variables. (Wassertheil-Smoller 2004: 96).
Includes comparison
In a research study, comparison designs include distorted dependent variable and independent variable counted across all groups. Further, a comparison design includes casual –comparative designs and quasiexperimental designs which may involve two groups being contrasted to each other on a common dependant variable. (Mertler 2006:89).
Conduct pilot study
A pilot study creates parameters and procedures. For instance, in medical research, use of new medicines with the rat and rabbit can be recognised as a pilot study. However, many pilot studies are intended from the ground up as pilot studies, meant to offer useful info that can be utilised when the real research is under progress.
Further, pilot study can save a lot of money and time if done properly. In this research study also, first a part of the literature review has been made to ascertain whether this research would be really beneficial and would come out with material facts on the subject. (Bordens 2006:150).
Determine place, time and duration of the experiment (Saunders et al 2006).
With the help of GANTT chart, this research study has already detailed the time, duration of the project. With the help of research methodologies, this research study has already detailed what experiment is going to be used to do this research.
Data Analysis
To find out the available data
To find out available data, this research study has used all the secondary sources of data available from the books, journals, websites, newspapers, online-libraries, resources from internet etc.
To assess the available data
This research study has accessed all the secondary data on the subject from the lists of references which is listed at the last section of this research study.
To corroborate the available data
This research study has corroborated all the available data that have been used in this research study to arrive at the conclusion and to make a recommendation on the subject.
Further, as referred earlier, this research will be using an empirical study approach as a main research tool for this research. An empirical study will explain the expansion of exhaustive intensive wisdom about a specific “study”. Further, an empirical study approach will help the research study has an extensive talent to forward answers to the questions like how, what and why. (Robson 2002).
Thus, empirical study methodology has been advocated as a constructive strategy if the goal is to develop a vast understanding of the background of the research and the processes being endorsed. Further empirical study methodology is a tremendously valuable style of investigation of existing theory. (Saunders et al 2006).
The past empirical research studies offer a great insight in to this research study and this research study has used mostly the past empirical studies to corroborate and vouch that LNG will be the future fuel for the globe and there is every possibility of the process of “globalisation of LNG “in the coming decades.
Past empirical studies like IEO WEO Report of 2006, EIA of U.S report, Credit Suisse LNG report, EIA International Energy Outlook 2008 will be used in this research study to corroborate the research hypothesis.
IEO WEO survey conducted in 2006 estimated the demand from North America and concluded that the supply of natural gas from indigenous sources in the North American region will not keep match over the estimation period and as a result, it identified that there will be a great demand for LNG in USA in the years ahead.
As per recent research study, the global LNG supply is expected to increase by forty-four percent from 2007 to 2010 and there will be back end load due to project implementation delays. Supply of LNG is anticipated to increase from 22.3 bcf/d in 2007 to 32.2 bcf/d by 2010. (Alfdala, Reklaitis and EI-Halwagi 2010:34).
According to Credit Suisse LNG report, there was a 3% increase in global demand for LNG (except North America) over the last five years and the identical demand growth is anticipated in the next five years with increased demand anticipated from India, China and the Middle East, which are likely to replace LNG in the place of oil and use more LNG for manufacturing of power. (Alfdala, Reklaitis and EI-Halwagi 2010:35).
EIA (Energy Information Agency) has predicted that U.S LNG imports would soar to 4.5 trillion cubic feet in 2030 from just 0.6 trillion cubic feet in 2005. According to Credit Suisse LNG Report, U.S will buy LNG during the phases of low demand and will intake the global excess when there is a sluggish in demand. However, in the future also, U.S going to remain as a strong market for LNG forever. (Alfdala, Reklaitis and EI-Halwagi 2010:35).
Simon Cattle, Head of Supply and Trading of BP visualises that European LNG imports are likely to have about 100 percent increase in 2020 from the current level of over 170 billion m3 from 2010 levels, which are accounting for about 25% of the total European gas supply, and he anticipates that UK will surpass Spain as Europe’s largest LNG consumer and importer. (Lngunlimited, 5 March 2010:3).
According to the EIA International Energy Outlook 2008, global primary energy demand is estimated to soar by fifty percent between 2005 and 2030, and this will be greatly reliant on the magnitude of economic growth by then. The emerging Asian tigers namely India and China will be witnessing an abnormal economic growth due to globalisation.
Due to this fact, it is estimated that more than twenty-five percent of global energy demand will be coming from the Asian tigers namely India and China by 2030. On contrary, the share of U.S consumption of energy is likely to decline to 17% from that of 22% between 2005 and 2030.
As per the EIA International Energy Outlook 2008, world gas consumption is anticipated to increase for the phase 2005-2030 to 158 tcf in 2030 from 104 trillion cubic feet (tcf) in 2005. Further, gas import dependence is likely to soar substantially in all major consumer markets around the globe.
According to EIA IEO 2008, except in Southeast and East Asia where gas import dependence is already very high, gas import dependence is likely to soar considerably in all chief consumer markets. The import dependency of the China and the EU will soar about seventy percent of their domestic consumption by 2030. (Amineh & Yang 2010:4).
As per EIA IEO 2008, as of January 2008, Iran and Russia jointly hold about 43 % of global gas reserves. Though the Middle East has major gas resources, but it stays chiefly untapped. This is mainly due to intricacies or cost associated in developing these gas resources and supplying the same in the market.
Considering the international oil market, the global gas market can be said to be a regional one which comprised of Russian –European market, Asia and the North-American market.
Non-OECD Eurasia and Europe and the Middle East vouch for about forty percent of the international production of natural gas in the year 2005 and are anticipated to account for about forty-five percent of the increase in the global gas production between 2005 to 2030.
Further, OECD nations will lose their share of international production to 27% from that of 39%. Further, it is predicted that by the year 2030, supplies of gas for the global market will emanate from lesser nations than that of today due to some of the gas sources will dry up by then. (Amineh & Yang 2010:4).
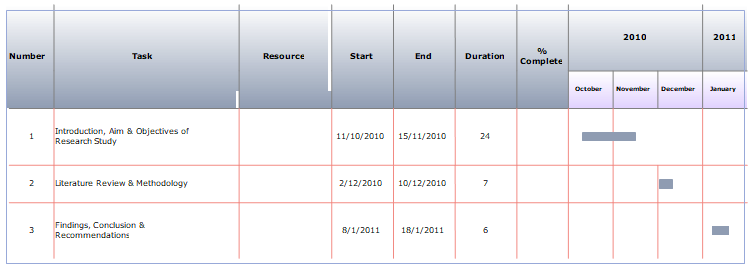
The above Gantt chart indicates the association between the project tasks, together with estimation of time for completion of research study for each section. The horizontal axis of Gantt chart exhibits the time at which each phase of the project will be completed and the vertical axis indicates the research activities to be accomplished. The blue bar shows the required start time and duration of the different phases of research activities.
Once the project is approved, the research project would be concentrating from 11th October to 15th November for the completion introduction, aim and objectives of the research study.
From 2nd December to 10th December, research study will be concentrating on the literature review and Methodology. From 8th January to 18th January 2011, findings, conclusion and recommendation section will be completed. (Pyzdek 2004:42).
Ethical issues
Ethical issues are also important for collecting data from the organisations and information from staff of organisation.
It is voluntary participation for the organisation and ensures that I will maintain the confidentiality of the information that I gather. I do not think there is any potential to cause harm to anybody by this research. Clear account of purpose and use of findings would be provided to the organisation wherever asked for.
Time and Cost Constraints in Research Studies
Due to constraints on time and cost, this research has not used any direct sampling for collection of data. This research has used all data available from secondary sources. This study has quoted the results analysed in the past empirical studies to corroborate its findings on the subject. Further, this study has also used secondary data from the case studies available on the subject to strengthen its findings on the subject.
This research essay is mainly written from the secondary sources as primary sources like personal interview , posting of questionnaire , collection of data and interpretation of same involve a minimum of 3 to 4 months and also involves huge cost on the researcher.
Hence , this research study has used mainly secondary data as these kind of secondary information contains of data sources and other related info gathered by others and achieved in specific forms. These secondary sources will normally sourced from industrial studies, government statistical reports, syndicated information services, achieved data info and customary journals and books on the subject.
Secondary sources offer comparatively inexpensive and quick answers to many research questions and are always about the point of departure from primary research sources. (Stewart & Kamins 1993:1)
Basically this study is using data’s from governmental websites and published information which are available free and the cost (roughly 100 pound) is mainly on subscribing online libraries for collecting information from such libraries.
Findings
Energy experts are of the view that in the 21st century, traditional energy sources are shrinking slowly and intertwined issues of a steady increase in demand and constricted supply have compelled to new demand for “energy security” as both consumers and producers resist to manage costs, price, geopolitics and the environmental impacts
It is estimated that global energy demand is likely to exceed by over fifty percent by 2030 and up to eighty percent of this increased demand will be catered by fossil fuels. (IEA 2007b). (Lesage, Graaf & Westphal 2010:2).
LNG production on the global level had increased from 2.1% to 2,819.4 Bcm (99.5 Tcf) in the year 2005.. According to Bureau of Energy Statistics, Taiwan imported about 691,000 tonnes of LNG during 2010 as compared to 469,000 tonnes of LNG imported during 2009.
There are presently 32 liquefaction plants in operation and about 51 LNG reception terminals in the world. Further, there has been plan for in the pipeline for more than 70 LNG terminals and about 30 planned liquefaction expansions and plants all over the world.
EIA (Energy Information Agency) has predicted that U.S LNG imports would soar to 4.5 trillion cubic feet in 2030 from just 0.6 trillion cubic feet in 2005.
According to experts, there are adequate gas resources to last for at least seven decades from now where as it is estimated that current oil reserves will last for only 42 years from now.
According to experts from BG group, universal LNG production is set to increase from about”175m tonnes per annum in 2008 to 275 m by 2011.” However, LNG demand may surpass the supply between the years 2011 to 2015. (Ford 2009:51).
As per BG Group’s survey, in 2005 alone, about 12% of LNG supply contracts consisted of spot and short term contracts while 88% of LNG supply contracts were long term contracts. (Cohen 2006).
Majority of the experts is of the view that LNG spot contracts may increase to 15 to 30% of international LNG trade in the foreseeable future.
In the near future, spot contract for LNG is possible to soar due to freeing of market in Spain and Korea , accessibility of excess production facilities , the re-birth of the U.S LNG markets , the bulk orders given by new players like China and India and the availability of additional LNG transportation capacity. (IEA 2009:32).
According to IEO Energy Outlook 2010, the aggregate of natural gas consumption globally has increased by 44 % as of date. Further, it has been estimated by IEO that global consumption of natural gas is set to reach to 156 trillion cubic feet in 2035 from that of 108 trillion in 2007.IEO 2010 has estimated that natural gas consumption is likely to expand by a mean of 1.8% per annum from 2007 to 2020.
LNG stays as a major energy source both for electricity manufacturing and for industrial uses throughout the IEO projection phases. The international industrial sector vouched for forty percent of aggregate gas consumption in the year 2007 and is likely to maintain the same through 2035. (IEA WEO 2010).
LNG is being preferred fuel source in power manufacturing sector especially in the new generation capacities as it is having relative fuel efficiency, quick construction timeline, low emissions and lower capital outlays. The total LNG consumption for global power manufacturing stood at 33% in the year 2007 and is likely to increase to 36% through 2035. (IEA WEO 2010).
Consumption of LNG in non-OECD nations grows about 3 times surpassing consumption in OECD nations with increases of 0.6% per annum for OECD nations and 1.9% per annum for non-OECD nations from 2007 to 2035.
Due to this, non-OECD nations account for 78% of the aggregate of global increase in consumption of natural gas as the share of aggregate of global natural gas consumption of non-OECD nation’s increases to 59 % in 2035 from 50% in 2007. (IEA WEO 2010).
The lion’s share of estimated increase of global natural gas production is anticipated to happen in non-OECD nations, with the large chunk of increase emanating from the Middle East with an estimated increase of 16 trillion cubic feet between 2007 and 2035, Russia and other nations of non-OECD Eurasia and Europe accounts for 6 trillion cubic feet and Africa accounts for 7 trillion cubic feet as depicted in the following chart. (IEA WEO 2010).
Further, Qatar and Iran has the capacity to increase their natural gas production by an aggregate of 12 trillion cubic feet which is about 25% of the total increases in the global gas production. (IEA WEO 2010).
According to US Federal Energy Regulatory Commission, present natural gas supplies are enough but establishment of new LNG facilities will be required by 2011 else there will be deficits. (IEA WEO 2010).
The global LNG trade will in turn is expected to increase with massive increase in exports from Australia , Qatar and other nations like Trinidad while nations like China , India and USA is expected to import poignant quantities in the near future. Globalization of LNG is becoming more competitive thereby exerting pressure on companies to plan for efficiencies and cost savings.
The global LNG markets have also observed the emergence of many new operators with no or little experience in LNG logistics, pushed primarily by arbitrage and profitability of the industry. There is a surge in the both spot and short –term contracts in LNG trade recently.
Due to strict adherence of codes, standards and guidelines applying to LNG, LNG industry is being considered as one of the safest fuel in meeting the global demand in the near future
LNG globalisation can be symbolised from the orders for methane tankers which are soaring, and it is predicted that aggregate fleet of tanker is likely to increase by fifty-six percent in the next five years and is anticipated to soar by 7.5% per annum until 2015.
In the near future, LNG market is likely to be governed by national oil companies like PETRONAS (Malaysia), Pertamina (Indonesia), Sonatrach (Algeria) and Qatar Petroleum.
In the year 2009, all the European LNG terminals were operating at their full capacity level, and this demonstrates that there is ever increasing demand for LNG in the European markets.
According to Chevron Global Gas, globalization of LNG is materializing as Henry Hub prices have turned to be the yardstick not only for Europe but also for spot LNG consignments around the globe as of today.
In view of the above, this research study concludes that globalization of LNG is inevitable in the near future.
Analysis & Discussion
About sixty four million American families use natural gas as fuel for their homes. If LNG supply is disrupted, it may affect the livelihood of millions of Americans.
The demand for LNG appears destined to increase inevitably as major consuming nations like U.K, U.S.A and Canada which actually witness irreversible slowdowns in their gas production.
Under “peakshaving “ process , utility companies will liquefy natural gas when it is available in excess in the market at off-peak prices, and then it will convert back to the gaseous form when there are peak demand periods. (Sakmar 2009:2).
CCGT technology has many advantages like with markedly higher operating efficiencies and lower capital costs, which have offered natural gas as a viable alternative over the coal which have higher emission features. (Tusiani & Shearer 2007:2).
Out of aggregate of global natural gas consumption, LNG shares of about 6.6%. (Tusiani & Shearer 2007:2). The global fleet of LNG ships was estimated about 21,000 million deadweight tons symbolising an eight percent increase in just 3 years as of 2007 and this was about 2.4% of the aggregate of the global fleet. This will probably kindle the growth for LNG in the North American market. In the coming two decades
About 26% of the main energy consumption of the twenty-seven member nations of European Union originated from natural gas thereby making it a very significant fuel for not only today but also for future. If new sources of LNG supplies are not identified, or if LNG is used as an alternative fuel for other energy sources, then there may be a gap in the supply of LNG in Europe in the near future.
If no further sources of LNG are to be identified, Europe could witness a disparity in supply of LNG as demand is expected to go up from 2011 onwards.
If adequate new sources of LNG supply are not identified or if LNG is being used as an alternative for other energy sources, then Europe may witness a shortfall in supply of LNG in the near future.
- It is estimated that as of now and 2020 , additional LNG supplies of about 120 to 150 Gcm have to be developed from long distant resources to meet the demand projection made by IEA and EIA.
- Europe received about 47% of its LNG supplies from distant resources during 2009 and this is estimated to increase to more than seventy percent during 2020. (IEA WEO 2010).
- Europe’s future policy to make sure security of supplies of energy will be more reliant on the increasing dependence on LNG from more distant sources. (IEA WEO 2010).
- Europe may witness a disparity in LNG demand and supply commencing as early as 2011 or 2012. (Likvern 2010).
According to Cambridge Energy Research Associates (CERA), Asia/Pacific region has accounted for import of about 102 million tons of LNG.
It is to be observed that Japan is the globe’s largest LNG consumer as it imported in 2002 about 54.7 million tons of LNG.
The global economic recession may act as a barrier for the growth plans of LNG industry as the economic slump is liable to end in a reduced aggregate of energy consumption and hence its brunt on the global LNG trade stays ambiguous.
Due to worldwide economic downturn, the prices of LNG in the globe’s two supreme market viz South Korea and Japan have fallen down severely over the second half of 2009 from $ 20 per million Btu (British Thermal Units) in August 2009 to $ 9.15 /m Btu by December 2009”. (Ford 2009:51).
There has been steady increase in growth of LNG portfolios worldwide and thanks to the deregulation of LNG import markets both in USA and Europe which facilitated the recent materialization of a modified, “integrated” LNG approach.
LNG markets in Japan prolong to function under “take-or- pay” contracts with administered utility as purchasers while LNG market in European and USA seem to be footing on the fundamentals of tolling-style structures whereby providers of LNG can have access to the freed market for LNG by agreeing to pay an operating fee to the operators of regassification terminal and still can have the right to gas at the other end of the terminal.
As a substitute to the tolling understanding, some LNG integrated partners are subscribing equity ownership in the new LNG regassification terminals.
It is estimated that shale gas will account for 26% of total natural gas production in U.S in 2035. According to IEO2010 estimates, Canada’s shale gas, tight gas and coalbed methane gas will account for 63% and China will account for 56% of their aggregate domestic gas production in 2035.
As per IEO2010, LNG will account for an increasing share of global natural gas trade. Further, the global natural gas liquefaction capacity is likely to increase by 2 to 4 times and to 19 trillion cubic feet in 2035 from just 8 trillion cubic feet in 2007. (IEA WEO 2010).
As far as liquefaction is concerned , the majority of the increase is likely to be developed from Australia , Middle East , where a massive amount of new liquefaction facilities are in pipeline of many of which is expected to start their operation within the next decade. (IEA WEO 2010).
To cater the global demand, the global gas production will be required to be increased to 50 trillion between 2007 and 2035. Major portion of this increase is expected to emanate from non-OECD nations, of which about 89% increase is expected to happen between 2007 and 2035.
Thus, the production of non-OECD natural gas increases by a mean of 1.8 percent per annum to 111 trillion cubic feet in 2035 from just 67 trillion cubic feet in 2007 whereas gas production in OECD nations is likely to increase by just 0.4 % per annum to 45 trillion cubic feet in 2035 from that of 40 trillion cubic feet in 2007.
Australia is tapping a new source of Coal Seam Gas and will export the same as LNG around the world in the near future. Thus , Coal Seam Gas has not only established enough to equalize declining gas reserves somewhere in Australia but also gas reserves are great in numbers which may result in exporting of surplus gas in the guise of LNG.
There has been tremendous development in the LNG commerce in the recent years which has raised questions like whether it is possible to trade LNG as a global commodity. A variety of factors have to happen for this which includes the following:
- An enhanced flow and patterns of global commerce in LNG.
- The creation of single and uniform price around the globe.
- Possibility of liquid trading.
- Flexibility in supply of LNG (Stoppard 2008).
Out of the above, the creation of a uniform and single price for LNG will be most difficult to accomplish due to variances in the international pricing pattern of natural gas globally due to distance involved and transportation costs.
As the LNG liquefaction train needs substantial investment, LNG suppliers enter with a pricing model that offers a floor price. For suppliers, this floor price restricts the decline in the LNG price to some degree even if the oil price prolong to decline continuously. By contrast, purchasers are safeguarded by a price cap which limits LNG price increases when oil price soar above some level. (IEA Nat.Gas Mkt Review 2006).
According to report in Gulf times in its August issue of 2009 ,in the last 5 years , LNG has become a poignant ingredient of the international energy supply mix and recent investigations reveal that LNG demand growth will stay robust with international LNG demand is estimated to swell by 10% per annum through 2015.
According to Lehman Bros LNG report, by 2011, new projects in Qatar will be the major players for global LNG growth and are anticipated to add about 5.4 Bcf/d of additional LNG by the end of the year 2011. Expansion of LNG handling facilities by Qatar will facilitate Qatar to continue to reap benefits of its LNG resources and to expand its client base.
In the Asian market, Qatar has emerged as a largest single supplier and if additional handling facilities are added, then it will make the Qatar to expand its exports to gas starving nations around the globe. According to Credit Suisse report, Qatar has a locational advantage as it is equidistant between Asia/pacific and Atlantic markets in shipping terms. This geographical location advantage will facilitate Qatar.
As per CERA Insight August 2008 report, when there is a lower demand for LNG due to storage restrictions, U.S will enter into market and will buy the LNG at an advantageous price. However, of late, convergences of factors have made LNG floating storage as a viable solution.
This has resulted in the excess capacity of shipping capacity which made the charter rates to fall and with the enhanced regassification quantum in major traded markets like U.S.A and U.K.
Further, the planned LNG Storage Hub in Dubai which will be the first of its kind in the globe, which will offer more flexibility to the global LNG markets when it will become functional in the year 2011. The proposed Dubai storage will offer an aggregate storage capacity starting from 40 to 65 billion cubic feet (Bcf) and will give clients the capacity to trade, store and pre plan supplies of LNG. (Sakmar & Kendall 2009: 9).
The Qatar’s talent to offer both market flexibility and supply and the permutation of end –markets keen to pay premium prices augments Qatar’s status as the globe’s major LNG supplier.
Conclusion
Ever increasing oil prices, climate change, ever escalating aggregate energy requirements and fuel switching are all features leading to the escalation in international demand for the LNG and the natural gas. As of date, about 25% of primary energy global demand is being catered by LNG.
International fuel demand has increased at c2% pa. Traditionally, global gas demand has increased at 2.5% per annum. Thus, both aggregate gas and energy demand are anticipated to grow at analogues magnitude in the long-run.
Within the international gas market, two premises stand-out. About 10% per annum demand growth in Asia-Pacific region which is ranked as higher –than-average and other being 7% per annum growth of international LNG demand.
Both movement are anticipated to keep on higher-than-average tempos, despite the fact that growth in Asia-Pacific demand for gas is about to stand at 5% per annum and growth in LNG consumption is about to grow to 10%. Further, demand from India, China and Thailand is set to grow at an abnormal rates.
A sudden upsurge in the global demand for LNG will be pushed by imports by North America which could probably equal the total growth in the rest of the globe.
In the forthcoming decades, the world is in a position to meet the confronts of generating more energy to cater the increasing demands while at the same juncture restricting and minimizing greenhouse gas emissions. This activism will foster unparalleled confronts but also exceptional new vistas, particularly in the global LNG markets.
The global demand for LNG is set to increase many fold in the near future as it is one of the cleanest burning fossil fuel. Thus, unprecedented global market in LNG will create a chronological specific regional markets to turn to be more unique pricing and integrated and more flexible contract terms.
Though, the environmental and safety issues may restrict LNG import viability in certain markets like U.S.A, LNG will thus turn as a significant constituent in the global energy supply mix. The vibrant of the embryonic global LNG market will no doubt turn to be the 21st Century’s fuel. (Sakmar & Kendall 2009:10).
With the fast development of North American and European markets coupled with development in Middle East and Atlantic Basin supply, LNG has become more of an international product. It is predicted that long term contracts for LNG will remain to continue but at the same juncture , short term contract and system contracting is expected to replace by the traditional ‘ destination contracting’ which will be more flexible in nature.
The Atlantic Basin pricing remain to be under arbitrage pricing which will interlink both European and the North Atlantic pricing whereas pricing in the Middle East will remain to be link both Atlantic basin and Asian pricing. Due to enormous supply, Qatar is likely to become the “Henry Hub” of the international LNG pricing. (Jensen 2005).
Recommendations
No doubt, LNG globalization is on the wheels and this research study make following recommendations for the same.
- According to IEO Energy Outlook 2010, global consumption of natural gas is set to reach to 156 trillion cubic feet in 2035 from that of 108 trillion in 2007. To cater this future demand, untapped gas reserves in Russia and Iran should be planned so that gap between demand and supply of LNG could be reduced.
- Presently about 12% of LNG supply contracts consisted of spot and short term contracts while 88% of LNG supply contracts were long term contracts. Thus, efforts should be made more on increasing the spot contracts of LNG so that producers will be benefited much and they can invest in new gas reserves to cater the future demand.
- The share of global LNG consumption in power manufacturing sector, industrial sector should be increased substantially.
- According to US Federal Energy Regulatory Commission, present natural gas supplies are enough but establishment of new LNG facilities will be required by 2011 else there will be deficits.
- Europe’s future policy to make sure security of supplies of energy will be more reliant on the increasing dependence on LNG from more distant sources.
- The global production of Shale gas, tight gas, Coal bed Methane gas, Coal Seam gas should be increased substantially to meet the future LNG demand.
- To cater the global demand, the global gas production will be required to be increased to 50 trillion between 2007 and 2035.
- There should be creation of a uniform and single price for LNG worldwide despite of the constraints like variances in the international pricing pattern of natural gas globally due to distance involved and transportation costs.
List of References
Alfadala H. E., Reklaitis GVR & El-Halwagi MM. (2009). Proceedings of the 1st Annual Gas Processing Symposium. New York: Elsevier.
Amineh Medhi & Yang Guang. (2010). The Globalisation of Energy: China and the European Union. New York: Brill.
Ariweriokuma, S. (2008) The Political Economy of Oil and Gas in Africa. The Case of Nigeria, New York: Taylor and Francis.
Barden Justine, Pepper William and Aggarwal Vineet. (2009) The Impact of High Oil Prices on Global and Regional Natural Gas and LNG Markets. The Energy Journal p 55-72.
Branch, A. E. (2007) Element of Shipping. New York: Taylor and Francis.
Cohen Dave. (2006). LNG To The Rescue? Web.
Downey M. W., Morgan W. A. & Threet J. C. (2001). Petroleum Provinces of the Twenty-first Century. New York: AAPH.
Ford, N. (2009). LNG INDUSTRY SEEKS GROWTH DESPITE RECESSION. Middle East, (398), 50-54. Academic Search Premier Database. Web.
Gav Big. ( 2008). Australia: A Rising Source for LNG Exports Using Coal Seam Gas? Web.
Geman, Helyette. (2009). Commodities and Commodity Derivatives. Modelling and Pricing. New York: John Wiley and Sons.
Goldthau Andreas & Witte Jan Martin. (2010).Global Energy Governance: the New Rules of the Game. New York: Brookings Institution Press.
IEA WEO (2010) The World Energy Outlook 2010 –Gas. Web.
Katulak Frank. (2005). LNG – A Safe Alternative Fuel. Web.
Lesage D., Graff T. V. D. & Westphal K. (2010). Global Energy Governance in a Multipolar World. New York: Ashgate Publishing.
Likvern Rune. (2010). Europe and Natural Gas- Are Tough Choices Ahead? Web.
LNG Unlimited (2010). China to take Big Bite of LNG in the Year of Tiger. Web.
LNG Unlimited (2010) Taiwan LNG Imports Surge. Web.
LNG Unlimited (2010) BG Pumps Up the Australian Volume. Web.
LNG Unlimited (2010) MOL Vessels Find a Home. Web.
Michael D., Tusiani and Shearer Gordon. (2007). LNG: A Nontechnical Guide. New York: Pennwell Books.
Pyzdek. (2004). The Six Sigma Project Planner. New York: Tata McGraw-Hill.
Robson, Colin. (2002). Real World Research. New York: Wiley Blackwell.
Saunders M., Thornhill A. & Lewis P. (2006). Research Methods for Business Students. New York: Prentice Hall.
Stewart D. A. & Kamins, M. A. (1993). Secondary Research: Information Sources and Methods. New York: Sage Publications.
Tusiani, M. D. & Shearer G. (2007) LNG: A Non-technical Guide, London: Pennwell Books.
U.S Federal Transit Administration. (1998).Guidebook for Evaluating, Selecting and Implementing Fuel Choices. New York: TRB
Van De, WestPhal Kristen. (2010). Global Energy Governance in a Multipolar World. New York: Ashgate Publishing Ltd.
Whitney G., Behrens C. E., Glover C. & Hederman W. F. (2009). Energy: Natural Gas. New York: The Capital Net Inc.
Wright, T. (2006). LNG spill safety: Don’t let wool be pulled over one’s eyes. Hydrocarbon Processing, 85(3), 11. Academic Search Premier Database. Web.
LNGFACTS. (2010) About LNG. Web .
Energy. (2010). LNG-Ministry of Energy and Energy Affairs of Government of Trinidad and Tobago. Web.