Introduction
Governments work hard to provide high quality, affordable and timely health care services to citizens. Health practitioners are expected to use the resources offered by governments to protect, treat and prevent the spread of diseases. Some interventions are used to manage chronic diseases and help patients alleviate pain and live longer (Brajovic, Piazza‐Hepp, Swartz, & Dal Pan, 2012). However, some health facilities and practitioners do not use the resources allocated to them properly. Cases of misuse of health care funds, tools and equipment are rampant in countries where this sector is not supervised properly (Armijo‐Olivo, Stiles, Hagen, Biondo, & Cummings, 2012). In addition, a lot of time is wasted on irrelevant issues yet some patients may benefit if they are attended to on time. It is necessary for governments to put measures that require health care facilities to record and present their performance records. This essay presents an analysis of the data collected from Al Amal Hospital to determine its effectiveness in offering quality healthcare services to patients.
Background
Al Amal Hospital is a Qatar –based health care facility that offers medical services to cancer patients. The hospital is designed to diagnose and provide treatment related to chemotherapy, surgery, radiotherapy and social-psychological support to patients suffering from cancer. The facility’s collaboration with some international university students makes it a famous cancer management and treatment centre in Qatar. In addition, it offers other non-cancer medical services to the locals and foreigners from other countries. The 300-bed general hospital introduced a compulsory incident reporting system in 2009 and a falls prevention programme in 2011 to monitor its performance and determine the best alternatives for improving the quality of services offered to patients.
Graphing the Data
Line charts
The data was analysed using a control chart format and the results obtained posted on a graph. First, the annual results were tabulated, recorded and presented in graphs because they are easy to interpret. In addition, it is easy to monitor the changes in data over the years. The data will be analysed using line charts because of the following reasons. The survey involves a study of three variables (number of falls, discharges and occupied bed days) over a long period of time. It was conducted over a 3 years period and all the data is supposed to be reflected in the analysis. In addition, the researcher was interested in examining how these variables changed with time. It is easy to identify the intervals between the highest and lowest levels of the data collected. Qualitative analysis involves using data collected from the field and translating it into meaningful concepts (Fayers, & Machin, 2013). Secondly, line charts are easy and simple to interpret and identify areas that have significant changes. For instance, the number of falls record in 2009, 2010 and 2011 can be interpreted by looking at the line charts. A high frequency is shown by an upward movement of the line chart while a downward move means that the frequency has reduced. In addition, a flat line shows that there is no change in the data collected over the period indicated in the chart. However, the use of line charts is limited to a few variables. Data containing more than five variables may confuse audiences because of the interactions of the sequences of frequencies (Basch, 2014). Line charts should be used to analyse data that does not have more than five variables. Secondly, some people are colour blind and cannot differentiate or track a variable presented in a line chart. The use of coloured lines to differentiate variables means that this data analysis technique cannot be used as a universal system of presenting research findings.
2009
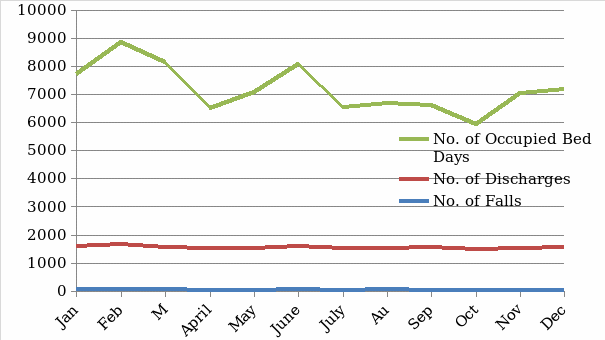
The incident reporting system was introduced in 2009 to enable the hospital collect data of the necessary happenings. The graph below shows the data collected between January and December 2009. The average number of falls for the 12 months was 46 individuals per month while that of discharge and bed occupants were 1501 and 5640 respectively. The median is 44.4, 1495.5 and 5515 respectively. This data means that the number of discharges and falls for the remained unchanged. However, the data for the number of occupied bed days reduced.
Therefore, there were no significant changes in the number of discharges and falls and this means that the health care facility did not introduce any changes to alleviate these problems. The number of occupied bed days reduced and this means that patients were either dying or being discharged from the hospital. However, it is evident that most patients may have died because cancer is a killer disease. In addition, most people seek treatment when this disease is in an advanced stage. Therefore, it becomes difficult to treat it. On the other hand, the 2009 data shows a slight improvement in the number of falls and discharges. Most public facilities do not have incidence or performance reporting systems and this means that people do not get good services from them. Laxity in the public sector is the chief reason most facilities perform poorly and expose the health of individuals to risks. The 2009 data collected shows serious flaws in the provision of health care services to patients. These results portrayed health practitioners as lazy people who do not pay attention to their job. On the other hand, it is true to argue that lack of motivation of public servants lowers their morale and discourages them from performing their work with enthusiasm (Romano, & Stafford, 2011).
Most patients get improved health care services and nurses pay attention to their needs when there is a performance evaluation system in health care facilities (Manary, Boulding, Staelin, & Glickman, 2013). The data may imply that there is improved home-based care and that is why most patients are not admitted to the hospital. They visit it for checkups and then go back to their homes. Lastly, it can be argued that the use of modern technology and an increase in the number of students pursuing nursing reduces the work of nurses as students help them in completing simple tasks on time (Korenstein, Falk, Howell, Bishop, & Keyhani, 2012). Therefore, nurses have adequate time to attend to the needs of patients. The fall prevention programme had not been introduced and this may be the reason this variable did not register significant changes. In addition, the compulsory reporting system may not have been implemented and that is why the 2009 data does not show significant variations between January and December. This information is shown in the graph below.

2010
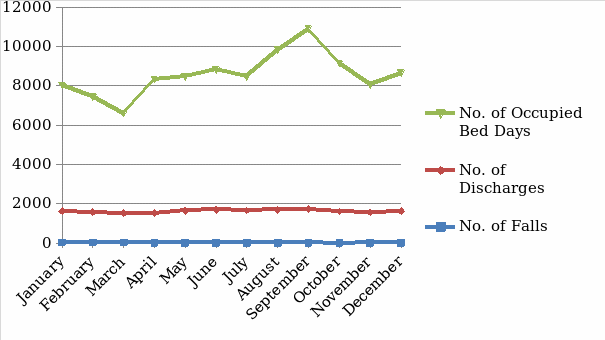
The variables for the data collected in 2010 had different characteristics. The introduction of compulsory reporting in 2009 may have had an impact on the number of occupied bed days. According to the data collected, there was a significant decline in the number of occupied beds at the beginning of 2010. The trend had been reported since late 2009 and this means that the hospital staff may have started paying attention to their performance. The 2010 data shows that the hospital recorded an average of 86, 1600 and 7408 in the number of falls, discharges and occupied bed days respectively. This means that there was an increase in the number of falls by an average of 40 patients. However, the number of discharged patients and beds that were occupied reduced by an average of 100 and 800 respectively. It can be argued that the number of falls did not decrease significantly because of the nature of the disease affecting most patients. Therefore, they were unable to support themselves and this explains why the statistic for this data remained unchanged. The hospital should consider exploring other alternatives like employing extra nurse trainees to support weak patients. On the other hand, the number of discharged patients remained almost constant throughout the year. This trend may be attributed to improved health care services and awareness programmes. More patients were discharged from the hospitals while others started visiting it as campaigns became more forceful and influenced those who had never sought medical help to visit the hospital. Lastly, the number of beds occupied registered mixed results that make it difficult to understand the behaviour exhibited by the graph below.

2011
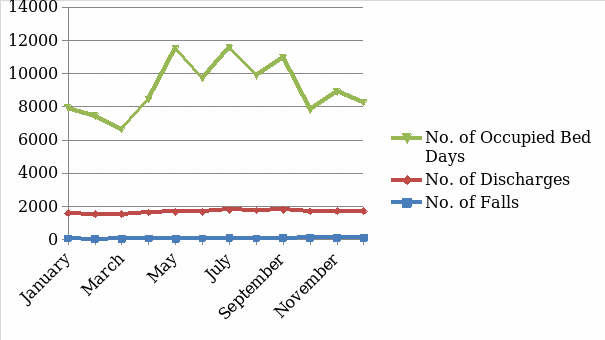
The 2011 data collected did not have a significant difference between the number of falls and discharges as those recorded in 2010 and 2009. The number of falls remained almost constant throughout the year and this means that this hospital may have taken steps to contain this problem. However, it can be argued that the rate decreased by an average of 70 and 500 patients for falls and days the hospital beds were occupied respectively compared to the data collected in 2010. However, the number of discharged patients remained almost equal in 2009, 2010 and 2011. Some hospitals admit patients who develop hospital infections and die and this explains why some of them were never discharged (Weiskopf, & Weng, 2013).
January registered a low number of occupied beds and the trend continued to become stronger until March. However, April and May recorded the highest number of occupied hospital beds compared to all other months since 2009. There were a higher number of beds occupied by patients from May to September although there were a steady decrease and increase of patients who were admitted to the hospital. October, November and December registered a decrease in this data. The high number of admissions may be attributed to health awareness campaigns.

Calculations
Incidence/Prevalence rate
This refers to the rate at which a variable accumulates or occurs in a population and it is arrived at as shown below:
- (46+88+17)/ (300-12) =0.52
- Incidence rate for number of discharges (1501+1600+1604)/ (300-12) = 16
- Incidence rate for number of occupied bed days (5640+7408+6933)/ (300-12) = 69.4
The statistics above show that the number of falls is lower than that of other variables. This means that the hospital has reduced the number of falls due to the introduction of a compulsory incident reporting system. The data collected by the researcher in 2009 did not help the hospital to address this issue and manage it properly. This is a major departure from the ±3 standard deviation. However, the hospital introduced a falls prevention programme in 2011 and this may have contributed to a decrease in the number of patients that fell during that year. The number of occupied bed days decreases and later remained constant during 2011 because fewer patients fell and thus there was no need to admit those who did not fall. However, a similar result was not reported in the previous years (2009 and 2010) because the hospital did not have fall prevention programmes.
Case fatality
This refers to the number of individuals who succumb to cancer in the hospital (Purnell, 2012). It is not possible to estimate the case fatality rate in these results because the researcher did not provide the data for hospital admissions. However, it can be concluded that not many people get out of this hospital once they are admitted. Cancer is a killer disease; therefore, the high number of patients discharged versus the small bed capacity and many occupied bed days may imply that most patients do not survive after being discharged.
Crude death rates
This refers to the number of individuals who succumb to various illnesses. The statistics representing cancer infections and spread in the study are an indication that the population of this region lacks proper health care facilities. Therefore, it is likely to have a higher crude rate of about three out of every 100 people.
Risk incidence proportion
The risk and incidence proportion is very close because of the lifestyle of the current generation. The statistics collected represents the health challenges that a large percentage of the population experience. Therefore, it is correct to argue that most people are likely to fall sick when there is a disease outbreak (Rick, Rowe, Hann, Sibbald, Reeves, Roland, & Bower, 2012).
Control Experiment
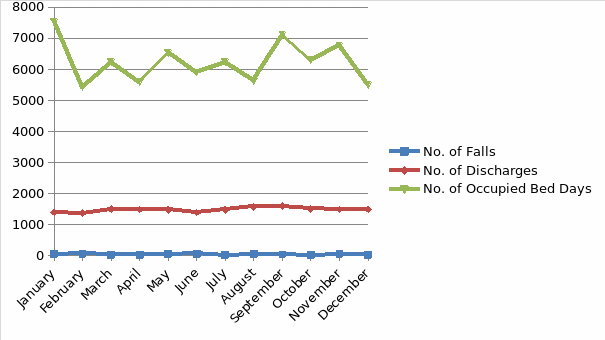
The line chart below shows a set of data used as control experiment. The data set is derived by calculating the average number of people in each category (number of falls, discharges and occupied bed days) before the introduction of the variables (compulsory incidence reporting system and fall prevention programs) that influence the results of the research. However, this control experiment involves the elimination of the compulsory incidence reporting system variable.

The data obtained from the control experiment shows that the compulsory incidence reporting system is vital in improving the performance of health care facilities. There number of falls and occupied bed days increased tremendously because of health care practitioners did not account for how they spend time at work. In addition, patients did not get proper and timely assistance and this led to increase in the number of falls and occupied bed days respectively.
Special Cause Variation
There are three main issues that may be responsible for the variations witnessed in the data collected in 2009, 2010 and 2011. First, public awareness campaigns may have motivated people to seek early diagnosis and medical services to manage their health conditions. This explains why the number of hospital falls increased between 2009 and 2011. Secondly, the introduction of a compulsory incidence reporting system exposed the dangers that patients suffer when they visit this health care facility. Lastly, the fall prevention programme reduced the number of occupied bed days because there was no need to stay in the hospital yet they were fit to walk to their homes.
References
Armijo‐Olivo, S., Stiles, C. R., Hagen, N. A., Biondo, P. D., & Cummings, G. G. (2012).
Assessment of study quality for systematic reviews: A comparison of the Cochrane Collaboration Risk of Bias Tool and the Effective Public Health Practice Project Quality Assessment Tool: methodological research. Journal of Evaluation in Clinical Practice, 18(1), 12-18.
Basch, E. (2014). New frontiers in patient-reported outcomes: adverse event reporting, comparative effectiveness, and quality assessment. Annual Review of Medicine, 65, 307- 317.
Brajovic, S., Piazza‐Hepp, T., Swartz, L., & Dal Pan, G. (2012). Quality assessment of spontaneous triggered adverse event reports received by the Food and Drug Administration. Pharmacoepidemiology and Drug Safety, 21(6), 565-570.
Fayers, P., & Machin, D. (2013). Quality Of Life: The Assessment, Analysis and Interpretation of Patient-Reported Outcomes. New York: John Wiley & Sons.
Korenstein, D., Falk, R., Howell, E. A., Bishop, T., & Keyhani, S. (2012). Overuse of health care services in the United States: an understudied problem. Archives of Internal Medicine, 172(2), 171-178.
Manary, M. P., Boulding, W., Staelin, R., & Glickman, S. W. (2013). The patient experience and health outcomes. New England Journal of Medicine, 368(3), 201-203.
Purnell, L. D. (2012). Transcultural Health Care: A Culturally Competent Approach. Philadelphia: F. A. Davis.
Rick, J., Rowe, K., Hann, M., Sibbald, B., Reeves, D., Roland, M., & Bower, P. (2012).
Psychometric properties of the patient assessment of chronic illness care measure: acceptability, reliability and validity in United Kingdom patients with long-term conditions. BMC Health Services Research, 12(1), 293.
Romano, M. J., & Stafford, R. S. (2011). Electronic health records and clinical decision support systems: impact on national ambulatory care quality. Archives of Internal Medicine, 171(10), 897-903.
Weiskopf, N. G., & Weng, C. (2013). Methods and dimensions of electronic health record data quality assessment: enabling reuse for clinical research. Journal of the American Medical Informatics Association, 20(1), 144-151.