Introduction
Generally, the market for housing is categorized at the regional and national levels. The two providers tend to relate and consider the rate each use in terms of pricing and average square footage. It, therefore, requires real estate managers to conduct proper analysis to identify the prevailing charges in the sector. To determine the significant relationship in the industry, data containing the name of the state, county, region, house listing price, cost per square foot, and the square footage.
Purpose
The project’s purposes are to analyze housing sales prices in a local region in the United States and determine if they are higher than that of the set standard housing price of the national market. The project addresses this claim (hypothesis) by first carrying out a statistical test of means of both the local housing sales market and the national market price. This will be archived through a test statistics T-test on the two means: the local housing sales market price and the national market price. Additionally, the project will use a simple comparison method by getting summary statistics of the local housing sales market price compared to that of the national market price. After that, the conclusion will be drawn based on the findings on whether to reject or accept the null hypothesis.
A random sample represents a group or population in which each item in the representation has an equal chance of being chosen (Tamhane & Gou, 2018). Random samples are meant to eliminate biasness in the population depiction. On the other hand, a Hypothesis is a statistical claim or assumption where an analyst tests those assumptions (claim) regarding a population parameter that is valid.
Sample Size
The main focus of the statistical analysis is to evaluate and determine if there is a significant difference between the housing issue in the region and those in the national market. A random sample of size 100 houses picked from various counties will be used to establish the findings, after which a general conclusion will be deduced concerning the population under study. The sub-set of the population contains state, county, region, house listing price (HLP), cost per square footage (CSF), and square footage (SF). In the research, the means to be analyzed are average prices and the cost per square footage.
The project subjects’ samples from the housing sales market price data of size 100 are chosen at random (each sample has an equal probability of being sampled) to minimize type one error in the project. The sampled data has an appropriate sample size, and the process of extraction involves randomization. To very further the condition of the data, I need to confirm if it is normally distributed to ensure it meets the necessary conditions for the analysis.
The samples include explanatory variables such as State, County, Region, house listing price, cost per square footage, and square footage. The main focus will be to establish if there is variation between the house listing prices and the cost per square footage in the region and national market. The state and county variables will not be included in the analysis as part of the population parameter.
Questions and Type of Tests
Hypotheses
To test the hypothesis, the project employs paired T-test statistics. Population parameters in the project based on the samples are the Housing listing price and square footage of homes under the analysis. A hypothesis is an unproved claim or judgment that is not tested and proven true or false. The test aims to confirm the claim if it is true or otherwise.
In this project, the Null hypothesis is that the local housing sales market’s mean price is higher than that of the National housing market sales price. However, the alternative hypothesis is that the mean market price of local housing price is below or equal to the national housing market price.
In the selected sample, the following are the hypothesized claims:
- Mean housing listing price, mean cost per square footage, and mean square footage are greater than that of the national market.
Where μ0 is the mean of the local housing market price, and μ1 is the mean of the national market price.
- Mean housing listing price, mean cost per square footage, and mean square footage are equal to or lower than that of the national market.
Test Statistics
The project’s statistical test inference will be the student’s test (t) of comparing the sampled mean to the national mean price. The test is defined as follows:

Xbar is the sample mean, s is the sample variance, and n is the sample size. The above formula will lead to the value of t critical, which is essential in decision-making. If the estimated confidence interval is outside the calculated range of the data, we will reject the Null Hypothesis; otherwise, the project advises that the null hypothesis is true. Moreover, suppose the estimated value is much higher or lower than the calculated data or set measure. In that case, the project advises rejecting the null hypothesis; this is true if the estimated value is in the range of -0.5 to +0.5 of the set measure of the national market price (Tamhane & Gou, 2018). A 1-tail test suggests that the calculated (estimated) value is either on the negative or positive side of the set mean.
Confidence Level
Throughout this project, a 95% level of significance is used; because a 95% level of significance describes 95% of the data values that contain the true actual mean of the population. It is effective based on this analysis which uses a large sample; thus, the interval range enhances precision.
Data Analysis
The following figure and table give a summary of statistics on the housing market price.
Table 1.
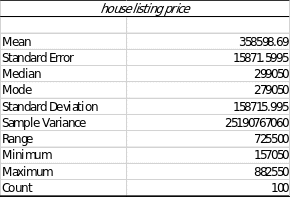
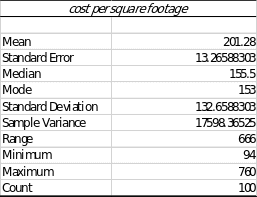
Table 2.
The table below shows the summary of the spread of the data in terms of mean, mode, median, sample variance, and standard deviation.
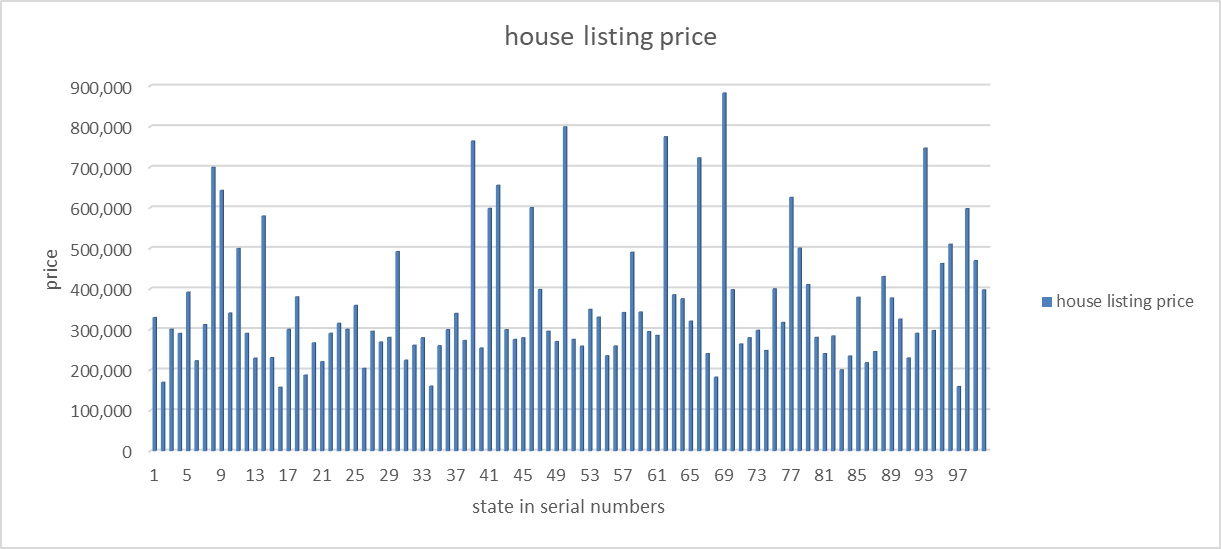
The following figure gives a bar graph of the house listing price.
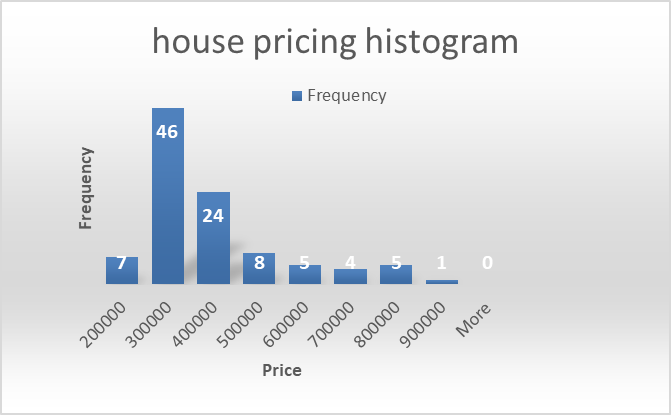
The histogram below summarizes the house listing price.
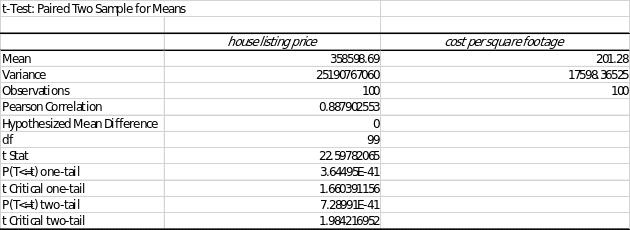
The following table gives test statistics on the house price listing, and the cost per square footage means
Table 3.
Interpretation
The appropriate test statistic used in this project is a t-test and based on the results in table 3 above, the t-value is 22.597, and the P-value of a one-tail test is found to be 3.644e^41. The p-value at the 95% significance level is much lesser than the critical (tabulated) value; that is, 0.05 is greater than 3.644e^41. Therefore, there is no significant difference between the house listing prices in the region and the ones provided in the national market.
Decision
Based on the analysis, the project advises rejecting the null hypothesis and accepting the alternative. Therefore, there is no statistical evidence to show that the local house listing price is greater than the national house listing price (Tamhane & Gou, 2018). In relation to the outcome of the research, it is evident that the house prices in the region are not higher than the ones in the national market average.
On the 2-tail test, The Hypothesis
- Mean housing listing price, mean cost per square footage, and mean square footage are greater than that of the national market.
Where μ0 is the mean of the local housing market price, and μ1 is the mean of the national market price.
The 95% level of significance was chosen, as it has been explained earlier. The population parameter under this test is the house listing price and the cost per square footage. The following table gives the summary of the output.
Table 4.
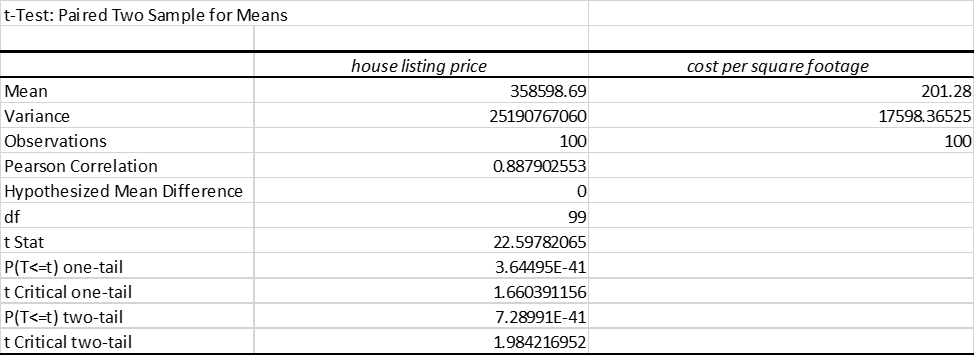
The normal condition has been met in the data; this is explained in the histogram about its relatively bell-shaped distribution. Also, the statistical mean, mode, and median are almost all equal. The 95% confidence interval range of values of the square footage of a home in the local region is shown in the table below.
Table 5.
Interpretation
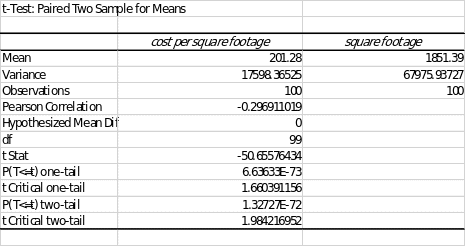
The t-calculated is found to be -50.65574 (negative). The one-tail t critical value is 1.660, and the two-tail critical region is 1.98. Since the t-calculated is greater than the p-value, we fail to reject the null hypothesis. And the project concludes that there is no statistical evidence to show that square housing footage is higher than the national market figures.
Table 6.
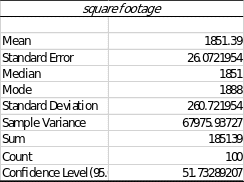
The project result is such that it is 95% sure that the square footage falls in the range between 50.00 to 52.00.
Conclusion
In conclusion, based on the research data analysis, both the house listing price and the square footage in the region and national market do not bear any statistical difference. Therefore, a real estate company can invest in either regional or national markets. The analysis included the critical variable, and based on the randomization of the sampled houses, the information provided is effective for investment decisions in the industry.
Reference
Tamhane, A. C., & Gou, J. (2018). Advances in p-value based multiple test procedures.Journal of Biopharmaceutical Statistics, 28(1), 10-27. Web.