Company Description
IBM is the world’s largest manufacturer of software and consulting services. The holding headquarters is located in the US in the state of New York in the city of Armonk. IBM has become a giant in the supply of IT services in the US and the world. However, the company is over 100 years old and has a rich history (IBM, 2022a). IBM has comprehensive experience in introducing innovative technologies in the world. For 26 years, IBM has been the world leader in US patents, six IBM employees have been Nobel laureates, and IBM engineers have developed countless unique products and services. An extensive track record includes developments in the field of analytics, artificial intelligence, blockchain, security, cloud technologies, and much more. It is noteworthy that, due to several mergers and acquisitions, the company’s production facilities are currently located in the USA and China (Moore, n.d.). This paper will focus on IBM’s activities in these two countries, emphasizing the impact of macroeconomic indicators, monetary, fiscal, and foreign trade policies, and a previous analysis of the current market structure.
Market Structure
IBM has a global presence, operating in about 170 countries across a broad geographical distribution of income. Global Markets manages IBM’s global presence by working closely with dedicated operating units worldwide to serve customers locally (IBM, 2022b). These regional offices have Account Managers who lead integrated teams of consultants, solution specialists, and supply chain professionals to enable customers to grow and innovate. IBM has a differentiated approach to selling its products and services: from local retail consumers to corporate orders up to the state level. At the same time, product licenses are distributed in complex solutions and individual units.
IBM ranks third in the industry by capitalization, right behind Cisco and Accenture, which IBM loses to in terms of significant multiples. Slightly lower in capitalization are ServiceNow and Square, against which IBM, on the contrary, looks advantageous (Gartner, 2022). A cursory financial analysis reveals that liquidity ratios are almost twice as high as those of the nearest competitors. The debt is several times higher than the equity, indicating high leverage. To remedy the situation, IBM abandoned the share buyback program for the period 2020-2021. Profitability indicators also leave much to be desired, although, against the background of competitors with a smaller capitalization, IBM looks better. The fact that IBM has been raising dividends for many years in a row increases the investment attractiveness of the company, and, according to the dividend policy, is not going to stop, despite a significant drop in revenue in 2021 (Macrotrends, 2022; NASDAQ, 2022). Now IBM is on the cusp of the transformation they have been aiming for years, transforming into cloud services and AI companies. They changed management, spent billions on investments, and restructured the company to do this.
The emphasis on this development direction depends on many external factors, including the company’s most influential countries in terms of sales and production: the USA and China. Economic, legal, and political determinants will be discussed below, but in addition to them, the following should be considered. Firstly, against the backdrop of a heated geopolitical situation in the east of Europe, global business is experiencing a particular crisis, especially regarding energy resources and supply chain logistics (Jayanti, 2022). Second, the impact of the pandemic is particularly acute in China, where Lokduan politics are among the toughest in the world (Pei et al., 2022). Finally, the technological factor remains the most important, tied to attracting highly qualified specialists and the availability of affordable equipment and specific materials for their production. In the latter case, an important role is played by the environmental and political situation around Taiwan, where the production of infrastructure-critical semiconductors is concentrated (Shattuck, 2021). Dynamics in the designated areas of human activity directly affect the success of IBM in the global market.
Macroeconomic Indicators
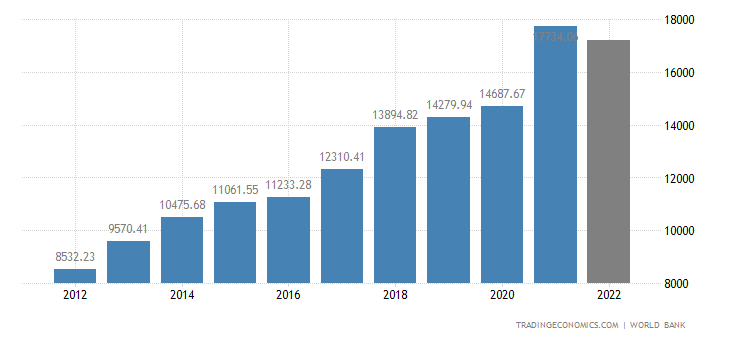
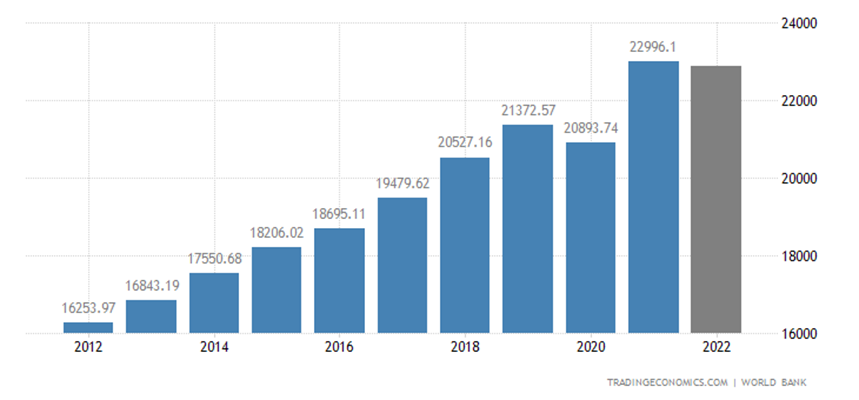
Macroeconomic factors in the countries of production and the most significant sales of IBM products in the US and China determine the operating and financial activities of the company. Correlation analysis in the dynamics of the last five years shows a surge in GDP in 2021 after a troubled 2020, followed by a negative adjustment in 2022, as can be seen in Figures 1 and 2. Due to tighter policies, China better weathered the pandemic crisis in 2020, even maintaining the growth rate of this indicator, in contrast to the United States. A similar jump was observed in 2018, including revenue growth at IBM against the background of a stable percentage decrease in the years earlier and later. The company’s sales and net revenue have been steadily declining for a decade, and the current level is only half of what it was in 2012-2014 (Macrotrends, 2022). At the same time, the GDP indicator in the selected countries grew steadily without falling, except for the mentioned 2020.
As a result, we can conclude that there is no correlation between these indicators, and the impact of the macroeconomic success of rapidly developing countries does not positively affect the company’s revenue. The fall is due more to internal processes and the peculiarity of the rapidly changing market. IBM’s sales are falling as an outdated technology business is holding back its efforts to regain growth through its cloud division (Cortada, 2019). When looking at the organization’s differentiated revenue performance across operating sectors, one can only speak of success in cloud computing and global services (Coyne et al., 2018). Sharpened by a long history of stationary computer technology, IBM does not adapt well to new conditions, which is also reflected in gross profit and operating profit, indicating great opportunities for optimizing internal business processes (Macrotrends, 2022).

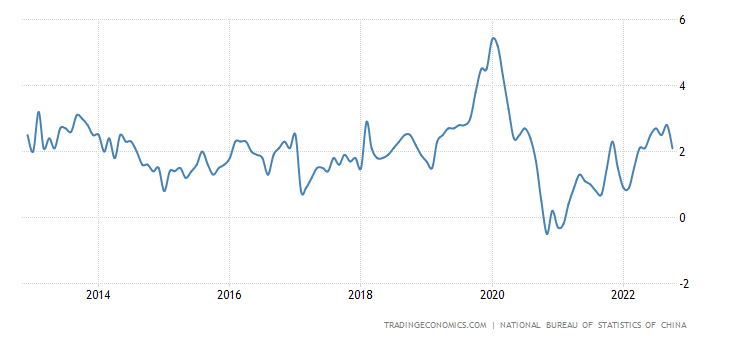
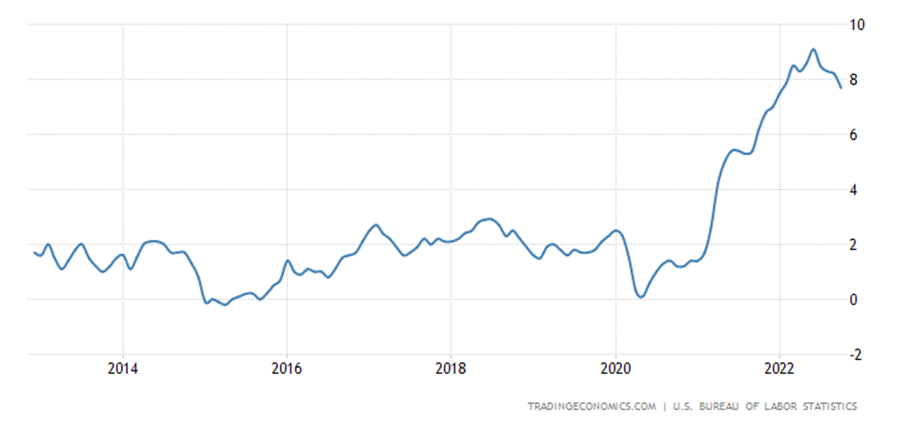
Analyzing inflation over the period of the last decade in these countries, one can also notice a rapid jump around 2020, which in the case of the United States is more shifted to 2021-2022. Figures 4 and 5 clearly show how much the state interfered in the processes of economic regulation, and how much the impact of the pandemic had consequences. For IBM, this dynamics is relatively indicative: the company’s business is diversified and the dynamics of changes in the value of monetary assets affect sales in different ways. Software implementation usually does not involve long delays between payment and receipt of the product, and, accordingly, inflation risks at a distance are minimal (Wandri & Hanafiah, 2022). On the other hand, physical production depends on logistics and the supply chain, which imposes unexpected costs and losses in this period. China dealt with record inflation in 2020 relatively quickly and successfully, which was reflected in the company’s losses to 2021 (Macrotrends, 2022). The United States survived the crisis without any inflationary shocks, which should not have affected this sales and production market for IBM. However, further dynamics, most likely dictated by the shortage of energy resources in the global market and a significantly increased price for them, does not carry optimistic forecasts for the company.
First, IBM is highly dependent on the consumption of this kind of resources due to costly production, which, moreover, must constantly undergo significant changes and adaptation to modern technology market requirements. Secondly, IBM loses in the adequacy of business planning due to the rapid growth of inflation in the United States, where the organization’s headquarters are located. High inflation leads to an overestimation of profits, however, in the long term, it gives an unreasonable assessment of solvency and financial stability (Yaya, 2018). In addition, capital investments also suffer, which naturally decrease, which, with a stable growth of dividends, which is a mandatory policy of the company, will affect the possibility of investing in R&D. China is also seeing growth, albeit less significant, which means IBM needs to restructure its enterprise even faster to remain competitive in the market. Revenue growth in 2022 may be driven in part by negative short-lived inflation in China. At the same time, the difference between the company’s current assets and liabilities fell below one for the first time in 2021, and a significant drop in long-term assets of more than 15% indicates that the organization is losing a lot of liquidity (Macrotrends, 2022). As a result, inflation has a greater impact on the company than GDP growth, which in turn is nominally overstated by the current price increase.
Monetary and Fiscal Policy
The interest rate of these countries has shown opposite dynamics over the past decade, which makes the analysis more complex concerning IBM. The downward direction in the case of China in Figure 6 is the result of the country’s rapid development as a whole, which served as a signal for many enterprises to locate their own production here (Lin & Wang, 2018). The US, on the contrary, held a constant level for a long time, resorting to minor changes in the period 2016-2020, but shows a significant increase from 2022, as seen in Figure 7. For IBM, this dynamics suggests that manufacturing in China is indeed profitable for the company in the long run due to such a loyal policy. At the same time, the USA guaranteed stability for many years, which is also a favorable factor for production and sales (Philippon, 2019). However, in comparison, the company’s revenue began to fall precisely starting in 2016, and such dynamics continued further, despite the easing of conditions in 2020 by the United States. As a result, we can note a significant correlation between the interest rate in the US and the operational activity of the IBM business, which again bears an unfavorable forecast for the short-term growth of the indicator to the level of China. The reorientation to the cloud and global services is dictated by the activities of R&D, which are concentrated mainly by the company in the USA; therefore, their development will require significant investments over time. Against the backdrop of the negative financial performance of the organization, it will need more long-term and short-term lending, which, with the current interest rate, has become much more unprofitable.
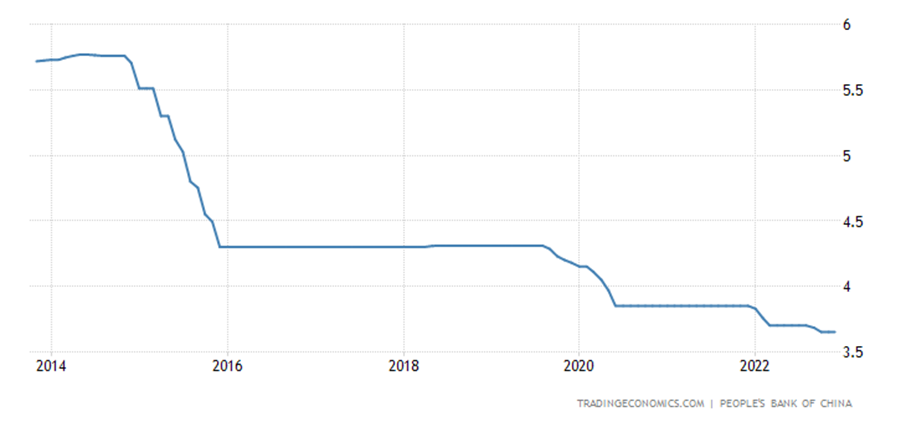
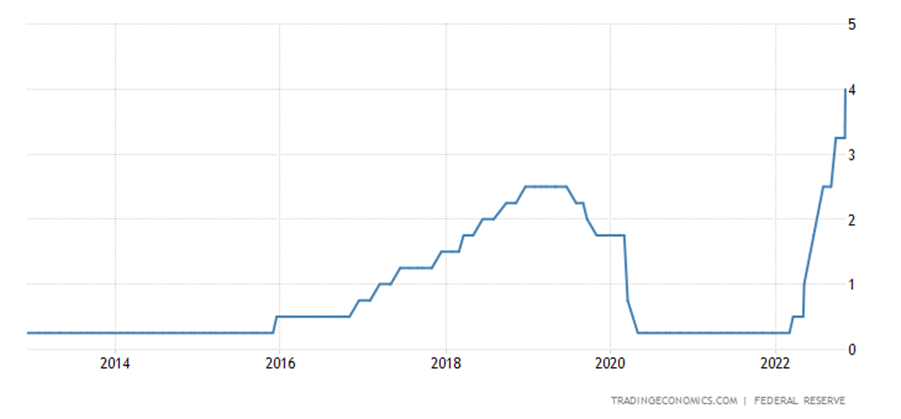
A simple mathematical forecast using trendline modeling shows that IBM will now be more profitable to relocate its R&D units to China, which is more stable in this regard. However, here the company may again need more initial capital resources for this step – assets, including long-term ones, are steadily falling, and new funds should be sought either from investors or in long-term lending. The second method is equally unprofitable due to the interest rate being equal at the moment in both countries. The first method is unrealistic since the current EPS indicators indicate the company’s inefficiency, which is unlikely to lead to a significant inflow of funds through the sale of shares. As a result, dependence on monetary and fiscal policy for IBM becomes critical within the current financial situation, and only competitive, relevant, and timely offerings in the technology market can fundamentally change the situation. However, achieving this with a more stable position of competitors, in the long run, will take much work. This thesis is also supported by the company’s cash flow dynamics from investing and financial activities. They show that the company already had long-term lending in 2019, with capital spending on property, plant, and equipment almost halving by 2020-2022 (Macrotrends, 2022). Although IBM’s long-term liabilities are declining, their pace is not comparable to the decline in assets.
Foreign Trade Police
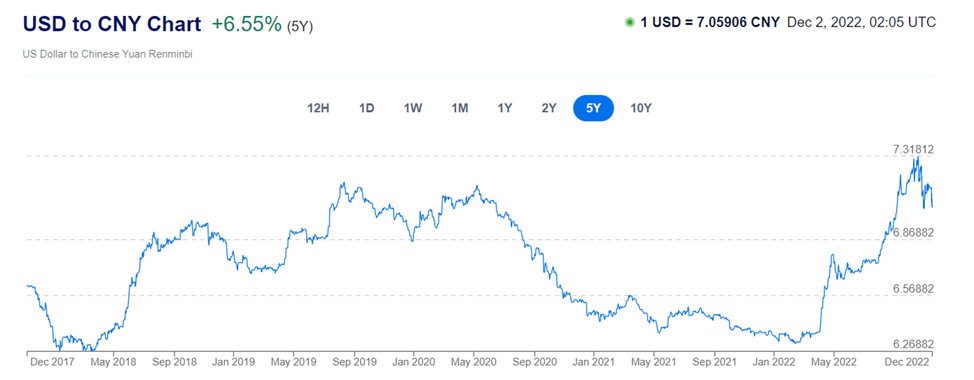
The five-year dynamics of the yuan exchange rate against the dollar has a corridor from 6 to 7.5 Chinese currency for 1 US dollar. Growth began around 2018 and continued into 2020, followed by a significant spike only at the end of 2022, as shown in Figure 8. This attitude plays a key role for IBM in the global technology market. Firstly, the company’s profits are converted into yuan to support production in this country, so a strong yuan is unfavorable for development. On the other hand, the diversification of the sales market by geographical factors has recently been gaining more global proportions, significantly going beyond the United States. By selling products in Asia, IBM benefits from the reverse conversion, which encourages investment in R&D. Compared to the dynamics of revenue, its growth is driven by a stronger dollar, which confirms the company’s dependence on the US currency to a greater extent than on the Chinese one. The weak yuan between 2018-2020 and 2022 was accompanied by a relative increase in company earnings (Macrotrends, 2022). Although the corridor for these currencies is relatively small, a certain degree of correlation still exists.
Secondly, until 2022, the interest rate in the US remained at a stable level, as discussed above; therefore, having received loans in the period of 2019, IBM, according to these indicators, won concerning these currencies. The surge in 2022 can be used with similar success, but the key rate in the US has already increased to the level of China, which significantly reduces the benefit. However, when relocating R&D units to Asia, IBM can benefit precisely from the difference in conversion – a weak yuan makes it possible to obtain relatively more capital in this particular country. In doing so, IBM could face many concomitant factors of a more stringent lockdown policy in China, slowing down production. Therefore, this step is associated with many risks, which is why the potential gain seems like a vague solution.
A strong dollar on the world stage, not only against the yuan, can be profitable in domestic sales but not in other regions. Although significant momentum in the growth of the US currency is observed only in the period of 2022, this is partly why the short-term growth of IBM’s revenue is possible, while these revenues from global services provide an opportunity to invest more in R&D, as a critical area for the organization’s development. The complicated geopolitical situation and the crisis of energy resources can expand production deep into the United States, making this step the most profitable in terms of long-term planning, but the only but important factor against it is a significant increase in inflation and interest rate in this country. IBM finds itself in a difficult financial situation, which is yet to be critical due to the presence of long-term assets well above liabilities. However, against the background of competitors, the situation is not in favor of the organization and can only be corrected through the long-term sustainable development of the most relevant technologies on the market.
References
Cortada, J. W. (2019). IBM: The Rise and Fall and Reinvention of a Global Icon. MIT Press.
Coyne, L., Dain, J., Forestier, E., Guaitani, P., Haas, R., Maestas, C. D. & Vollmar, C. (2018). IBM private, public, and hybrid cloud storage solutions. IBM Redbooks.
Gartner. (2022). IBM Competitors. Web.
IBM. (2022a). About us. Web.
IBM. (2022b). Consulting. Web.
Jayanti, S. (2022). Think the Energy Crisis Is Bad? Wait Until Next Winter. Time. Web.
Lin, J. Y., & Wang, X. (2018). Trump economics and China–US trade imbalances. Journal of Policy Modeling, 40(3), 579-600. Web.
Macrotrends. (2022). IBM Financial Statements 2009-2022 | IBM. Web.
Moore, J. (n.d.). IBM. Techtarget. Web.
NASDAQ. (2022). IBM Dividend History. Web.
Pei, J., de Vries, G., & Zhang, M. (2022). International trade and Covid‐19: City‐level evidence from China’s lockdown policy. Journal of Regional Science, 62(3), 670-695. Web.
Philippon, T. (2019). The great reversal: How America gave up on free markets. Harvard University Press.
Shattuck, T. J. (2021). Stuck in the Middle: Taiwan’s Semiconductor Industry, the US-China Tech Fight, and Cross-Strait Stability. Orbis, 65(1), 101-117. Web.
Trading Economics. (2022a). China GDP. Web.
Trading Economics. (2022b). USA GDP. Web.
Trading Economics. (2022c). China Inflation Rate. Web.
Trading Economics. (2022d). USA Inflation Rate. Web.
Trading Economics. (2022e). China Interest Rate. Web.
Trading Economics. (2022f). USA Interest Rate. Web.
Wandri, R., & Hanafiah, A. (2022). Analysis of Information Technology (IT) Goods Sales Patterns Using the FP-Growth Algorithm. IT Journal Research and Development, 6(2), 130-141. Web.
XE. (2022). 1 USD to CNY – Convert US Dollars to Chinese Yuan Renminbi. Web.
Yaya, O. S. (2018). Another look at the stationarity of inflation rates in OECD countries. Statistics in Transition. New Series, 19(3), 477-493.