The impact toughness of a material is the energy needed to sustain crack propagation. The higher the fracture toughness, the more the energy needed for a crack to grow. The impact toughness of a material is affected by test temperatures, state of stress, loading rate, and stress concentrations such as notches and cracks.
Introduction
The test consists in measuring the energy used to fracture a notched specimen being hit by the pendulum. At rest the pendulum is at a certain height with respect to the specimen, which corresponds to a certain potential energy. When released, the pendulum’s potential energy starts being transformed into kinetic energy. At the moment of the impact between pendulum and specimen, part of this potential energy is used to fracture the specimen. After the impact, the pendulum does not reach the same initial height. Accounting for the energy losses, the difference between final and initial height can be converted into the energy needed to fracture the specimen.
Objective
To evaluate the impact toughness and to identify the transition temperature range of low-carbon steel, aluminium, and brass.
NB: Specimen, apparatus and procedure can be found on lab manual.
Results
The data collected in the lab is shown in Table 1 and Table 2.
Table 1. Specimen dimensions (inches) for one specimen tested at room temperature
Table 2. Charpy impact toughness value (NM)
Data analysis
The energy absorbed to break the test specimen is known as the notch impact energy and can be calculated from the formula below.
Total fracture energy is given by:
E total = E fracture + E loss
Where:
- E total is the actual energy required to fracture a specimen.
- E fractured is the energy required to fracture the specimen without considering energy losses due to friction and wind.
- E loss is the energy loss due to friction and wind.
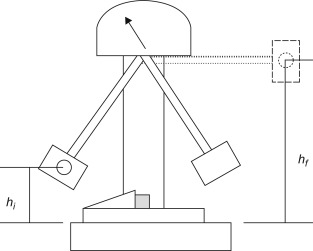
E fracture = mg (h0 – hf) and
E loss = mg (h0 –hl)
Where:
- m – Mass of the pendulum.
- g – Gravitational mass of acceleration.
- h0 – initial pendulum height.
- hf – pendulum final height after fracturing the specimen.
- hl – pendulum final height with no specimen.
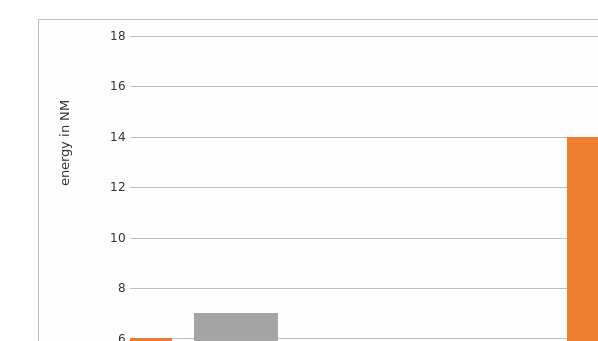
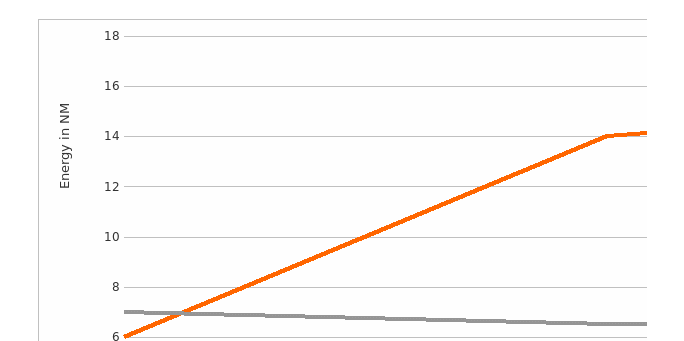
From the data obtained from the experiments, the graphs below can be plotted.
Discussion
Compare the Effect of the Temperature on the Impact Toughness of the Metals
Aluminum
The results show that the impact toughness was 5.0nm at 0℃. Upon increase temperature, the impact toughness reduced up to 4.5nm at 23℃. In further increase in temperature, the impact toughness increased up to 5.5nm at 75℃. In the Aluminum case condition, it is clear that there is a decrease in impact toughness upon an increase in temperature up to a certain point, and that is the room temperature. There is an increase in both impact toughness and temperature up to a boiling point from room temperature.
Steel
According to the results obtained, the impact toughness was 6.0nm at 0℃. There was an increase in impact toughness upon an increase in temperature up to 23℃. Upon an increase in temperature from 23℃ to 75℃, there is an increase in impact toughness up to 15.5nm. In steel case condition, it is clear that there is a rapid increase in impact toughness upon increasing temperature up to room temperature. From room temperature, there is a gradual increase in impact toughness up to a boiling point.
Brass
According to the results generated after the experiment, the impact of toughness was 7.0nm at 0℃. There is a decrease in impact toughness upon an increase in temperature up to 6.5nm at 23℃. Upon an increase in temperature from 23℃ to 75℃, the impact toughness is still 6.5nm. In the brass case, there is a decrease in impact toughness upon an increase in temperature up to room temperature. The impact toughness remains constant from room temperature despite the rise in temperature up to a boiling point.
Compare the Metals in Terms of Their Impact Toughness Generally and at Different Temperatures
At 0℃, the readings, from the table above, for impact toughness of Aluminum, Steel, and Brass are 5.0nm, 6.0nm, and 7.0nm, respectively. Brass has the highest value of impact toughness, followed by steel at 0℃. Aluminum has the lowest impact toughness at 0℃.
At 23℃, the impact toughness values of Aluminum, Steel, and Brass are 4.5nm, 14.5nm, and 6.5nm, respectively. At room temperature, steel has the highest impact toughness, followed by brass, and lastly, aluminum has the lowest impact toughness.
At 75℃, the impact toughness values for Aluminum, Steel, and Brass are 5.5nm, 15.5nm, and 6.5nm, respectively. At boiling point, steel has the highest impact toughness, followed by brass, and lastly, aluminum has the lowest impact toughness.
Which of the Metals Show a Ductile-To-Brittle Transition? Why Do Only Some Metals Show This Transition?
One factor considered in selecting materials is the ductile-brittle transition. This effect demonstrates the progressive change in metals’ behavior as they fracture from brittle cracking that occurs at low temperatures to ductile cracking at room temperature or above. This change in fracture mode usually takes place at a specific range of temperatures referred to as transition temperature.
The diagram below shows the change in the stress factor of a specimen resulting from ductile to brittle transition.
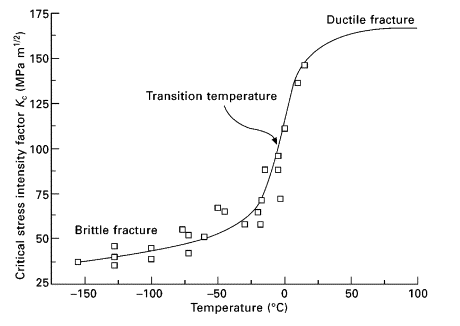
From the graphs above, it can be seen that only steel demonstrates this effect.
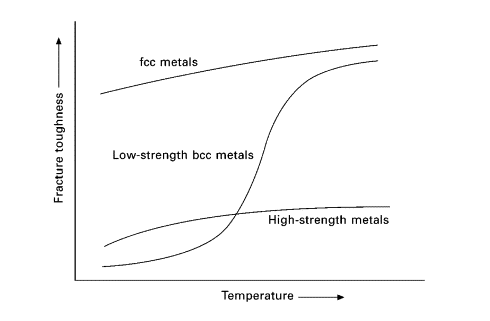
All metals display different ductile to brittle transition traits that are primarily determined by the crystal structure and the yield strength. Metals revealing face-centered cubic structures (FCC) undergo no transition while maintaining their flexibility at low temperatures. FCC metals display numerous slips allowing dislocation slip to take place at low temperatures. Aluminum is an excellent example of FCC structure metal that isn’t brittle at low temperatures. Another type of metal that doesn’t go through this transition effect includes metals with hexagonal close-packed (HCP) structures. An excellent example of these metals is aluminum. Metals that show ductile to brittle traits are those with Body-centered cubic (BCC) structure. At low temperatures, they fracture by brittle clip and at high temperatures show malleable tearing characteristics. The transition temperature depends mainly on the yield strength, thickness, and alloy content of the metal. The trait of these structures is shown in figure below.
Comment on Some of the Issues That Were Faced in Running This Lab. What Could You Do to Ensure Better Data Quality?
From the test conducted, better data quality would be obtained if various measures were observed. Due to disparities in the specimen’s size and the notch, the result achieved had some errors. This can be avoided by trying to have uniform dimensions of the sample and apertures in future experiments.
Since the experiments were conducted at various specimens’ temperatures, which gradually decreases over time, the time gap between retrieving from dry ice and boiling water should be significantly reduced. Thus, higher accuracy would be achieved.
Losses due to friction and wind should be minimized to achieve better results.
Fracture Surfaces
Identifying the aspects of the Charpy test’s fracture surface is very important to record the final results of the experiment. When the investigation is used to produce a ductile-to-brittle transition curve, the fracture aspect is highlighted according to the proportion of brittle or ductile failure modes available at the face of fracture (Li et al., 2018). Propagation and crack initiation are essential to fracture. The way through which cracking takes place in the material provides a clear indication of the way of fracture. Inductile fracture, the motion of crack is slower and is escorted by a massive amount of plastics. The break will only extend when there is an increase in stress (Li et al., 2018). The trial that extends through a brittle material continues to enlarge and increase in enormity upon initiation.
Conclusion
From the experiment done on the three metals, it can be seen that brass cannot withstand high pressure, vital forces, and high impacts when suddenly applied and hence brittle. It’s the second in toughness level of the three metals. At the same time, steel is ductile and strong due to its high plastic deformation. It’s the strongest and can withstand high impacts and strong forces before breaking the three specimens. Thus, steel is one of the best materials that can be used in constructions and in other applications that require strong materials. Aluminum is the most brittle and least ductile. It fractures easily and can only withstand meager forces and effects since its plastic deformation is very fragile.
Reference
Li, M., Mi, Z., Coffman, D., & Wei, Y. (2018). Assessing the policy impacts on non-ferrous metals industry’s CO2 reduction: Evidence from China. Journal of Cleaner Production, 192, 252-261. Web.