The study was conducted to determine the procurement and supply chain of polymers by SABIC through the dedicated function of Kayan that specializes in the development of the polymeric material as a feedstock for the production of petrochemical derivatives. A market report shows that Kayan has a significant market share despite operating with intense business rivalry, uncertain economic conditions, and supply chain activities that have significantly reduced the company’s profits.
Various models were used in the study among which include the industry structure model to determine the level of competition in the market as well as Porter’s five forces model. The cost of inventory was focused on the key area of study.
An appropriate source plan was developed to address the issues that arise in the company’s procurement and supply chain network. The results show that different legal clauses and decrees issued in Saudi Arabia can be invoked to enhance the level of agreement between the company and other stakeholders. Further, studies need to be conducted to address the issues that arise in the global supply chain besides and associated rules and regulations and how to comply with them.
Introduction
Product Outline
Saudi Basic Industries Corporation (SABIC) uses an integrated logistic procurement and supply chain network for its operations. The operations are driven wholly by joint ventures, subsidiaries, and affiliates (Alolayan and Richards 11). An overview of the company shows that it has 42 manufacturing and compounding companies, 21technology centers, and 84 international subsidiaries and sales offices. The company operates 1 SABIC Corporate Research and Innovation Center, 51 distribution, storage facilities and logistical hubs, and 4 application centers that use an end-to-end optimization technique in an integrated procurement and supply chain network.
Specialization in the supply chain
SABIC is the world’s leading company that specializes in the provision of a wide range of petrochemicals. The portfolio of products SABIC deals with includes industrial gases, ethylene glycol, dichloride, caustic soda, and Fertilizer. According to Alolayan and Richards, the products can be summarized into five categories, which include chemicals, agri-nutrients, metals, polymers, and other specialties that are offered in Africa, the Middle East, and Europe (12). One key feedstock investigated in this study is a polymer, which is the feedstock for a wide range of products. Kayan uses the feedstock to create lasting value based on the three elements of sustainability of people, planet, and profit in the supply chain cycle. Kayan uses the integrated linear programming feedstock planning tool in the supply of polymers across its entire procurement and supply chain network into the target markets.
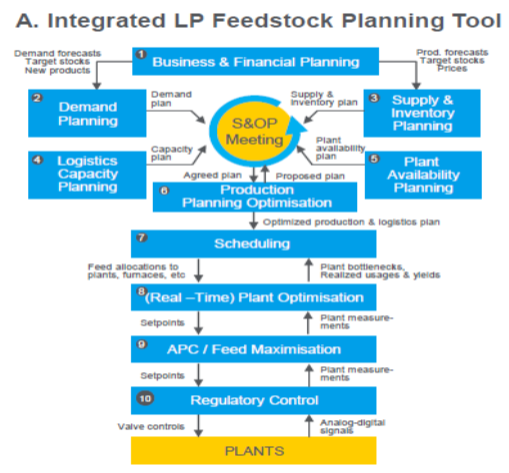
The production of polymers is a dedicated Saudi Kayan function of SABIC’s affiliate that makes 35% of polymeric materials manufactured in Saudi Arabia. Saudi Kayan specializes in the production of Ethylene Glycol, Ethylene, Propylene, and Polyethylene (Alolayan and Richards 13). It is worth noting that Kayan’s revenue as per 2012 was SAR 9,842 million with a loss of SAR 591.6mn recorded in 2015 showing muted growth due to the results of the inventory reevaluation that indicated an increase in financial charges.
Complexities of the Market
The company supplies polymers in both the European and the local Saudi Arabian markets (Stadtler 13). Kayan’s global competitors include Europe Plastics and Polymers, Global PET Stream, and China Polyolefin among others.
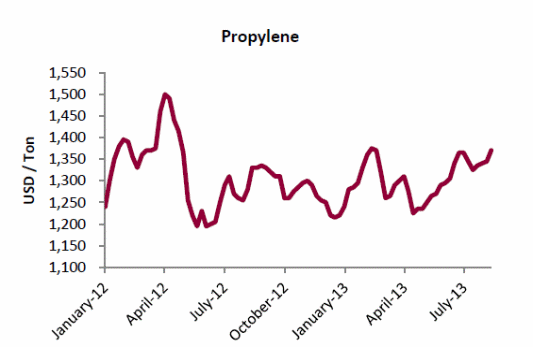
Alolayan and Richards provide detailed statistical data that show the performance of propylene and polypropylene in the market and the emerging trends based on the large quantities of petrochemical products sold as illustrated in figures 2 and 3 (13). Observations show significant growth between January 2012 and April 2012, which rises to the peak before it starts to decline significantly for propylene in subsequent years.
However, the trend continues to register a steep decline before it starts to show a significant increase in subsequent months of 2013. The highest cost of the polymer is US $1500 per ton and the lowest is US $1150 per ton, which increases to the US $1400 per ton in 2013.
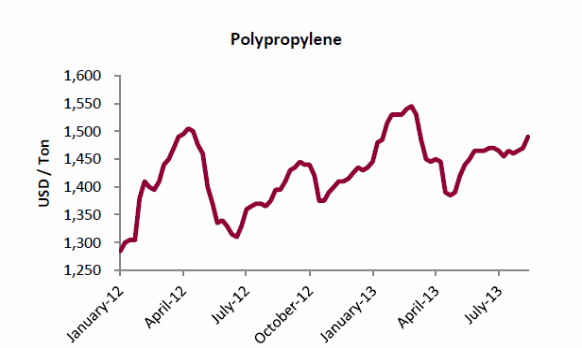
Figure 2 shows the demand and production of polypropylene, one of the derivatives from the polymeric feedstock polymers starting to rise in January with a price of US $ 1275 per ton before reaching a maximum of US $ 1500 and a low of US $ 1300. A study of the operational efficiency and performance of the subsidiary SABIC Company, Kayan reveals negative and grim statistics. In theory, Alturki shows that this occurs in response to market conditions, the key drivers and restraints of the Global polymer emulsions (3). The decline in sales is shown in table 1 as negative growth.
Table 1. Performance in terms of revenue.
A specific analysis of the local and international markets show negative results because of significant increases in operating income that are projected to be 814% by 2016 and 16.5% in 2017 (Packowski 48). The operating income keeps increasing from one year to the other. Besides, the key driver of profitability, which is the revenue, shows a negative and sometimes muted growth because of small negative and sometimes positive price changes of the company’s polymeric products.
There is a strong indicator of negative growth that is caused by numerous factors in the local and international markets. Declining revenue was the cause of the delay of the two major scheduled operational shutdowns in 2015 because of the negative impact on Kayan’s gross margins. However, a SABIC’s timely intervention of reducing undisclosed charges is expected to turn the operations of the company green by 2016 (Alolayan and Richards 15).
A summary of Kayan’s market characteristics showed an increase in net income was rationalized to SAR 399 million in 2014. However, the company’s market operations are sensitive to feedstock price movements reflected in the procurement and supply chain system (Sheffi10). The company is continuously prone to the changes in the market leading to the key financials summarized in figure 4.
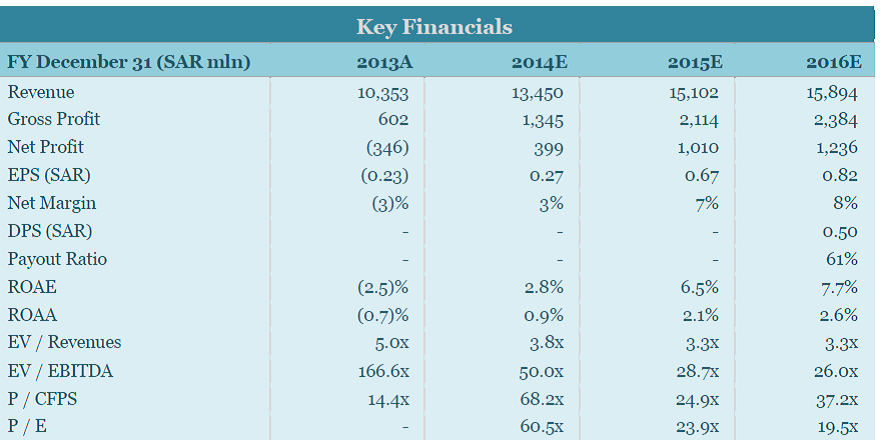
The key market drivers deduced from figure 3 are good volumetric sales with poor prices. However, it is noteworthy to say that the risk-free rate assumption has declined from 5.1% to 4.5%. The target price advance is bound to increase from SAR14 to SAR 15 in the 2015/2016 trading period.
Competitive analysis of the market
It is imperative to note that the petrochemical landscape specifically the supply of polymers has tailored the dependence of the Kayan Company, which is a subsidiary of SABIC cooperation to complete dependence on petrochemical products (Simatupang and Sridharan 28). It is worth noting that the regional capacity of the Company is based on relative derivatives of the polymers and other basic chemicals. Current studies show little or no regional changes in product mix and the demand for highly sophisticated products.
Porter’s five forces model
Porter’s five forces model uses technology, diversification, and innovations as the key drivers of the market to gain competitive advantage. Packowski notes that competitive advantage can be gained by Kayan if the model elements are applied to determine the intensity of competition and countermeasures to address the level of competition (15). A summary of the Bloomberg data shows Kayan supplies 76.9% of the key feedstock. Besides, the industry is characterized by high and medium level concentration, with key fixed input prices fixed by international market forces.
A SWOT analysis
This is based on the Kayan petrochemical product market as illustrated in table 2.
Table 2. SWOT analysis.
Table 2 shows a summary of the strengths weaknesses, threats, and opportunities (SWOT) available for the company to consider when evaluating its supply chain management elements that are used in decision-making.
A competitive analysis of the complexity of the market showed that the market for polymers is one of the biggest in Europe that provides innovation, an area that depends on manufacturing (Christopher and Peck 11). Typically, Falter argues that the polymeric plastics have multiplier effects on manufacturing with a 10% value addition to products of different categories (3).
The market for plastics includes the automotive industry with 8.5% of the total demand, electrical and electronic applications represent 5.6%, 21.7% European plastic demand, and agricultural applications which have a market share of 4.3%. However, it has been shown that the global demand for plastics is bound to increase by about 6% between 2015 and 2020, with the Asian market likely to account for 34% of the global demand for plastics.
Industry structure model
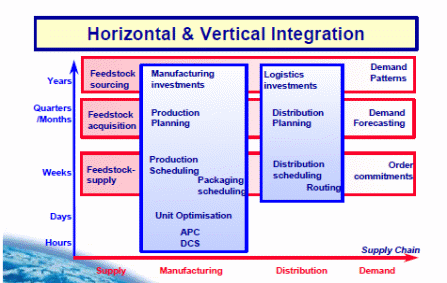
The industry structure model can be used in this case, which constitutes the key elements of the regulatory framework conditions, competitive situation, market and demand conditions, and the supply chain situations. Zairi argues that using the product proximity principle and appropriate inputs, it is possible to generate outputs to effectively fulfill supply chain demands and reduce production costs for competitive advantage (390). With vertical and horizontal integration of stakeholder’s procurement and supply chain activities, it is possible to predict demand patterns as shown in figure 5.
However, the market for Kayan’s products varies depending on the definition and availability of substitute products.
A critical analysis of the horizontal market lacks competitive overlap that has led to a 15% market share for SABIC. This shows that SABIC has a low market share that is barely above 25%. The result could be an 80% PPE compound market share in the vertical market with only 5% worldwide market share. However, Kayan faces stiff competition from Mider, which has a 30% global market share.
Value addition to the Kayan organization
The most significant approach to adding value to the polymer can be derived from different perspectives. The first instance is to lower marketing fees by making investments in machinery as a prerequisite to lower operating costs. Ramzi, Zairi and Gunasekaran argue that the concept was applied by the allocation of 10 million square feet per day for Kayan by the ministry of interior that increased the production capacity of ethylene oxide (EO) and ethylene (C2), the feedstock for polymers, which has reduced dependence on butane and increased dependence on ethane gas (360).
Besides, it is worth reducing the financial costs because the company financed through almost 67.4% debt to reduce the future cash flow of the company. The second approach is to optimize downstream opportunities. Typically by increasing the utilization rate of products such as polyethylene and polypropylene among others, it is possible to add value to the product b reducing the procurement and supply costs, which translates to a 33% reduction in marketing fees and other costs.
The third point is to delay the scheduled shutdown. Delaying schedules maintenance by 61 days lowers anticipated losses to AR873 mn to SAR 665.9 mn despite an expected decrease in volumetric sales by 25%. Evidence shows that most European companies that relied on the polymer as a feedstock for the conversion business experienced a 60% worsened supply of the polymer for two consecutive years (Ishizaka and Labib 14336). A grim outlook is has been predicted for 39% of other European converters because of the lock-in effect on small suppliers as opposed to large multinational companies that can source the product from other suppliers.
The fourth approach is to implement the procurement of renewable feedstock for the production of a wide array of polymeric derivatives. Other areas that the company could consider addressing include effective demand planning, production planning, and appropriate scheduling of procurement and supply chain activities. According to Alolayan and Richards, the fifth approach is to increase the number of joint ventures in the downstream sector that are specialized in different value addition technologies (11).
Methods of market research
Different market research methodologies have been proposed in academia. This study relied on a qualitative research paradigm based on market intelligence reports to address the research problem. Several articles on the subject of the investigation were analyzed and data generated to make the bulk of the study. Typically, the study employed a secondary market research method that relied on established facts and not primary research which depends on primary data collection and analysis.
Recommendations for the best type of specification
As noted by Stadtler, the key recommendations in contractual terms include factoring due diligence, scope clauses limiting the liability of contractors, the money required to limit liability, an implied obligation of both parties in the contract (15). That could ameliorate situations that happened between SABIC in 2006 and Simon Carves Ltd (SCL) that went under and failed to complete the contract within schedule compelling the company to seek for Advance Payment Guarantee.
Methodologies of pre-qualification appraisal and the bidding process
Traditional approaches of pre-qualifying contractors are based on price as the key element. However, Greco, Matarazzo, and Slowinskiinvestigations and experience show that additional factors such as cost and price, delivery times, performance abilities of the bidder, and the duration and terms of warranty or guarantee need to be factored (25). One approach that has been widely applied among different other methods and proved to be successful is the Analytic Hierarchy Process (AHP) (Shalan and Ykhlef 2409).
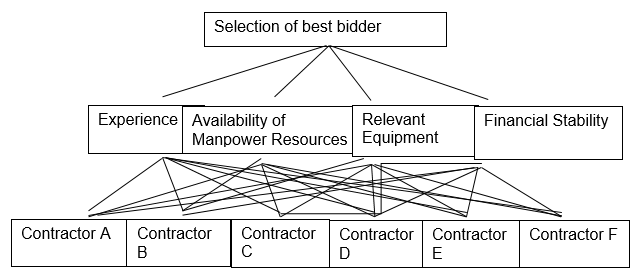
In theory, Derrouiche Neubert and Bouras note that AHP is the best approach under the multi-criteria decision-making (MCDM) technique (430). The technique uses multiple criteria to identify and determine the appropriate contractor based on pertinent data that are from different sources as shown in figure 6.

The award criterion is based on weights that are added to each preference using a Saaty’s 1-9 scale based on the results that are given to the prospective bidders.
Table 3. A numerical rating of preferences.
Table 3 depicts the evaluation and award criteria that can be used for pre-qualification and later award of a contract based on the key elements of the ability to perform and the history of the company that is bidding for the contract.
Appraisal
According to Ramzi, Zairi and Gunasekaran, the evaluation and appraisal process consist of assigning values based on given criteria and making a detailed description of the sub-criteria section for the financial, experience technical, reputation, and occupational health, safety, and performance criteria as shown in table 3 (360). In theory, the other elements that can be used for the purpose of apprising the bidder such as the ability to control key supply chain processes, the ability to manage inventories effectively, commitment to quality, contract execution capabilities, and contract risks.
Table 4. Criteria and sub-criteria.
Typically, a pairwise comparison based on the matrix method using Eigenvalues could be used to transform the subjective judgment into numerical values with 1 showing a strong level of influence and 9 indicating no influence at all using n (n – 1)/ judgments (Derrouiche, Neubert and Bouras, 431). It is possible to use the following method to calculate the eigenvalue. A theoretical disposition of establishing the (λmax) the eigenvalue is shown.
λmax = ![]() Wj/Wi,
Wj/Wi,
It is important to note that the award criteria depend on the consistency criteria that are calculated using the mathematical relation of CI = (λmax – n)/n – 1where the matrix size is represented by n. In theory, Derrouiche, RNeubertcand Bouras, show that for a bidder to qualify for the award of the contract or for the contract to establish a working relationship between Kayan and other companies, the value generated from the results using the formula obtained from CR = CI/RI = [(λmax – n)/n – 1]/RI must be less than 0.1 (433). In theory, any value that is greater than o.1 shows a high degree of inconsistency (19). In the case for companies A, B, C, D, and E, the results are tabulated in Table 5
Table 5. Statistics of prequalification criteria.
The software can be used to conduct the sensitivity analysis required to determine the right contractor in the procurement and supply chain relationships to determine the right contractor from among a choice of 9 bidders. The criteria for prequalification (CR: 0.05 < 0.10) was set before sensitivity analysis is done.

The results in figure 8 show the pre-qualification criteria to be Manpower, which has a score of 0.18544, which is close to fulfilling the requirements of CR: 0.05 < 0.10, a measure that shows a strong degree of reliability. Typically, manpower is in the context of the human resource trained and skilled.
Use of negotiation to add value
In view of the need to add value both from the stakeholders and the organization, value negotiation can be done by addressing the source of costs that are direct causes of the increase in inventory expenditure. The key points include a review of stakeholder inputs into the procurement and supply chain process. The planning function can be re-engineered to add value and reduce costs in the supply chain so that the company profits increase by 10% of the revenue reflected in the 2015 financial statement due to lower inventory costs.
Reference to contract management
According to Staedtler, SABIC incurred a loss of 20% of the contract price in 2013 (11). In reference to the key terms of contracts, the Repudiatory breach of contract, implied obligations in a commercial contract, limitation of liability, and recoverable losses constitute the key areas to focus on.
A category of expenditure
According to the financial statement that ended on 31 December 2015, it is noted that Kayan incurred expenses in the distribution and supply of polymer feedstock for the production of different finished and semi-finished products in Europe, Africa, Asian and other parts of the world (Staedtler 19). One key category of expenditure is 24,635.4 SAR mn in 2015, which reflects leasing stock inventory stores expenses for the storage and onward supply of polymer, the feedstock for European plastic manufactures. The category of expenditure is classified as operating leases with assets classified as fair market asset value with the rental payments of the stores charged on the interim consolidated statement.
The sourcing plan
Drawing on the inventory expenditure and the theories of resource planning, the source plan is shown in table 4. The rationale is to achieve inventory management objectives, which include cushioning the company against fluctuations that could lead to financial loss, effective use of materials, better management of people and machines, effective control of outputs, and better control of the distribution of stocks (Lozowski 67). By effectively managing the resources, this could positively improve the company’s cash flow despite the current financial indicators already showing projected significant losses (Zairi 12). Value addition could address storage, cost control, foresting needs, and customer satisfaction needs.
Role of procurement and supply
The role of procurement and supply chain in managing company inventory for Kayan includes different elements that are discussed hereafter.
Inputs that can be made by the stakeholder
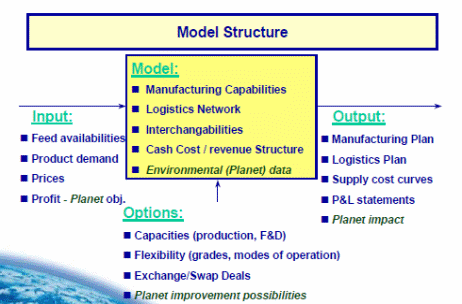
Based on stakeholder theory where value creation and the direct impact of costs dominate, stakeholder inputs should be in the provision of support in procurement and planning. The goals are to reduce feedstock costs, optimal asset utilization such as inventory assets, lower shipping costs, and increase the value of polymeric feedstock material. The inputs could be in terms of the model structure shown in figure 9.
Techniques for value addition on inventory expenditure
Value addition in the procurement and supply chain system can be achieved by investing in human, social, financial, and natural capital to facilitate the inventory process and reduce expenditure in this area. That is in the context of establishing a reliable and steady supply of polymer feedstock to reduce the risks of disruption in the markets. Another approach is to build storage facilities near the production site.
The result could be an increase of 30% export level of the polymer and reduction of operating and inventory costs (Luciani 6). Typically, a similar approach led to the creation of 36 new investors with investment totaling SR 4.6 billion. Another technique is to improve internal processes. Improvement of internal processes in 2013 underpins the 900+ new patents that were registered in the financial year’s statement of 2013 which amounted to SR 25.3 billion.
The next technique is to create downstream economic value by attracting more investments in the area. The other techniques that have been suggested in academia include leveraging value chain partners, innovation, attract and retain the right contractors, and invest in product tracking. That is in addition to the use of better sourcing mechanisms and third party logistics.
In theory, Kayan’s inventory and warehouse expenditure can be reduced by using stock cycles based on adding economic value, low order transactions using automated information systems, and low inventory holding costs. The other approach includes reducing forecasting tools to optimize the supply chain network. The other areas of improvement include minimizing purchasing minimums, accurately determine upstream and downstream forecasts, and optimize price and quantity breaks. Kayan reported a much weaker than expected loss of SAR368mn, which was written down resulting in SAR19mn profit. Typically, by focusing on the item, payment, vendor, contract, and category analysis, the expenditure could reduce by 24% to SAR476mn.
Inclusions that should be made in contracts formed in the future
Different sections and articles binding the company with upstream and downstream contractors in the procurement and supply chain have been used based on different laws. Article (16) details the relationship between partners in a contract on liabilities, joint ventures, and Article (17) that regulates the relationship among the members in a contract. Article (21) details the publication of the partnership or terms of the contract between the supplier and the consumer in a procurement and supply chain relationship.
This is in accordance with the service agency regulations under commercial laws of Saudi Arabian Royal Decree M/2 (1978) and in accordance with clause 7.1that applies among contracting parties. It is critical to invoke section 6 to enforce Force Majeure, where any party to the contract can be punished to avoid Repudiatory Breach to avoid an Ampurius case.
Measures that can be taken to select effective suppliers
The key measures include using past performance data to measure and determine the performance of bidders, examining the supplier perceptions about procurement and supply chain activities, developing partnerships, and ensure the supplier is certified. The other elements to consider include pricing, the quality of services, warranties & claim policies, operating controls, and inventory costs.
Any aspects of the purchase/supply that may require negotiation
In the context of SABIC supply chain relationships as provided for by Kayan, the aspect that requires negotiation includes how to optimize supply chain networks by involving highly trained and skilled people to reduce costs and increase efficiency.
Conclusion
In conclusion, Saudi Arabia Basic Industries Corporation (SABIC) petrochemical company deals in a wide range of petrochemical products with Kayan operating the dedicated function of supplying polymers under the SABIC Company. The Polymer is a feedstock polymeric compound for a wide variety of plastics manufactured in Asia, Saudi Arabia, and other middle east companies, and the European markets.
Typically, the company has different methods of identifying the right suppliers to reduce different categories of expenditures such as the inventory and warehousing of polymers. Different methods have been proposed that can be used to select the right suppliers in the procurement and supply chain network besides adding value to the organization. Among the methods that work well is the AHP method that is based on multiple criteria and weights with preferences.
Works Cited
Alturki, Khalid Hamad. “Voluntary disclosure by Saudi companies.” Affane Aji, Chadia 388 (2015). Print.
Alolayan, Abdulrahaman Ali, and Darlington Richards. “Internationalization of Chemical MNE Corporation: A case from Saudi Arabian Corporation” SABIC”. International Council for Small business (ICSB), 1.1 (2015). Print.
Christopher, Martin, and Helen Peck. “Building the resilient supply chain.” The international journal of logistics management 15.2 (2004): 1-14. Print.
Derrouiche, Ridha, Gilles Neubert, and Abdelaziz Bouras. “Supply chain management: a framework to characterize the collaborative strategies.” International journal of computer integrated manufacturing 21.4 (2008): 426-439. Print.
Falter, Wolfgang. “Practitioner’s Section.” Journal of Business Chemistry 12.2 (2015). Print.
Greco, Salvatore, Benedetto Matarazzo, and Roman Slowinski. “Rough sets theory for multicriteria decision analysis.” European journal of operational research 129.1 (2001): 1-47.
Ishizaka, Alessio, and Ashraf Labib. “Review of the main developments in the analytic hierarchy process.” Expert systems with applications 38.11 (2011): 14336-14345. Print.
Lozowski, Dorothy. “SABIC signs alcohol-technology licensing agreement.” Chemical Engineering 117.10 (2010): 67-68. Print.
Luciani, Giacomo. “The GCC refining and petrochemical sectors from a global perspective.” Eckart Woertz (Dubai: Gulf Research Center, 2007) (2007). Print.
Packowski, Josef. LEAN Supply Chain Planning: The New Supply Chain Management Paradigm for Process Industries to Master Today’s VUCA World. CRC Press, 2013. Print.
Razmi, Jafar, Mohamed Zairi, and Angappa Gunasekaran. “The application of analytic hierarchy process in classification of material planning and control systems.” International Journal of Services and Operations Management 2.4 (2006): 352-366. Print.
Shalan, Sara A. Bin, and Mourad Ykhlef. “Solving Multi-objective Portfolio Optimization Problem for Saudi Arabia Stock Market Using Hybrid Clonal Selection and Particle Swarm Optimization.” Arabian Journal for Science and Engineering 40.8 (2015): 2407-2421.Print.
Sheffi, Yossi. “Supply chain management under the threat of international terrorism.” The International Journal of logistics management 12.2 (2001): 1-11. Print.
Stadtler, Hartmut. “Supply chain management: An overview.” Supply chain management and advanced planning. Springer Berlin Heidelberg, 1.1 (2015): 3-28. Print.
Zairi, Mohamed. “Managing customer satisfaction: a best practice perspective.” The TQM Magazine 12.6 (2000): 389-394. Print.