Abstract
The AL Khaleeji Commercial Bank is based in the Kingdom of Bahrain. It was formed in 2004 and it is a Shari compliant bank. The bank offers a wide range of products and services to both personal and corporate clients. The paper carried out a financial analysis of the bank. Ratio analysis is an important tool that is used to break down the financial statements for better understanding. An overview of the bank’s income statement and profitability shows that there was growth in profit between 2005 and 2008. Thereafter, the bank experienced a decline in performance.
The balance sheet grew throughout the same period, apart from the year 2010. In 2010, the bank did not have any non-performing loans. Allowances for loan losses were made from 2008 while provisions were made from 2009. These two values show the quality of the loan book is deteriorating. Finally, DuPont’s analysis shows that low profitability, high leverage, and low efficiency contributed to the low values of return on equity.
Introduction
The AL Khaleeji Commercial Bank is based in the Kingdom of Bahrain. The entity was formed in 2004 and it is one of the major Islamic banks in the region. The bank is completely Shari complaint and it is listed on Bahrain Bourse. It has expanded tremendously over the years and is one of the fastest-growing financial institutions in the country to date. The growth is evident in the financial results that are posted. The bank has taken the necessary steps to ensure that it generates positive results. For instance, the results posted for the year 2016 shows that the total assets amounted to BD764,999 thousand (AL Khaleeji Commercial Bank, 2017a).
This was up from BD653,975 thousand in 2015. The total liabilities also grew from BD171,003 thousand in 2015, to BD243,853 thousand in 2016. The total equity increased from BD107,903 thousand in 2015, to BD112,699 in 2016. The total income also rose from BD21,304 thousand in 2015, to BD25,785 thousand in 2016. However, the profit for the year dropped from BD8,021 in 2015 to BD5,308 in 2016 (AL Khaleeji Commercial Bank, 2017b).
This growth can be attributed to the growing number of clients, the widespread financial and banking products and services that target both individual and corporate clients, and active participation from all stakeholders of the bank. In addition to being listed on Bahrain Bourse, the bank currently has about 11 branches that are strategically located within Bahrain. It is keen on expanding the current network of branches and expects to cover a wider geographical region as compared to the current state.
In terms of products, the bank offers a variety of services to clients. Some of the areas that they focus on are auto finance, personal finance, Easy 36 credit cards, housing finance, and Visa credit cards. It also offers ordinary banking services, mainly on Al Waffer accounts, savings accounts, Mudharaba accounts, and current accounts, among others, as well as a variety of VISA cards to its clients. Some of the categories of the cards include Infinite, Classic, Gold, and Platinum (AL Khaleeji Commercial Bank, 2017a).
The cards have distinctive attributes that make them appealing to clients. Apart from the products that target the individual clients, the bank also can provide outstanding investment and financial services to corporate clients. The specific services that it offers to this group are real estate financing, capital financing, project financing, Letters of Credit, and commercial financing. Also, the bank manages various assets for clients across the world. The approach that the bank uses generates better outcomes for the clients. Further, the bank makes use of advanced electronic services that are modeled to enhance communication with clients and to ease the flow of transactions.
These electronic systems make use of the latest technologies and advanced security features that ensure the safety of customers’ personal information (AL Khaleeji Commercial Bank, 2017a). The products and services are packaged to maximize returns for both the bank and the capital providers. This has been achieved by employing a dedicated team of professionals and selecting investment options that have low-risk exposure and generate high returns. This paper seeks to carry out a ratio analysis of AL Khaleeji Commercial Bank.
Literature Review
The financial statements that are presented at the end of a financial period do not, of itself, provide an in-depth view into the financial strengths and weaknesses of the entity. Therefore, it is important to breakdown the values that are presented in the annual report to gain a deeper understanding of the performance of the company overall. This creates the need for ratio analysis. Financial ratios are the key pointers to the performance and overall health of an entity.
Besides, some ratios suit a specific company or industry in which a company operates. For instance, some ratios specifically suit the analysis of the performance of banks. It is worth mentioning that banks operate under close supervision from the authorities (Drury, 2013). Specifically, banks are expected to maintain a minimum level of liquidity and leverage. This is important because it creates stability in the money market. The money market is vital in the economy and this explains why financial institutions, especially banks, are tightly regulated.
The liquidity ratio looks at the balance between current assets and current liabilities (Clarke, 2012). Specifically, it evaluates the ability of the company to settle immediate obligations using short term assets. Banks are expected to maintain a certain level of liquidity because they take deposits (which are liabilities to a bank) from clients. Therefore, sound liquidity levels ensure that the banks do not experience panic withdrawals as a result of lost consumer confidence in the financial institution. This explains why the company sets the liquidity level that the banks must maintain (Horner, 2013; Drury, 2013).
The second most important category of ratios is the leverage level of the company. This shows the proportion of debt and equity in the balance sheet of the company. It may also give some indication of the ability of the company to settle long term debt. Unlike other sectors, the banking sector is expected to maintain a certain level of debt and equity. The capital structure of a bank is highly regulated by authorities.
Besides, the success of a bank also depends on the combination of debt and equity. Another important ratio that must be analyzed is the asset to equity ratio, showing the proportion of assets that are financed by equity. To the shareholder, the ratio gives them information on the percentage of the assets that they have a lasting claim on. A high amount of debt in the capital structure lowers the value of this ratio, and this can reduce the confidence of the shareholders.
Another aspect of performance that is often analyzed is profitability. This shows the earning power of a bank. Numerous ratios can be used to evaluate the profitability of an entity. Generally, high profitability ratios are preferred to low ratios. The first and most common ratio is the net ratio. It shows the profit that is earned per unit of sales. Apart from providing information on profitability, the ratio also indicates the efficiency in managing the pricing of products and services, and expenses, of the entity. The second most commonly used ratio is the return on equity. This gives information on how well the company makes use of shareholders’ equity to generate profit.
It shows the profit generated per unit of equity (Wahlen, Baginski, & Bradshaw, 2014). Another ratio is the return on assets. The ratio also shows the efficiency in the use of assets to generate income. The ratio conveys information on the profit generated per unit of asset. An extremely low value of the ratio indicates that there is a large chunk of assets that are idle or dilapidated. If the assets are fully utilized, then the value of this ratio is often high (Wahlen et al., 2014).
It is worth mentioning that there is a direct association between growth in assets and an increase in sales. Other important metrics can also be used to evaluate the performance of a bank. Some of these measures are capital to risk ratio (capital adequacy ratio), provision for loan losses (PLL), non-performing loans (NPL), an allowance for loan losses (ALL). Some of these measures analyze the quality of a loan book.
Data, Results, and Discussion
Income Statement
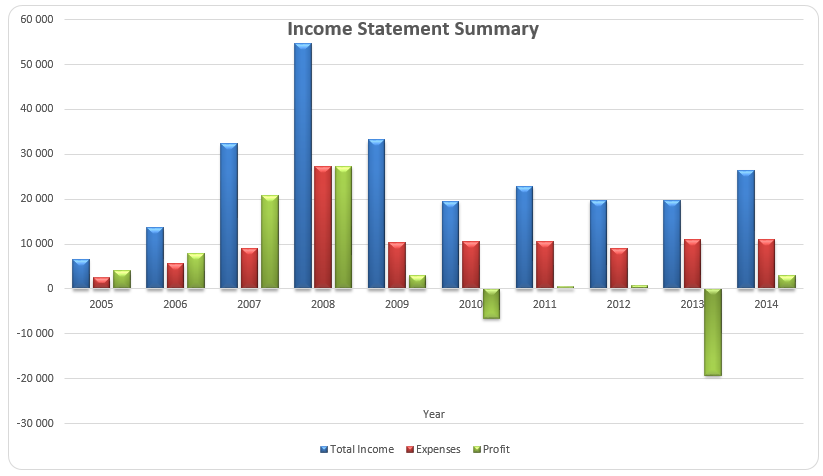
The income statement shows the income and expenses that are generated by the bank at the end of a financial year. The entity generates income from management and other fees, placements with financial institutions, financing assets, and assets acquired for leasing, investment securities, and investments in associate companies. The main categories of expenses are staff costs and depreciation. The bank also deducts the impairment allowance before arriving at the value of profit for the year. Further, a large proportion of revenue is generated from interest income. The values of income, expenses, and profit for the year are summarized in Table 1 below.
Table 1: A summary of income statement values.
The bank experienced robust growth in total income, expenses, and profit between the years 2005 and 2008. However, from 2009, the income started to decline. This led to a corresponding decrease in expenses and net income. The loss in net income can partly be attributed to the increase in impairment allowance. The bank also made losses from several investments. Currently, it appears that the bank is struggling to make a profit. The bar graph presented below shows a trend of these values.

Balance Sheet
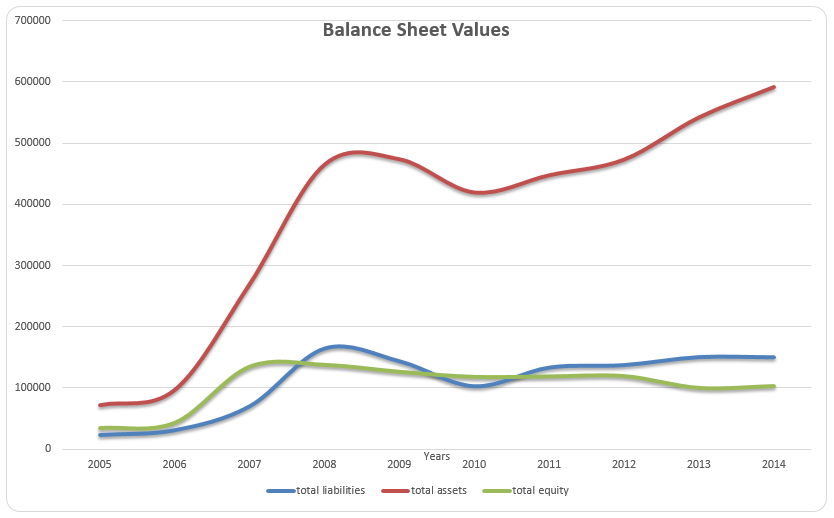
The balance sheet of the bank gives information on assets, liabilities, and equity. A closer review of the balance sheet shows that financing assets account for the largest proportion of the bank’s total assets. This is followed by investment securities, placements with financial institutions, and assets acquired for leasing. Other components of total assets are cash and bank balances, investment property, property and equipment, and investment in associates, among others. The total liabilities are made up of placements from financial institutions, non-financial institutions, and individuals. The value of assets, liabilities, and equity over the ten years are summarized in Table 2 below.
Table 2: Values of assets, liabilities, and equity.
Information in the table above shows that the value of total assets and liabilities increased throughout the 10 years. However, there was a slight decline in the year 2010. The drop in total assets can mainly be attributed to placement with financial institutions. The total equity grew between the years 2005 and 2008. Thereafter, the bank started to experience a decline. The decrease in total equity can be attributed to a drop in retained earnings.
The company made losses and this led to a fall in the value of equity. The low and negative profits that are reported in the income statement have a direct impact on shareholders’ equity. The trend of the three values is displayed in the graph below.

Ratios
Table 3 summarizes the results for the ratio analysis below.
Table 3: Results for the ratios.
The value of net interest margins ranged between 3.02% and 5.10%. The ratio measures the difference between the interest income that is generated by the bank and the amount of interest that is paid out to their borrowers. There was no significant change in the value of the ratio. It shows that the net interest margin did not change by a large margin. On the other hand, the non-interest margin ranged between 0.42% and 67.42%.
This ratio focuses on all other incomes that are non-interest. Examples of these incomes include fees charged on advisory services. Return on assets and return on equity increased between the period 2005 and 2008. The values declined and fluctuated during the remaining years. As mentioned above, return on assets and equity measures the efficiency in the use of assets and equity respectively to generate income. A decline in the values of these ratios to negative values shows that the bank is experiencing problems with profitability and efficiency. It is clear that in 2010, and 2013, the company had negative profits.
Analyzing the loan book of the bank is also quite important. It shows the quality of the assets that the bank has. It is worth mentioning that AL Khaleeji Commercial Bank was formed in 2004. This explains why no loans had been marked as non-performing. Further, between 2005 and 2008, there were no provisions made for loan losses. The value of these provisions ranged between BD903 thousand and BD15,245 thousand.
The highest value was reported in 2013. This contributed partly to the losses that were reported in the same year. The value of provisions for loan losses ranged between BD2,182 thousand and BD4,156 thousand. Despite being an institution that has not been present for long in the market, it can be noted that the loan losses are affecting the profitability of the company. The loan book also has a direct effect on the profitability and efficiency of the bank. Therefore, the bank needs to carefully evaluate the quality of the loans that are being issued.
Standard Deviation and Mean
Table 4 presented below shows the mean and standard deviation for the ratios.
Table 4: Mean and standard deviation for the ratios.
The mean for the net interest margin was 4.11% while the dispersion from the average was 0.66%. The low value of the interest margin shows that the volatility of the net interest margin was low. The average for the non-interest margin was 33.99% while the standard deviation was 29.36%. It shows that the volatility for this ratio was quite high. The average for the return on assets was 2.40% while the standard deviation was 4.14%. The spread for the ratio was higher than the average. Finally, the mean for the return on equity was 4.78%, while the standard deviation was high at 12.09%. This shows that the return on equity is quite unstable.
Return on Equity
DuPont analysis breaks down the return on equity into three parts; net profit margin, asset turnover, and equity multiplier. These three components will look at the profitability, efficiency, and leverage of the bank. This analysis helps in knowing which of these three components has the most significant effect on return on equity. This analysis can be expanded further into five components. Using the three main components, the return on equity will be calculated using the formula presented below:
- Return on equity = profit margin * asset turnover * equity multiplier
- Profit margin = profit for the year / total income
- Asset turnover = total income / total assets
- Equity multiplier = total assets / total equity
Table 5: DuPont analysis.
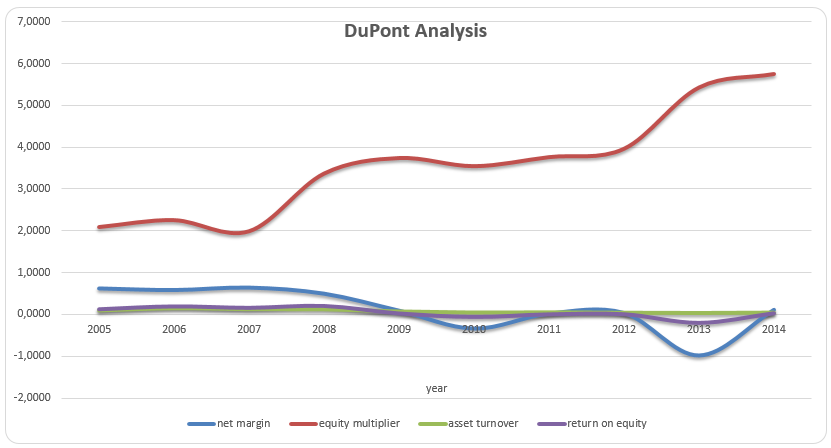
In the table above, it can be observed that the company reported high profits between 2005 and 2008. The value later deteriorated during the remaining years. It can be noted that the bank was struggling to generate profit. The equity multiplier increased during the 10 years. This is an indication that the amount of debt in the capital structure increased. Further, the asset turnover shows that the efficiency in the use of total assets increased between 2005 and 2008.
The value later deteriorated. Just as with the other components, the return on equity improved between 2005 and 2008. The values later deteriorated. Between the years 2005 and 2008, the net margin had a great impact on return on equity. As the values of the net margin dropped, the return on equity also deteriorated. The equity multiplier also had an impact on the return on equity between the years 2008 and 2014. The use of low amounts of debt generates some benefits to the shareholders.
Thus, the two main components that had a great effect on return on equity were net margin and equity multiplier. Simply, the return on equity deteriorated over the period. The profits are dwindling while debt is increasing. Efficiency in the use of assets is also deteriorating. This leads to low values of return on equity. The chart presented below shows the trend of values.

Conclusion
This paper carried out a financial analysis of the AL Khaleeji Commercial Bank. The bank is based in the Kingdom of Bahrain and was formed in 2004. The financial analysis shows that the bank experienced a growth in financial performance during the first three years of operations. Thereafter, it is evident that profitability deteriorated. The bank reported losses in 2010 and 2013. This was due to a decline in income and an increase in allowances for loan losses.
The assets and liabilities grew throughout the entire period while equity deteriorated from 2009. An evaluation of the allowance for loan losses (ALL) and provision for loan losses (PLL) shows that the quality of the loan book is deteriorating. This can be explained by the increase in allowances and provisions. As of 2014, no loan had been marked as non-performing. This can be largely explained by the measures that have been put in place to track and follow up loans. The bank needs to come up with measures that can enhance profitability and reduce the leverage level.
References
AL Khaleeji Commercial Bank. (2017a). About us. Web.
AL Khaleeji Commercial Bank. (2017b). Investors relations-Financial report. Web.
Clarke, E. A. (2012). Accounting: An introduction to principles + practice (7th ed.). South Melbourne, Victoria: Cengage Learning Australia.
Drury, C. M. (2013). Management and cost accounting. New York, NY: Springer Publishers.
Horner, D. (2013). Accounting for non-accountants (9th ed.). New Delhi, India: Kogan Page Ltd.
Wahlen, J. M., Baginski, S. P., & Bradshaw, M. (2014). Financial reporting, financial statement analysis, and valuation: A strategic perspective. Boston, MA: South-Western Cengage Learning.