Introduction and Objectives
Introduction
The only thing constant on earth is ‘change’. The universe as a whole and everything on it undergo transformations with time. The business sector is no exception to the phenomenon of change. For modern day business, Change is an unavoidable reality that comes with both opportunities and challenges. Surviving in this ever-changing business environment saw dramatic changes in the organization- its structure, its approaches and its business functions including marketing, production, finance and investments and others. Particularly, changes in the field of organizational finance, investments and acquisition have been very eye-catching.
During the 1950s-1960s, a new trend emerged wherein a growth aspiring company went for buying another small or medium company with borrowed money thereby using no money or little capital of its own (See, Shleifer & Vishny, 1991). This buying spree with borrowed funds intensified during the 1970-1980s and this time the bigger companies and conglomerates were also involved in such transactions. Purchase or buyout of target companies or divisions of a company using leverage became a very common practice during that period which eventually found recognition as the ‘Leveraged Buyout’ or LBO (CPEE, 2003).
The main idea behind an LBO is that the acquirer purchases the target with a loan collateralized by the target’s own assets. Using target’s assets for securing acquirer’s credit in case of hostile takeover situations brings infamous reputation for LBO (Michelle, 1999).
Any LBO and its outcome has strong bearing on the fortunes of at least three parties involved- the acquirer who goes for the LBO, the company or entity to be taken-over and the shareholders (Cheffins, 2007). Now it is pertinent to know if leveraged buyouts (LBOs) create any value for the acquirer, the target company or business division and the shareholders. There must be some reasons or advantages that drive companies to go for LBOs. A successful LBO is reported to provide a series of benefits to the company initiating it. The company having greater equity stake finds LBO increasing its management commitments and business efforts in effect (See, Zahra, 1999).
Managers and executives can realize substantial financial gains due to overall managerial performance improvements brought about by the LBO (Kaplan, 1997). LBOs can also revitalize a mature company and can improve the market position of a company by increasing company’s capitalization (Carriere G., 2002). Empirical studies indicate that the shareholders of a firm can earn large positive abnormal returns from leveraged buyout and the post-buyout investors can also earn excess returns throughout the buyout completion to initial resale period (Michelle, 1999; Ravenscraft & Scherer, 1989; Jensen & Ruback, 1983).
There exist different potential sources or avenues of value addition in case of leveraged buyout transactions which include- wealth transfers from old public shareholders to the buyout group, wealth transfers from the public bondholders to the investor group, wealth transfers from improved incentives for managerial decision making, and wealth transfers from the government via tax advantages (Lerner, Sorensen & Strombeg, 2008). The new company formed through the LBO is required to support higher levels of debt thereby decreasing taxable income, which, in effect, leads to lower tax payments. Notably, this higher level of debt generates tax interest thereby enhancing the value of the firm (See, Johnson, 2001).
Going for LBO is not the end of struggle for a company, as all LBOs do not guarantee success all the time. There are some potential disadvantages, which a company needs to consider before embarking on the LBO route. Many companies went bankrupt having failed to pay the interests of high debts owing to insufficient cash flow and asset sale (William, 2001). LBO is suicidal for companies which are vulnerable to market competitions and volatility.
The interest rate of LBO debt is very high and paying such high interest rates can damage the credit rating of a company (Fox & Alfred, 1992). High profile corporate leaders have been found to finance takeovers with low quality debt just to earn huge profits by selling off the companies in pieces. This practice has earned bad names and negative publicity for LBOs and soon some critics started arguing that these types of transactions harm the long-term competitiveness of the firms involved.
Once the LBO is done, companies get busy in repaying the debt and thus it may not be possible for the company to spare funds for replacing operating assets and upgrading tools and technologies. This leaves the company to operate with old and outdated systems and tools and many companies even curtail their R&D expenditures under such situation.
This is why critics consider LBO to be an impediment to the growth prospects of a company (Jensen, 1988; Hendershott, 1996). Some argue that LBO transactions have negative impacts on the stakeholders and it leads to job loss due to downsizing of the firm (NBER, 1991). Further, LBOs are also accused to have negative effects on the communities where the company is located (Sirower, 1997).
Thus, there exist divergent views so far as the utility and impacts of leveraged buyouts are concerned. Some finds LBO to be a strategic tool for value addition while others criticize it to be an impediment to future growth and prospects of a company. Knowledge gaps and lack of understanding of the concepts of acquisition and the complexities of different valuation techniques largely contribute to the differences in views about leveraged buyouts. Therefore, it is required to form an unbiased view about the leveraged buyout process and get familiarized with the different valuation techniques. To this effect, this paper conducts a comprehensive review and investigation of the process and techniques of leveraged buyout covering all fronts-theoretical, technical and as well as empirical.
Beginning with this brief background, this chapter goes on to give a preview of the overall research study specifically outlining the research problems, aims and objectives and the methodology of research. The chapter concludes outlining the structure and layout of this report.
Research Problems & Questions
Leveraged buyout, technically and practically, is not as simple as it sounds. The business sector has been conversant with the term ‘leveraged buyout’ or takeover from as early as the 60s & 70s but still not many firms appear to have succeeded in mastering the science and art of the leveraged buyout process. Knowledge gaps with regard to the concepts and valuation techniques of LBO create confusions and doubts culminating to the basic question- do leveraged buyouts create value for the acquirer and the target company?
A quick scan of the available resources on LBO and acquisition reveals few gaps or problem areas and raises some questions requiring thorough investigation. Identified below are some of the major problems and the corresponding research questions which this study seeks to investigate and address.
- LBO is not a sure shot tool for getting success in business. Proactive planning, skills, experience and above all proper knowledge of relevant concepts and techniques are prerequisites for successful execution of LBO. Here the question is- what are the basic concepts, types, advantages and disadvantages of LBO and acquisition initiatives?
- Existing literatures and research works indicate use of wrong valuation techniques and improper application of modeling tools to be the dominant cause of LBO failures. Therefore it is very important to review related literatures and see what are the different valuation techniques and modeling tools used to value target firms and also study how prior research works contribute to the knowledge base of LBO initiatives?
- Prior research works provide empirical evidences on LBO initiatives. Thus, what are the available empirical evidences of LBO?
- All LBOs are not successful. When successful, they create value and when LBOs fail, they even drive a firm to bankruptcy. So, why all LBOs are not successful? How do LBOs create value?
Research Aim & Objectives
The principle aim of this research study is to investigate if leveraged buyouts (LBOs) create any value for the acquirer and the target company. Banking on the research findings and observations, this study attempts to capture some critical success factors for LBO initiatives. On its way to accomplishing this principal aim, this study goes deep into the research subject area to collect and investigate specific facts and figures, which are expected to fill the knowledge gap and address the research questions as pre-identified in Section 1.1. Thus the study objectives are connected to the research problems. Considering the research problems, the following objectives have been identified. The objectives are:
- Conduct a comprehensive review of the available literature on LBO.
- Investigate different valuation techniques, tools and models and explore the contribution of prior research works on LBO.
- Capture and present empirical evidences and hypotheses, if any, pertaining to LBO initiatives.
- Appraise on the value creation potentials of LBO in case of the acquirer and the target company.
Research Methodology & Approach
Selecting appropriate methodology is of paramount importance in case of any research study as methodology dictates the quality of study as well the accuracy and reliability of research outputs (See Bryman, 1984). The actual research work undertaken for this study can be broken down into seven inter-dependent sub-tasks as shown in Figure-1.1. Starting with the identification of research purpose, the actual research work proceeds to accomplish other sub-tasks like selection of research strategy, identifying data collection and analysis options, etc. before finishing with the research conclusions.

The principal aim of this research study is to investigate and explore if leveraged buyouts (LBOs) create any value for the acquirer and the target company. Different research options have been scrutinized and finally a research method has been selected, which fits well with the objectives and complexity of the study at hand. With the purpose of conducting an exploratory and descriptive research, a mixed research approach combining both qualitative and quantitative approaches has been adopted here (Ref: Kumar R., 1996).
Going by the objectives of this study, it is required to collect measurable or quantitative data pertaining to project costs, delay periods, etc. as well as non-measurable or qualitative information pertaining to LBO initiatives thereby necessitating adoption of the mixed approach (See, Yin, 1994). The research strategy followed here is dominantly literature based requiring a thorough review and scrutiny of prior research works, earlier case studies and questionnaire surveys. No actual surveys and interviews have been taken up in this case. Complete details of the methodology have been given in Chapter-III of this report.
Conclusion
This chapter presents a preview of the overall research study. Raising the concerns for leveraged buyout and pinpointing the possible knowledge gaps, this chapter presses for conducting a comprehensive review and investigation of LBO initiatives and the valuation techniques and tools. A set of objectives has been identified here carefully considering the depth and gravity of the research problems. The chapter also gives a brief primer to the research methodology. Concluding with the structure and layout of the report, this chapter makes way for taking-up the literature review in the next chapter (Chapter-II).
Literature Review
Introduction
In order to address the research problems and accomplish the objectives as identified in Chapter-I, critical review of available literature and prior arts pertaining to leveraged buyouts is one of the vital components of this study and more so, as this will form the foundation of the research and provide the framework for investigation. Starting with the basic concepts and definitions related to acquisitions and corporate transactions, this chapter goes on to conduct a comprehensive review of the LBO literature presenting the history and theory of leveraged buyout. The chapter concludes discussing and highlighting the contributions of ten published research papers on LBO transactions.
Leveraged Buyout
A leveraged buyout (LBO) can be defined as ‘a transaction in which a group of private investors, typically including management, purchases a significant and controlling equity stake in a public or non-public corporation or a corporate division, using significant debt financing, which it raises by borrowing against the assets and/or cash flows of the target firm taken private’ (Loos Nicholaus, 2005). During the 1950s-1960s, a new trend emerged wherein a growth aspiring company went for buying another small or medium company with borrowed money thereby using no money or little capital of its own (See, Shleifer & Vishny, 1991).
This buying spree with borrowed funds intensified during the 1970-1980s and this time the bigger companies and conglomerates were also involved in such transactions. Purchase or buyout of target companies or divisions of a company using leverage became a very common practice during that period which eventually found recognition as the ‘Leveraged Buyout’ or LBO (CPEE, 2003). The main idea behind an LBO is that the acquirer purchases the target with a loan collateralized by the target’s own assets. Using target’s assets for securing acquirer’s credit in case of hostile takeover situations brings infamous reputation for LBO (Michelle, 1999).
In simple words, LBO is the purchase of a company by using a small investment and a large loan. The new owner would gain control with a small amount of invested capital because he or she is able to secure a large loan for the balance of the amount needed. As Opler & Titman state, leveraged balance sheet has a small portion of equity capital and therefore a large portion of loan capital (Opler & Titman, 1993).
Sometimes it is also called as ‘Highly-Leveraged Transaction (HLT)’ that occurs when a financial sponsor gains control of a majority of a target company’s equity through the use of borrowed money or debt. Generally, the loan capital is borrowed through a combination of prepayable bank facilities and/or public or privately placed bonds, which may be classified as high-yield debt, also called junk bonds. Usually, the acquired company’s balance sheet reflects the debt, which is repaid by the acquired company’s free cash flow (See, Andres et.al., 2003).
Theory of Leveraged Buyouts (LBOs)
When considered in respect of specific capital structure, every leveraged buyout is unique on its own notwithstanding the element of financial leverage, which all LBOs commonly use for acquisition purpose. Under the LBO process, the private equity firm acquiring the target company uses a combination of debt and equity for financing the acquisition (TSB, 2003).
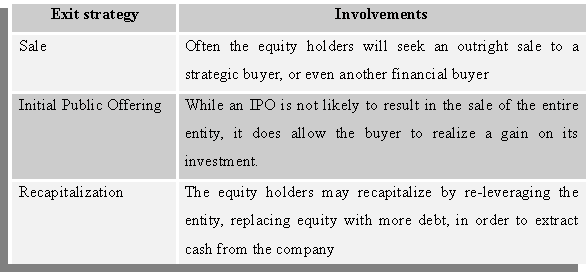
Notably, the assets of the acquired business stand security to a portion of the debt. The business after the acquisition generates cash flows that are used for paying off the debt incurred in its buyout. The debt holders get locked for a fixed return in case of a LBO making way for the equity holders to receive all benefits from any capital gains (Michelle, 1999). This is why financial buyers invest in highly leveraged companies seeking to generate large equity returns. An LBO fund will typically try to realize a return on an LBO within three to five years. There exist aggressive strategies for LBO investment exit, which can be separated into three heads- sale, initial public offering and recapitalization. Table-2.2 above outlines the three LBO investment exit options (TSB, 2003).
LBO- Value Creation
There are various sources or avenues of value creation in case of a leveraged buyout. A range of drivers directly influences operational efficiency and optimal utilization of assets of the company, which are referred to as- direct, intrinsic, operational or value creating drivers. There are another set of drivers as well which are non-operational in nature but contribute to expansion of value created between acquisition and realization of the investment. These are referred to as- indirect, extrinsic, non-operational or value capturing drivers. (See, Baker, 1992; Anslinger & Copeland, 1996).
Direct Drivers of Value Creation
Direct drivers have a direct effect on the free cash flow generation of the company. This cash flow generation is done through increasing revenues, reducing expenses or through efficient use of capital following sophisticated financial engineering practices. Thus, direct drivers enhance financial performance resulting in real value creation (Kitching, 1989).
Indirect Drivers of Value Creation
These are important non-operational drivers in a buyout transaction that also play a vital role in value creation. Being indirect drivers, they do not directly affect performance but they amplify and enhance the positive performance effects brought about by the direct drivers (Butler, 2001).
Thus, the above drivers relate to value creation in the post acquisition period with direct drivers affecting cash flows and indirect drivers enhancing the performance of the direct drivers (DeAngelo et.al., 1988). Apart from the post acquisition period, there remain ample scopes for value creation during the negotiation and acquisition process as well thereby implying that there exist other sources of value creation or value drivers in case of leveraged buyouts. These value drivers either relate to information asymmetries and capital market efficiencies or superior negotiation skills (Loos Nicholaus, 2005).
LBO- Performance Evaluation & Valuation Techniques
One of the most important components of LBO transaction is the financial evaluation and valuation of the target company. Just being a strategically good transaction is not enough unless the transaction is financially good (TSB, 2003). No company will go for a LBO unless it finds the target company advantageous strategically and financially. Financial valuation of the target company provides the base for the acquiring company to judiciously arrive at a ‘buy’ or ‘no-buy’ decision (DeAngelo et.al., 1988).
Thus, the significance of financial valuation cannot be doubted but as an activity, it is not as simple as it sounds. There exist different methods and techniques for valuation of a target company whose application requires good understanding of the overall buyout process. The Watson Wyatt Deal Flow Model, as shown in Figure-2.3, provides useful insights into the overall buyout process (See, Brunn Claus, 2007).
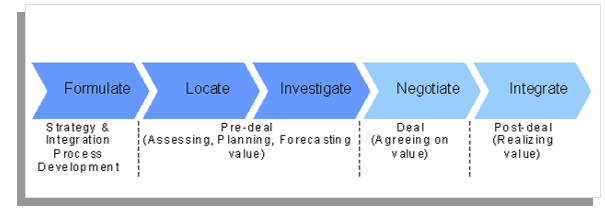
The above model can be used to identify where in the process the valuation takes place and consequently help to provide a better justification of the buyout process. The Watson Wyatt Deal Flow Model sub-divides the pre-deal part of the LBO process into four individual phases- formulate, locate, investigate and negotiate. The post-deal part of the process includes the integration phase that identifies the key activities to be done after the deal is signed (Galpin & Herndon, 2000).
The first phase or the formulate-phase requires the company to identify business strategy, set growth strategy, define acquisition criteria and start implementation of the strategy (See, Angwin & Savill, 1997).
Then comes the locate-stage where the company is required to identify and locate a potential target for acquisition. Once the potential target is located, the actual deal making process begins. The major involvements here are- identification of the target markets and companies, target selection, issuing letter of intent and conceiving a M&A plan. This is actually the stage when the company examines the possibility of value creation through the buyout. The third stage or the investigate-stage marks the execution of the initial due diligence process related to the target company. The due diligence needs to consist of financial, operational, legal, environmental, cultural and strategic analyses through which the acquiring company basically improves its understanding and insight of the target company (Galpin & Herndon, 2000).
Setting deal terms and conditions, framing legal obligations, sourcing key talents, finalizing integration terms and closing of the deal are some of the important activities taken-up in this stage. The fifth stage integrate is focused on the implementation and planning of the integration. This phase captures the total outcome of the entire buyout process starting from due diligence to the final and total integration of the two companies.
Total Financial Value
The sum of all equity (E) and debt (D) gives the total financial value of the concerned company, i.e.,
Vl = E + D
where Vl is the total value of the leveraged company and thus the value of a company may also be its signed debt. While taking debt, companies create tax shields calling for tax deduction in lieu of the interest paid on debt. This tax shield is an important aspect of LBO transactions. Now,
Vl = Vu + tcD
Where (Vl) is the value of the leverage company, which is equal to the sum of the value of the un-leavered company (Vu) and the debt tax shield (tcD). This tax shield created by interest qualifies for tax deduction thereby giving the company an opportunity for tax reduction by debt addition, i.e., by increasing its debt. A company’s earnings should be more than its expenditures in order to avoid bankruptcy and remain sustainable. There is a degree of uncertainty in this sustainability issue, which can scare the investors, suppliers and customers away thereby reducing future cash flow in effect. According to Koller et.al. (2005), this is distress or deadweight cost for tracking which, the rate of return on invested capital is the most important value driver for the company (Koller et.al., 2005). Thus,

where (NOPLAT) is the net operating profit less adjusted tax. The above expression gives the company’s ability to make more money than it spends. Therefore, value of an investment is profitable only when it earns a higher return than what is paid in cost of capital.
The literature shows several methods and techniques, which can be applied for making a valuation of a company. The main methods include- Comparable Companies and Comparable Transaction Analysis, Assets Valuation and Discounted Cash Flow (See, Sherman & Hart, 2006). Then there are- Price to Earning, Comparables and Multiples, Adjusted Present Value, Dividends Growth Model, etc. (See, Koller et.al., 2005). It may be noted that no single method can give a complete and correct picture, all can be questioned, and hence it is recommended to apply several valuation methods judiciously.
Price/Earnings (P/E)

The Price/Earning (P/E) ratio reveals the shareholder’s willingness to pay for a given return. Here the stock price is related to the earnings generated or the future expected earnings. Thus,

When the acquiring company acquires another company both having a lower P/E ratio, there is a rise in the earnings per share of the target company (Weston & Weaver, 2001). Then,
Where (g) stands for expected growth in earnings and cash flow; ® is the rate of return earned on investment and (k) is the rate of discount. According to Ross et.al. (2005), a normal P/E ratio as per empirical evidence is around 30. This P/E is basically a good indicator of how the market values the performance of a company. This ratio can be used as a valuation method provided some inherent limitations are taken care of. In case of a bull market having lots of opportunities, the general valuation and willingness to pay for a higher P/E ratio is normal but this may end up giving a too high value of the company (Ross et.al., 2005). This ratio is fit for use in case of companies listed at a stock market considering the needs for readily available numbers and figures to carryout calculations and comparisons.
Discounted Cash Flow (DCF)
According to Copeland et.al. (1990), this method provides a reliable and detailed insight into the value of the company (Copeland et.al., 1990) and this is why it has become the most trusted and utilized valuation method (See, Weston & Weaver, 2001). The present value of all the future free cashflows (FCF) generated by the company is basically the discounted cashflow (DCF), which can be calculated better by using this method. The calculated FCF when discounted with an estimated Cost of Capital (COC) assures that the cashflow generated is available to the providers of the capital (Copeland et.al., 1990).
This method accounts for time value of money and relative risk of investment but it is highly sensitive to the discount rate. The major steps under this method include projection of ‘free cash flows to firm’ normally for a period of five years and discounting back at an appropriate discount rate and determination of terminal value using multiples method and perpetuity growth method (See, Hamilton Lin). Forecasting FCF under this method needs different values like the EBITDA (earnings before interest, expense, taxes, depreciation and amortization), Net Income, NOPAT (net operating profits after tax), Cost of Capital (COC), etc. As shown in Watson & Weaver (2001), the total DCF can be calculated by (Weston & Weaver, 2001)-

Where (k) is the cost of capital and (n) is the sequence of years. This leads to the total of all individual future free cashflows (FCFs). The resultant number or value gives an indication as to what the future value of the company is worth and what the present value of the company is.
Weighted Average Cost of Capital (WACC)
WACC is basically the discount rate used to discount a series of future values to the present values and selection of this discount rate is very important in case of DCF analysis. WACC calculation requires inputs like- interest rate of debt (cost of debt), interest rate of preferred (cost of preferred), cost of equity estimate, measuring the systematic risk of a security (Beta) and approximated cost of equity (using CAPM, Capital Asset Pricing Model) (See, Hamilton Lin). In case of application of WACC, the company is assumed to be simultaneously financed by both debt and equity and thus, the cost of capital (COC) here is a combination of weighted debt and weighted equity.
According to Koller et.al. (2005), WACC is the time value of money used to discount expected future cashflows (CFs) to the present value and besides being reliable, it is quite a simple valuation method (Koller et.al., 2005). The relationship between debt and equity changes with the changes in financing over time and naturally WACC does the same. This implies that the WACC has to be adjusted and recalculated every time there is a change in the financing of the company (See, Ross et al. 2005; Koller et al 2005). The formula to calculate WACC after tax is-

Where (S) is equity, (B) is debt and (tc) is tax rate.
Adjusted Present Value (APV)
In case of the changing capital structure, APV is the best alternative to the WACC, which values the cash flow of the capital structure (tax shield) separate from the capital structure (Ross et.al., 2005). Thus, the APV method can be represented separating the operation into two components as below-

The value (APV) of a project of the leveraged firm is equal to the summation of the value of the project of an un-levered firm (NPV) and the net present value of the finance side effects (NPVF). The side effects may include- the tax subsidy to debt, cost of new debt issue, the cost of financial distress and subsidies to debt financing (Koller et.al., 2005). According to Damodaran (2002), in case of the APV method, the valuation takes place in three steps (Damodaran, 2002). Estimated first is the value of an un-levered company, company having no debt i.e., it’s a total equity financed company. The formula is-
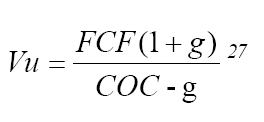

Where (Vu) is the total value of the un-levered company and (g) is the expected growth rate. The un-levered cost of equity that is similar to the cost of capital (COC) needs to be estimated here and for this, the systematic risk (β) has to be calculated using-
Where βunlevered is the un-levered beta and βcurrent is the current equity beta of the company; T is the tax for the firm and D/E is the current debt to equity ratio of the firm.

The second step involves calculation of the expected tax shield considering tax savings as perpetuity following-
Where (tc) is the marginal tax rate, which is assumed to be constant in time.
The last step deals with the estimation of the expected bankruptcy cost and the effects. The present value of bankruptcy is calculated as the probability of bankruptcy times the cost of bankruptcy. This step requires good judgment and qualified guesses for the bankruptcy factors (Ross et.al., 2005).
Valuation Techniques- Advantages & Disadvantages
There are different valuation methods and techniques all of which have advantages and disadvantages of their own as listed in Table-2.4 below.
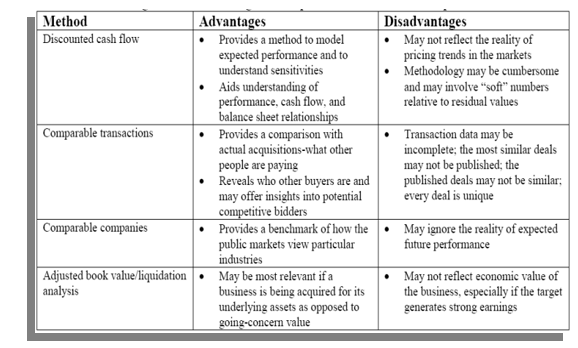
As mentioned earlier, no single valuation is sufficient and 100% accurate. Out of the different valuation methods, some are somehow better then the rest but again, selection of methods, proper application, availability and reliability of the required inputs are prerequisites to successful buyout valuation.
Previous Studies on LBO- Contributions & Evidences
As mentioned earlier, LBO is not a new phenomenon for the business and academic communities. Our first acquaintance with LBO dates back to the 1960-1970s however it gained popularity only during the 1980-1990s when the business sector went on to adopt the LBO route realizing the strategic utility and value addition potentials of the leveraged buyout process. Today, LBO is considered to be a strategic asset for a modern organization.
Paper – I: “Accounting Numbers as Market Valuation Substitutes”
Paper-I is a study carried out by DeAngelo Linda Elizabeth titled ‘ Accounting Numbers as Market Valuation Substitutes: A Study of Management Buyouts of Public Stockholders’. This has been a very well recognized and extensively referred research work since its publication in 1986. The early 1980s actually mark the second phase of LBO introduction in the business sector when the leveraged buyout process came under the scanner facing severe criticisms and negative vibes from all stakeholders, especially from the public stockholders. The public stockholders then claimed that the management buyout process unjustifiably favors the insider managers thereby victimizing them in the process.
Highlighting the severe conflicts between them and the insider managers, the public stockholders alleged that the leveraged buyout practices provide scopes for the managers to manipulate incomes or earnings thereby reducing the final buyout compensation in effect. In case of management buyouts, the insider-managers play the twin roles of business negotiator and share purchaser consequently having total control in both the initiation and finalization stages of the buyout transaction or deal. The manager first negotiates the fare value for the publicly held shares and then he goes on to purchase the same shares at a suitable price or buyout compensation.
This means, the manager is both the seller and the purchaser of the publicly held shares on sale. The fair value of the common shares is arrived at based on the financial details of the company the manager provides.
Therefore, the manager can manipulate and alter company’s financial details in such a way that the resultant share compensation or the final buyout value gets reduced to his advantage (Longstreth, 1983).
This study of DeAngelo provides practical insights on LBO transactions and addresses the above question. A total of 64 firms listed in the New York and American Stock Exchange have been selected for this study. All the selected firms were involved in management buyout of public stockholders during 1973-1982. The available theoretical knowledge indicates the possibility of income manipulation by the insider managers and confirms the existence of a conflict between the managers and the stockholders. However, DeAngelo’s empirical analysis does not support the above hypothetical conclusions that managers systematically understate earnings prior to actual management buyout and that this understatement is exposed by the systematic reduction in the total accruals.
The findings of this study are not in line with the findings of other studies like Healy (1983) who found evidence of income manipulation by the insider managers (Healy, 1983). However, these findings match with those of Liberty & Zimmerman (1985) who found no indication about systematic manipulation of earnings by the managers (Liberty & Zimmerman, 1985). Finally this study concludes that the managers did not indulge in any income manipulation because they knew that the financial statements of the LBO might come under severe scrutiny and examination by the stockholders. In this case, the managers did not tamper with the income figures fearing the consequences of being caught during scrutiny of the financial statements.
Paper – II: “Beatrice: A Study in the Creation and Destruction of Value”
‘Beatrice: A Study in the Creation and Destruction of Value’ is another important work initiated by George P. Baker in the year 1992. Here, Baker scans through the history of Beatrice, a small company founded in 1891, tracks its unprecedented growth and diversification brought about by strategic acquisitions and finally, takes stock of the leveraged buyout and sell-off initiatives of the company. Beatrice was more than 100 years old company which, starting as a small creamery, went on to become a diversified consumer and industrial products firm (Baker, 1992). This company was touted to be amongst the five best-managed companies in America.
Beatrice mastered huge growth and value enhancement through strategic acquisitions and it had flourishing business until the late 1970s. However, afterward it found itself entangled in some strategic and internal governance related problems causing substantial loss or erosion of value. Continuous erosion of value compelled Beatrice to go for financial restructuring and finally in 1986, it was taken-over by Kohlberg, Kravis and Roberts (KKR) through a leveraged buyout leading to the sale of all its assets with in the next four years. The company was involved in 400 acquisitions, 90 divestitures, 1 hostile takeover and sold over 40 units in divisional LBOs.
Thus, Beatrice had gone through many ups and downs. Different CEOs operating at different times adopted different strategies. Some succeeded in creating value for the firm while others failed. Taking on from here, Baker sought to identify the sources of value creation and the reasons for value erosion or destruction. Throughout its existence, the company exhibited exemplary corporate strategy and governance, organizational structures, organizational control and unique acquisition and divestiture decisions. Backer further contributed by analyzing the value consequences of the acquisition and divestiture initiatives of the company and providing insights on the issues, value impacts and the links between different corporate strategies, governance options, organizational structures and controls.
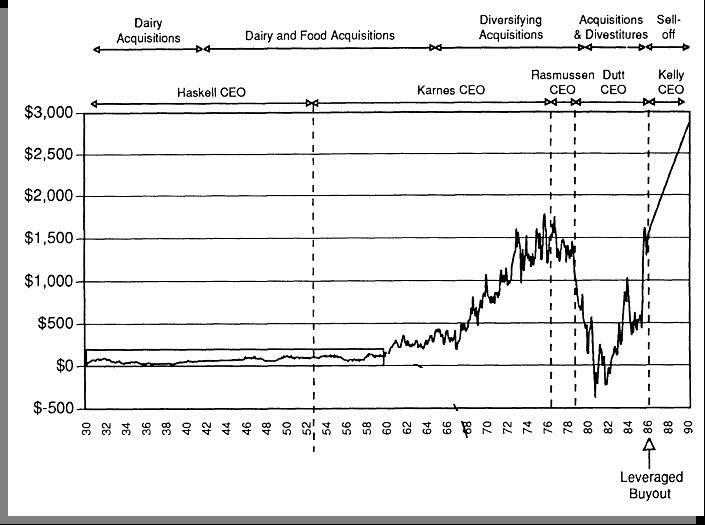
Figure-2.4 above shows the cumulative abnormal returns for Beatrice for the period 1930 to 1990. It also shows the acquisition, diversification, divestment and sell-off initiatives the company was involved in along with the tenures of different CEOs under whose control such initiatives were taken up. The figure clearly indicates that the major initiatives that created good value for the company were the acquisitions of the 1950s to 1970s followed by the divestures and the LBO taken-up later on. This study provides some important lessons and clarifies many issues pertaining to mergers and acquisitions.
The initial acquisition of dairy business was Beatrice’s response to the changing business environment and the company achieved phenomenal success by deriving economies of scale. This success testifies that consolidation is an economically viable and efficient strategy. The study also highlights the value of unrelated acquisitions. Beatrice also acquired foods, confectionaries, polymers and other sectors and continued with its geographical expansions.
This strategy also contributed to the success of Beatrice and provided good returns to its investors. Here Becker found that the success of Beatrice’s diversification strategy was aided by the organizational structure and systems of the company. The company’s success up to the early 1970s proves the utility of decentralized operation requiring least interference from the Headquarters.
However, flawed strategy saw the company loosing its value during the late 1970s and early 1980s. Centralized control policy adopted by Rasmussen and Dutt lead to destruction of value consequently pushing the company to fall prey to hostile corporate control activity in the capital market. Thus, this study highlights the importance of organizational structure and governance in value creation. The success of Beatrice can be attributed to the good organizational structure and governance policy adopted by the company and its failure was also an outcome of bad or inappropriate structure and governance policy.
Paper – III: “Controlling the conflicts of interest in Management Buyouts”
This is a study on ‘Controlling the conflicts of interest in Management Buyouts’ by Easterwood et.al.. This study investigates the controversies and the conflicts of interest that arise in case of management buyout where the manager bids to acquire the firm, which he manages. Such transactions were quite common during the 1980s when many firms went for converting their public stock ownerships to private ownerships. In such cases, the managers preferred to play the twin roles of managing the company as well as bidding and acquiring the company through buyout. (Easterwood et.al., 1994).
Participation of the management in the buyout bid leads to conflicts of interest. Here, the fiduciary duty of the manager demands him to go for the highest possible price from a buyout whereas his role as the acquirer or purchaser demands him to go for the lowest possible buyout price in his self-interest. Thus, managers face a dilemma in case of management buyouts owing to the inherent conflicts of interest thereby making it tough to decide on the buyout price, which is economically most suitable and beneficial for the managers. Thus, controlling managerial conflicts of interest is a very important issue in case of a management buyout and this happens to be the focal point of this study. Easterwood et.al. sought to investigate the roles and links of institutional and market factors in minimizing managerial conflicts of interest. They investigated as many as 184 management buyouts to arrive at these three important points-
- pre-buyout shareholders’ returns are grater when managers bid against outside acquirers;
- competition induced bid revisions stand higher compared to shareholders’ litigation induced revisions; and
- incidence of competition is negatively related to the pre-buyout share holdings of the managers.
This paper mainly contributes by examining the role of alternative mechanisms to control the price of management buyouts. Examining the abnormal returns of the management buyouts, the authors concluded that the pre-buyout stockholders earn larger abnormal returns in contested buyouts compared to the buyouts facing no competitions or hostile bids. They also found that after the announcement of explicit competitive bids, revisions are quite larger than shareholder litigation or negotiation associated revisions. Incidence of explicit competition gets reduced in case of large managerial holdings and this reduction in explicit competition leads to reduction in overall return to pre-buyout stockholders.
This means, large managerial holdings imply lower abnormal returns whereas small holdings imply higher abnormal returns. Thus, this study contributes immensely to our knowledge and understanding of the issues and intricacies of management buyouts. The study drives home the fact that management buyouts with explicit bidding competition generates higher stockholder returns, higher offer revisions and most importantly, may aid in controlling buyout offer prices.
Paper – IV: “Do LBO supermarkets charge more?”
The paper taken-up for review is ‘Do LBO supermarkets charge more? An empirical analysis of the effects of LBOs on supermarket pricing’ by Judith A. Chevalier published in the Journal of Finance (Vol. 50; No.-4) in 1995. This paper investigates the shifts in supermarket prices in local markets brought about by supermarket leveraged buyouts (LBOs). There has been extensive use of leveraged buyouts as a strategic move by most of the firms during the late 1980s drawing the attention of the researchers and financial experts.
There exists substantial volume of literature and empirical research pertaining to LBOs majority of which focused on investigating the effects or impacts of leveraged buyouts on firm’s performances and financial expenditures. For example, Kaplan (1988) investigated the impacts of LBOs on the operating performance of the firm (Kaplan, 1989), effects on firm’s capital expenditures evaluated by Smith (1990) (Smith, 1990), impacts on R&D assessed by Long & Ravenscraft (1993) (Long & Ravenscraft, 1993) and Lichtenberg & Siegel (1990) studied the influence of LBOs on employment and compensation (Lichtenberg & Siegel, 1990).
However, this paper is quite different from the above studies considering the fact that Chevalier attempted to investigate and evaluate the impacts of LBOs on the pricing and output behavior of the firm. Using the supermarket industry data at both the local and firm levels, Chevalier carried out this important study the findings of which contribute to our understanding on how LBOs affect the pricing behavior of the firms and their rivals. Focusing on a single industry in a cross-section of the local markets, Chevalier provides insights on the affects of LBOs on the pricing in different markets having different competitive characteristics. This is very crucial for the understanding of the behavior of LBO firms.
The evidences and the findings of this study confirm that the price increases in local markets executing supermarket LBOs when the rival firms in the market are also highly leveraged. This observation indicates that LBOs create the avenues and provide incentives to raise prices. Chevalier’s investigations also reveal that price decreases following LBOs in local markets when the rival firms are not highly leveraged and when a single firm holds large share of the local market. This fall in price can be linked with LBO firms exiting the local market thereby indicating that rival firms attempt to kill the LBO firms.
The findings of this study appear to be consistent with the earlier findings (See, Phillips, 1995). Thus, chevalier’s findings support the hypothesis that there is a linkage between firm capital structure and product market competition. The study also highlights the possible predation motives of the rival firms. Finally, the paper concludes that non-LBO supermarket chains charge inefficiently low prices and despite the benefits, leveraged buyouts are costly to the firms engaged in product market competition leading to suboptimal market investments.
To sum up, this study contributes to extend our knowledge on leveraged buyouts particularly providing evidence-based insights on these three points- impacts of LBOs on product market behavior, possible occurrence of predation and empirical proof of the linkages between capital structure and product market.
Paper- V: “Equity Valuation and Corporate Control”
Here we take stock of DeAngelo’s work on ‘Equity Valuation and Corporate Control’ carried out during 1989-90. Considering that there exist substantial differences between open-market stock prices and equity exchange values, the author went on to investigate equity valuation in case of corporate control transactions (DeAngelo, 1989). Like Paper-III, this paper also dives deep into the manager-stockholder conflicts usually engendered in transactions having corporate control. Initiatives like management buyouts and hostile takeovers breed severe conflicts between the managers and the stockholders, which in turn call for independent assessments of equity values by the investment bankers.
This paper contributes to our knowledge on manager-stockholder conflicts resolution and equity valuation. To this end, DeAngelo’s work provides evidence on the valuation information used by investment bankers to evaluate the fairness of a large sample of management buyouts along with scrutinizing their valuation techniques via a detailed case study of working papers on valuation particularly contributed by the investment bankers. Finally, the paper establishes the fact that this demand for accounting information in equity valuation is distinct from that previously recognized in the capital markets or contracting literatures.
This paper presents evidences and insights on the accounting and valuation process of MBOs and also proves the hypothesis on stockholder wealth. Here, it has been confirmed through evidence that accounting information influences the valuation process for management buyouts (MBOs). This in-turn proves the hypothesis that accounting information affects real resource allocation and hence the stockholder wealth. Our impression on accounting information we previously gathered from the capital markets and contracting literatures stands altered following the findings of this study indicating that it plays a more significant and extensive role in controlling manager-stockholder relations in case of MBOs.
Here, the role of accounting information extends beyond just managerial wage, debt contracts and political process as identified by Watts & Zimmerman (1986) (See, Watts & Zimmerman, 1986). Accounting information requirement in case of equity valuation serves different purpose conceptually, which is broader than just restricting attention to open-market stock prices as evident in the capital markets literature.
Paper- VI: “Management Buyout Proposals and Inside Information”
The paper considered for review is Scott D. Lee’s work on ‘Management Buyout Proposals and Inside Information’ published in the Journal of Finance (Vo. XLVII) in 1992. In case of a management buyout, some investors along with some incumbent managers join hands to buy all the outstanding common stock eventually transforming the firm into a private entity. In this case a manager plays the dual roles of a regular manager as well as the buyer or purchaser and this situation leads to criticisms and conflicts of interest as we have seen in case of Paper-III (Section-2.5.3) (See, Easterwood et.al., 1994).
The manager being a key position of a company is expected to have access to important internal information about the company. This information advantage again sparks off criticism alleging that managers use company’s internal information for framing and scheduling buyout proposals to their advantage.
Scott (1992) attempted to investigate the influence of internal information on the management buyout proposals. Taking note of and expanding on DeAngelo & Rice’s work on information impact in buyout proposals, the author selected 118 withdrawn management buyout proposals to explore and examine the shifts in their stock pricees just before the actual buyout proposal announcement and after the buyout withdrawal announcement (Scott, 1992).
This examination of stock price behaviour has been carried out to see if the managers actually have any information about the value of the firm particularly when they propose a buyout. The intention was to figure out if the proposal announcements made by the managers expose any information which is unrelated to the efficiency gains associated with completed buyouts. Further, the author went on to propose and test two hypotheses- the control transfer hypothesis and information hypothesis.
The findings of this study are consistent with that of DeAngelo & Rice (1984). The study contributes to the fact that average cumulative abnormal returns are positive and well pronounced during both buyout proposal and withdrawal announcement periods for firms having already exercised buyout withdrawals. Further, it unearths one important rider specifying that positive returns are attributable to only such firms, which receive other acquisition bids. In case of firms receiving no other acquisition bids, the average cumulative abnormal returns are indistinguishable from zero. Scott (1992) has also highlighted the fact that the reasons for buyout withdrawal as stated by the managers influence the average abnormal returns.
It has been indicated that managers withdrawing buyout proposals and managers completing buyouts. The findings indicate the possibility of manager’s inside information motivating buyout proposals. Interestingly, the findings of this study do not support the information hypothesis. There are no concrete indications about leakage of inside information pertaining to firm value. Finally, the paper concludes that manager’s buyout proposal may not necessarily be motivated by inside information about firm’s value.
Paper- VII: “Management Buyouts: Evidence on Taxes as a Source of Value”
This paper is ‘Management Buyouts: Evidence on Taxes as a Source of Value’ by Steven Kaplan, published in The Journal of Finance, Vol. 44, No. 3, December 28-30, 1989. This is another very extensively referred piece of work whose significance lies in its contribution proving that tax benefits are an important source of the wealth gains in case of management buyouts (Kaplan, 1989). In a MBO, a premium more than 40% above the prevailing market price is paid by the buyout investors to the pre-buyout shareholders in order to take the company private (See, DeAngelo & Rice, 1984). Here, Kaplan sought to highlight the importance of tax benefits by exploring the links between tax benefits and premiums or wealth gains.
His study concentrated on 76 management buyouts of publicly owned companies completed during 1980 to 1986. Two sources of tax benefits have been scrutinized here- tax benefits from large interest deductions due to large debt for financing MBO and benefits due to increase in tax basis of assets from historical basis to the combined value of purchased equity and the firm’s outstanding liabilities.
The findings of this study support the hypothesis that tax benefits are an important source of wealth gains in management buyout transactions (Kaplan, 1989). Combined tax benefits from increased interest and depreciation deductions have been estimated using data provided to the public shareholders at the time of the buyout. The median value of tax benefits for the sample of 76 MBOs based on the measure used varies from a lower bound estimate of 21.0% to an upper bound estimate of 142.6% of the premium paid to the pre-buyout shareholders. Evaluation of the actual post-buyout tax and debt repayment of the sample companies finds actual debt repayment pattern to be matching in keeping with the relatively high debt levels and eventually the companies paid no federal taxes in the first two years.
Notably, most of the buyout companies do not have tax loss carry-forwards. The speed of debt repayment and the strong relationship between total tax deductions and the premium paid amply indicate that tax benefit is important source of wealth gains in management buyouts. Kaplan also calculated the capital gains tax for the sample companies using the provisions of the tax law applicable during that period. His calculations found the sample to have a median value of about 15% of the premium paid to pre-buyout shareholders indicating that a portion of the buyout tax benefits are used up to counter the cost of the capital gains tax.
Finally, the net effect of management buyouts on tax revenues of the US was calculated taking into account this cost of the capital gains tax and other required parameters. Considering the Tax Reforms Act (TRA) 1986, the maximum corporate rate stands changed from 46% to 34% thereby lowering the maximum tax benefit of interest deductions from 46% to 34%. Importantly, any changes in the TRA do not necessarily reduce the lower bound estimates based on a marginal tax advantage of 15%, the median value used in this paper.
Kaplan concludes that the effective elimination of the step-up basis ability will reduce the tax benefits in case of some transactions and may even reduce the premium paid to the prebuyout shareholders. Thus, tax advantages were always there in case of management buyouts however, this advantage decreased marginally under the TRA of 1986. In any case, this will not put an end to buyout activities.
Paper- VIII: “Management buyouts of divisions and shareholder wealth”
The paper considered here is ‘Management buyouts of divisions and shareholder wealth’ by Hite G.L. & Vetsuypens M.R. published in The Journal of Finance in 1989. This paper investigates the influence of divisional management buyout proposals on the wealth position of the shareholders of the parent company. Actually, the paper investigated the shareholder wealth effects associated with asset sales to corporate insiders (Hite & Vetsuypens, 1989).
In such transactions, the objectives of the management and the shareholders are quite different. Characteristically, management buyouts of divisions are akin to going-private transactions having no scopes for arm’s length bargaining between the buyer and the seller. The authors scrutinized a sample of 151 management buyouts of divisions to conclude that parent company shareholder, on an average, do not lose from such asset sales.
The study contributes to the evidences that parent company shareholders on an average find abnormal returns of 0.55% during the first couple of days following the announcements of divisional buyouts. Statistically, this return is quite significant while the gains are relatively small. The authors however observed that the gains are not much smaller compared to the average gains of 1.12% as they worked out for a sample of 468 inter-firm divestitures during the same time-period.
The findings prove the hypotheses that like other sell-offs, management buyout of divisions is an efficient option for reallocation of corporate resources to higher valued uses and such transactions facilitate the parent company shareholders to share the benefits expected to be brought about by the change in ownership. The paper also highlighted that management buyouts of divisions lead to the emergence of privately held corporations with new organizational forms, which are capable of competing with the publicly traded corporations. The study confirms the utility of change in ownership structure owing to the productive gains following potential reductions in the costs of decision management and decision control functions within the public corporation. Such gains make the closely held corporation a viable alternative to the public corporation.
Thus, it is clear that divisional buyouts can lower the costs of the decision management function to the parent company managers by reducing the variety and number of decisions to be made. The complexity of the transactions can be reduced through subsidiary buyouts by giving decision-making authority to the acquiring managers under the supervision of the executives of the parent company. The decision control functions also undergo improvements through modifications in incentive compensation.
Paper- IX: “The Determinants of Leveraged Buyout Activity”
The paper reviewed here is the work of Opler & Titman titled ‘The Determinants of Leveraged Buyout Activity: Free Cash Flow vs. Financial Distress Costs’ published in The Journal of Finance, Vol. XLVIII dated December 1993. The paper contributes to the investigation of the determinants of leveraged buyout (LBO) transactions. The authors went on to compare firms having implemented LBOs and firms having no LBOs in order to identify the determinants of LBO initiatives (See, Opler & Titman, 1993).
Aiming to investigate whether LBOs create wealth or just redistribute wealth, this paper takes on LBO transactions to examine the depth of motivation on account of expected benefits of incentive realignment and the depth of hindrance faced on account of possible financial distress. Opler & Titman sought to test two hypotheses through this study-
- transactions are motivated to create and not just redistribute wealth
- the impact of economic distress on the viability of leveraged buyout firms are overstated.
The authors analyzed variables that facilitated cross-sectional differentiation of the importance of incentive realignment for the LBOs vis-à-vis the importance of the financial distress.
To this end, Tobin’s q and cash flow for LBO and non-LBO firms have been estimated followed by an additional variable, which interacts with the q and cash flow. This actually tests the free cash flow theory of takeovers implying the existence of an important interaction effect between the variables. In contrast, the financial distress cost theory does not imply that the interaction between the two variables is necessarily important. The findings support the fact that firms having high ‘q value’ are better managed and are possibly less prone to the free cash flow problem. Additional variables distinguishing the agency cost theory and the financial distress cost theory considered here are research and development (R&D), expenditures and selling expenses.
The paper as a whole contributes to the stock of knowledge about the free cash flow theory and the financial distress cost theory. The results indicate that free cash flow problems and the financial distress costs are important determinants for firms undertaking LBOs. It is clear that firms having high cash flow and low Tobin’s q are the ones expected to engage in LBO initiatives. This basically proves the free cash flow hypothesis.
The cost of financial distress is generally found to be highest among firms with unique products that may call for future service. Notably, LBO firms have been found to have relatively low R&D expenditures and are never expected to get involved in manufacturing activities and this is inline with the financial distress cost hypothesis. Further, the paper also found LBOs to be more diversified compared to other firms. Stressing on the fact that financial distress costs discourage LBO initiatives, the authors highlighted the importance of debt financing for realizing the gains from going private. It is found that LBO firms use more debts for eliminating taxes. Finally, the paper concludes that debt relates to the incentive problems associated with free cash flow.
Paper- X: “Which takeover targets overinvest?”
The last paper reviewed here is ‘Which takeover targets overinvest?’ by Hendershott Robert published in the Journal of Financial and Qualitative Analysis, Vol. 31 in the year 1996. This paper contributes to fill the existing gaps in our knowledge pertaining to the overinvestment by the targets successfully acquired through leveraged transactions. The author investigates 213 targets drawn from successfully completed takeovers executed during 1985-1990 and provides evidence as to how the takeovers are biased against considering the overinvestment. Evidences have been found in case of targets using highly leveraged transaction to avoid takeovers. The findings confirm that restructurings mitigate the overinvestment problems of the targets thereby creating value in the process.
Through this study, Hendershott shows that the targets acquired by the bidders in case of successful takeovers cannot have above average free cash flow agency costs just like their bidders (Hendershott, 1996). Firms attempt to reduce their free cash flow by undertaking financial restructuring only when they face disciplinary bids. This restructuring is done in order to avoid the takeover.
Out of the 213 takeover, the highly leveraged transactions (HLTs) were screened for overinvestment. It was observed that prior to HLT, the firms were engaged in capital projects and acquisitions and they spent more in these areas compared to their industry peers. Notably, the firms initiated significant cuts in investment just after the HLTs and these cuts were very much correlated with the earlier industry-adjusted investment of the firms. Further, the target firms were also engaged in cutting down overinvestment as expected. These firms earned abnormal returns following the restructurings, which were again found to be highly correlated with the earlier industry-adjusted investments of the targets. The study also proves that post-HLT underinvestment is not a big problem.
Post-HLT investments of the firms were substantially lesser than their industry peers but they were also found to reduce their leverage and increase investments during the 3rd and 4th years after the HLT. Thus, underinvestment is a temporary phenomenon that can at most remain for four years only. Based on the study results, the author infers that target overinvestment plays an important role in the market for corporate control.
It was also concluded that managers, prior to any takeover threats, are expected to balance the personal cost of using debt in order to preempt any takeover bids. Thus, the free cash flow theory can explain as to why some firms become targets and defeat takeover attempt by restructuring and also explain why other firms never become targets in the first place. However, free cash flow theory cannot explain successful acquisitions very confidently.
Conclusions
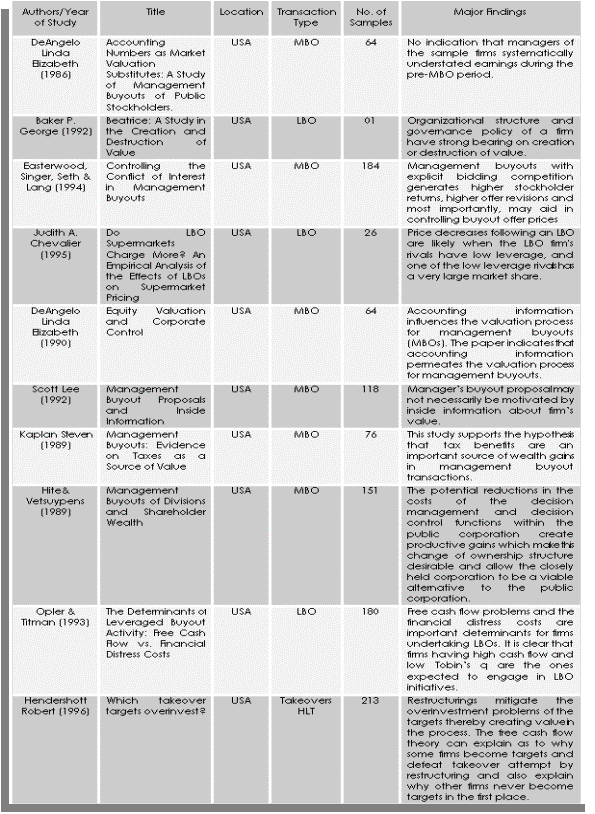
This chapter provides basic understanding about leveraged buyout initiatives running through the history of LBO transactions, transaction structures and LBO theory. Different LBO valuation methods and techniques have been reviewed discerning their merits and demerits. Finally, the chapter presents a thorough scrutiny and review of prior research works pertaining to LBO transactions brief details of which have been compiled in Table-2.5.
Empirical Research and Evidence
Introduction
Leveraged buyout (LBO) transaction is not as easy as it sounds. Going for LBO is not the end of struggle for a company, as all LBOs do not guarantee success all the time. LBO can make or break an organization or business venture. LBO transformed many small companies into big multinational and diversified organization through value addition on one side and on the other it pushed many big companies into bankruptcy and ultimate closure through value erosion. A large body of literature is available on LBO that puts forward related theories, concepts, valuation techniques, hypotheses and other approaches to LBO execution.
Besides theory, success of any LBO initiative depends on various externalities like market situation, manager’s skills, competition levels, geographical location and other practical factors. Thus, studying LBO under real business situation is a must for capturing a holistic view about LBO initiatives. Having reviewed the literature in Chapter-II, necessary theoretical knowledge and insights on research framework have been gathered sufficient for studying and analyzing LBO transaction under the real business set-up. This chapter attempts to conduct empirical analyses and investigations of different LBO transactions actually initiated during 1970s through 2006.
Complete information and data for each and every LBO transactions are not easily available thereby limiting the scope for transaction-by- transaction analysis. The study adopts an alternative approach of analyzing and evaluating ten (10) prior research works specifically related to LBO transactions as listed in Appendix-A. Besides discerning the findings and contributions of each of the papers, some emerging hypotheses have also been highlighted in this chapter. The following sections present the empirical investigations of each of the ten (10) prior-research works.
Empirical Analysis- Paper-I
In this study, DeAngelo investigates accounting decisions made by the managers of some firms listed in the New York and American Stock Exchanges. He initially selects 64 firms from ‘The Wall Street Journal’, which proposed management buyouts of public stockholders during the period 1973-1982. All the 64 proposals represent serious buyout endeavors resulting in a proxy statement that describes the acquisitions. At the time of the initial proposal, out of the 64 firms, 26 were listed in the New York Stock Exchange and 38 were listed in the American Stock Exchange. Further, out of the 64 proposals, 33 were for third-party leveraged buyouts and the remaining 31 had the incumbent management as the equity-holders.
Table-3.1 outlines the descriptive statistics for 64 management buyout proposals during 1973-1982. As shown in the table, the firms going private had a total asset of 212.74 8 million with the median firm having a total asset base of $70.825 million, much lesser than the mean value. The average sample firm had total revenues of 262.093 million with a median of $87.266 million. Also, the managers of the average sample firm owned 36.9% with a median of 36.3% of the firm’s common stock at the time of proposing the buyout.

At the time of buyout initiation, managers of 23 firms out of 64 held majority control while they held 37% of the common stock in the average sample firm. Before the public announcement of the buyout, the market value of the publicly-held common stock based on last day closing share price was $53.8 million for the average firms with a median of $11.153 million. Pre-buyout period saw the average sample firm’s common stock trading below the book value with a market-to-book ratio of 0.937 having a median of 0.730.
However, in case of financial leverage, the debt-to-asset ratio was 0.181 with a median of 0.145. As many as managers of 58 of the 64 proposals (90.6%) offered cash compensation for the public shares. The table also indicates that the final offer price to final annual earnings per share (P/E ratio) of 10.5 with a median of 10.4. The sample average P/E ratio roughly represents the effect of earning change on total buyout compensation considering fair value estimation by capitalization models.
The investment bankers and courts actually consider this P/E ratio as the average rate for earnings valuation. Considering this, managers with a P/E multiple of ten and having 37% of the common stock could avoid some $6.3 million in additional compensation. Thus, due to the PE multiplier, any understatement by the managers could have substantial impact on total buyout compensation. Managers have incentives for understating earnings and lower the buyout compensation but, the fear of external scrutiny and monitoring of their accounting decisions may stop them from doing this.
Hypothesis
“Managers who propose to take a public corporation private systematically understate reported earnings in periods before the acquisition”.
In case of LBO transactions involving managers, there may be some incentives for the managers to follow the accrual approach to LBO valuation. This accrual approach is very advantageous considering the fact that it can potentially reveal the subtle income-reducing techniques adopted by the managers. This approach is less subject to detection by the outsiders and hence managers resort to such techniques and approaches.
In general, any accruals like the accounting accruals reflect the decisions of the managers to write down assets, to recognize or defer revenues, and to capitalize or expense certain costs, such as repair expenditures. Moreover, such accruals also capture the effect of accounting estimates, changes in those estimates, and changes in accounting methods. Interestingly, any accrual as a whole contains both a discretionary and a nondiscretionary component. Syrnbolically, the total accrual in a given period t= 1, AC,, consists of a discretionary accrual, DA,, and a nondiscretionary accrual, NA I.
The empirical evidence presented in this paper, however, does not support the joint hypothesis that managers of sample firms systematically understated earnings before the management buyout, and that such understatement is appropriately measured by a systematic reduction in total accruals.
Empirical Research- Paper-II
Paper-II is the study by Baker (1992) that pertains to rise and fall of a well-known US company named Beatrice. Beatrice was more than 100 years old company which, starting as a small creamery, went on to become a diversified consumer and industrial products firm (Baker, 1992). This company was touted to be amongst the five best-managed companies in America. However, afterward it found itself entangled in some strategic and internal governance related problems causing substantial loss or erosion of value that compelled Beatrice to go for financial restructuring and finally in 1986.
The company grew from a small local creamery to a national company during the era 1890-1939. During the period 1940-1976, Beatrice went for diversification into non-dairy related products like foods, confectionaries, food service equipments and groceries. Following accelerated diversification, the company managed book value of assets of $66.7 million as shown in Figure-3.1.
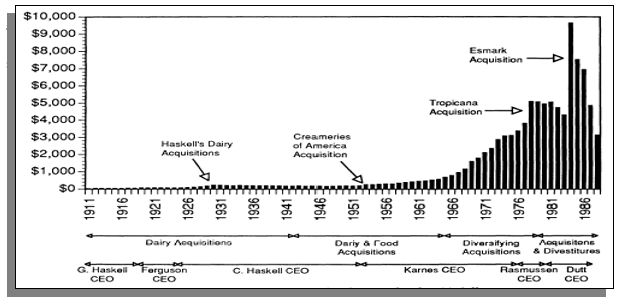
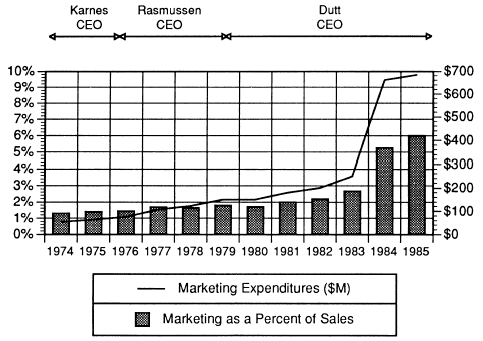
Karnes was the president and CEO of the company during this period when sales increased from $235 million in 1952 to $5.6 billion in 1976 and the total return to the shareholders was over 14% per year and the market also reacted favorably. 1977- 1986 marks the era of beginning of the end for Beatrice. Rasmussen and James Dutt were the two CEOs who operated during this period. Rasmussen preferred big acquisitions and increased marketing expenditures as shown in Figure-3.2.
James Dutt took over in July 1979 from Rasmussen who later abandoned the decentralization policy. During the tenure of Rasmussen and Dutt, the company lost almost $2 billion of market value (Figure-3.3) and its price earnings also declined (Figure-3.4).
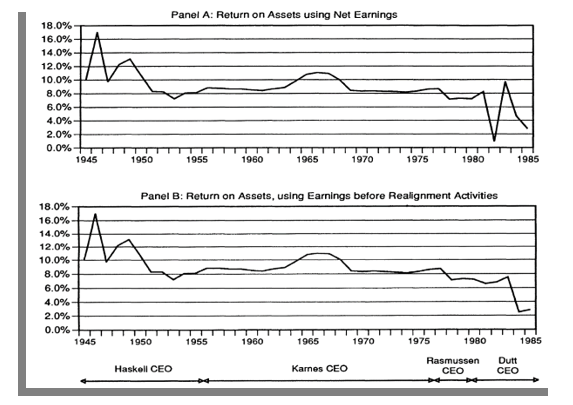
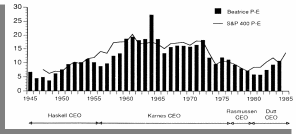
The period 1986-1990 marks the leveraged buyout and divestiture initiatives of the firm. Beatrice was involved in the then largest buyout following a bid from KKR and Kelly offering $50 per share. This bid interestingly helped the company to recapture the value it lost under Rasmussen and Dutt. The sources of the funds for the purchase, and the ownership fractions, which resulted following the Beatrice LBO are listed in Table-3.2.
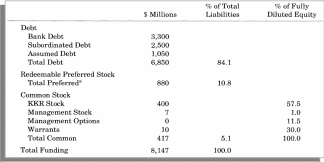
Once the LBO was through, Kelly promptly restored the decentralized organizational structure that Beatrice had earlier. He further reduced headquarters staff by 70% and streamlined all operations. One interesting observation here is that both Karnes and Kelly succeeded in creating value for the company. Karnes generated value through acquisitions whereas Kelly created value by divesting theme after 25 years.
Hypothesis
“Misunderstanding of the effects of conglomeration on the part of the capital market leads to increase in market value of acquired assets”
This value generation by divesting the same assets acquired 25 years ago leads to the hypothesis that “ misunderstanding of the effects of conglomeration on the part of the capital market leads to increase in market value of acquired assets”. This in-turn implies that the investors during the 1960s and 1970s were deceived and bluffed to accept the words of the managers and management theorists who falsely claimed that the asset would generate more worth follow the synergistic effects of centralized decision-making and capital allocation.
Any claim for such a synergy lacks merits and has no management foundation as such claims undermine the importance of detailed understanding of business operations thereby missing to predict that organization whose central management holds excessive decision rights and takes value diminishing decisions are destined to fail. In 1977 the market recognized the weakness of the conglomerate strategy thereby discounting Beatrice’s stock heavily. This discount resulted in substantial loss of value of Beatrice in 1979-1981 and also raised the stock as before when the firm changed direction in the 1980s.
Empirical Analysis- Paper-III
This study investigates the controversies and the conflicts of interest that arise in case of management buyout where the manager bids to acquire the firm, which he manages. The authors, Easterwood et.al. here examine 184 buyout proposals initiated during 1978-1988 all of which were identified from the Wall Street Journal Index (WSJ). Out of the 184 proposals, 149 were successful MBOs and the remaining 35 were unsuccessful MBOs which lost to outside bidders. In case of MBOs, the management being the bidder can protect itself from any competitive bidding and can also go for offering competitive bids as well facing severe market competitions.
The impacts of alternative control mechanisms have been assessed by using stock return data and offer prices. The impact of an MBO on the stock returns has been assessed through the analysis of stock return data using an event study methodology (See, DeAngelo & Rice, 1984). Then, cumulative abnormal returns were calculated from 20 days prior to the initial announcement date giving clear indication of the takeover activity for the very first time and the accumulation period continued until the offer price uncertainty resolution date.
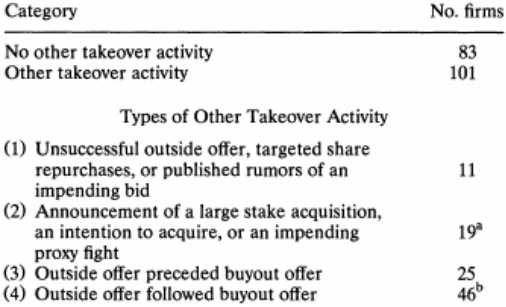
Then the impact of takeover activity on stockholder returns was assessed studying the association of outsider attempts at control with pre-buyout stockholder abnormal returns. The types and incidence of takeover activity the firms went through have been listed in Table-3.4. As the table shows, there are 83 non-takeover sample and 101 takeover sample. The average cumulative abnormal returns for firms stratified by the presence and type of competition accompanying the buyout offers are given in Table4.5 below. The mean cumulative abnormal returns for each group in the sample range from 25.9% to 43.7% and all means at the 1% level are substantially different from zero.
Hypothesis
“Mean returns to pre-buyout shareholders are equal for the takeover and non-takeover samples”.
Panel-A compares 83 nontakeover offers with the 101 takeover offers. This panel shows that stockholders achieve higher abnormal returns from buyouts with explicit competing bids or implicit outside competition. When the t-test is done it rejects the hypothesis that pre-buyout shareholders’ mean returns are equal for both takeover and non-takeover samples. On the other hand, Panel-B rejects the hypothesis the means and distributions of cumulative abnormal returns for the single bidder versus multiple bidder samples are equal. Panel-C shows 83 and 30 firms facing no outside competition and facing implicit competition.
Thus, the table shows an association between competitions through explicit outside bids and higher abnormal returns to the stockholders. However, there exists no association between implicit outside competition and higher abnormal returns as against the returns experienced by the buyouts stockholders involving no competition at all.
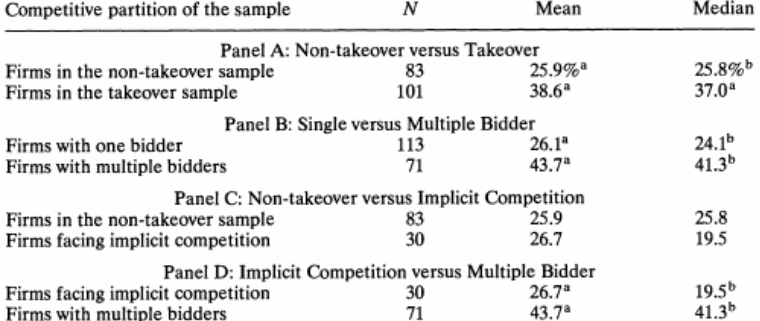
This difference between implicit and explicit outside competitions has been verified in panel-D of the above table, which indicates that the mean and median abnormal return subject to explicit competition are substantially higher than that subject to implicit competition. Thus, higher returns to the takeover sample can be explained by the 71 multiple bid contests and not by takeover activity. This finding indicates that competing bids may limit the ability of the management to pay prices unfavorable to the pre-buyout stockholders and the total buyout gains may determine the depth of explicit bidding competition. Thus, competing bids may occur in case of higher gains from a buyout thereby inducing a positive association between competing bids and pre-buyout stockholder’s abnormal returns.
The impacts of alternative control mechanisms on MBO bidding have also been analyzed here. The effectiveness of three control mechanisms in controlling underbidding has been assessed as well.

The three-control mechanisms are- outside directors as agents for stockholders, stockholder litigation and competing outside bids. Table-3.5 gives the statistics for revisions brought about by the three control mechanisms. The median and mean revisions are about 8% in case of negotiation, 5% and 7% in case of shareholder litigation and in case of competing bids the median and mean are 13% and 17% respectively as shown in the table. The values of the revisions clearly indicate that direct competition has a greater impact on buyout offer revisions compared to the other control mechanisms.
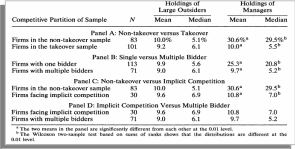
Assessment of the impact of firm’s ownership structure on the incidence and effectiveness of competition for buyouts has been carried out. Here, the ownership structure includes both the concentration of holdings of large outside stockholders and insider manager’s holdings as well. The ownership structure has been presented in Table-3.6 above.
It is clear from the table that the incidence of competition, be it explicit or implicit, depends on the size of managerial holdings. When the firm’s buyout faces little or no control of the offer, insider holdings are significantly higher but the level of manager’s holdings does not influence the form of competition. Moreover, outside ownership concentration has no association with the form or incidence of competitive behavior in buyout offers.
Thus, the empirical analysis of this paper reveals that explicit bidding competition in management buyouts leads to higher stockholder returns and higher offer revisions besides being an effective means of controlling buyout offer prices. The study also concludes that alternative control mechanisms like litigation, negotiation and competition threat have little effect on stockholder returns.
Empirical Analysis- Paper-IV
This paper investigates the shifts in supermarket prices in local markets brought about by supermarket leveraged buyouts (LBOs). In this study, the author attempted to investigate and evaluate the impacts of LBOs on the pricing and output behavior of the firm. Using the supermarket industry data at both the local and firm levels and focusing on a single industry in a cross-section of the local markets, this research provides insights on the affects of LBOs on the pricing in different markets having different competitive characteristics. For a city, the price changes following an LBO have been calculated using the change in the grocery price index of the city for the period quarter pre-LBO to six quarters post-LBO.
The means and standard deviations (SD) for all the variables have been listed in Table-3.7 and the post-LBO grocery price changes for the cities under study have been shown in Table-3.8 below. The table clearly indicates that prices neither rise nor fall unambiguously subject to initiation of LBO by a supermarket chain. The determinants of grocery price changes following LBOs are shown in Table-3.9.
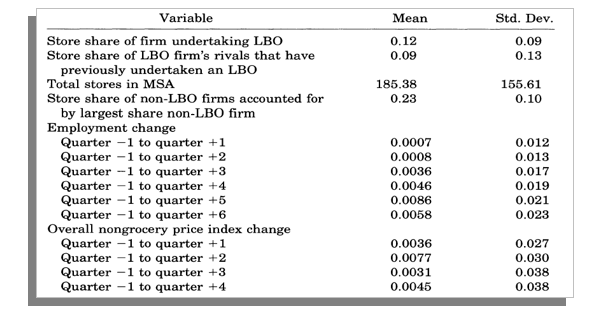
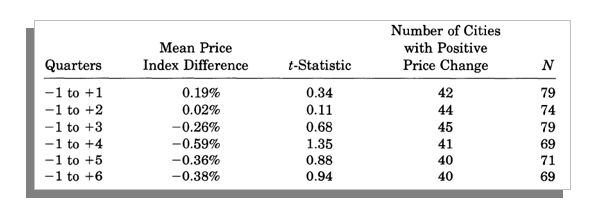
Table-3.9 shows the relationship between the percent change in the ACCRA price index and five variables the first two of which are control variables examining the change in grocery prices controlling for the overall change in prices in the city and for the health of the economy in the city. The variables of interest measure the extent that price increases would be accommodated which include- the store share of the firm undertaking the LBO, the store share of the LBO firm’s rivals in the city that had previously undertaken an LBO, and the share of non-LBO stores in the city accounted for by the non-LBO firm with the largest market share. Table-3.9 includes the results from the regressions of the percent change in the ACCRA index.
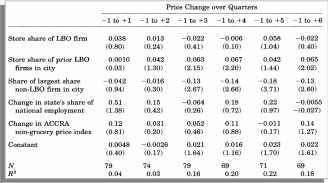
Hypothesis
- The agency view hypothesis states that ‘Firms maximize market share rather than profits prior to the LBO’ and
- The liquidity view hypothesis states that ‘LBO firms charge intertemporal profit-maximizing prices prior to the LBO and short-run profit maximizing prices after the LBO’.
- ‘Predation leads prices to fall following LBOs’.
The results in Table-3.9 indicate that prior to the LBO, the firms were busy maximizing market share given the incentive they have for raising prices following LBOs and this observation is consistent with the agency view hypothesis. Further, the results also suggest that the LBO firms were charging profit-maximizing prices prior to the LBO and charging short-run profit-maximizing prices after the LBO. This observation is also consistent with the liquidity hypothesis mentioned as hypothesis (ii) above. Hypothesis (iii) can be tested by examining the exit of the LBO firm following the LBO.
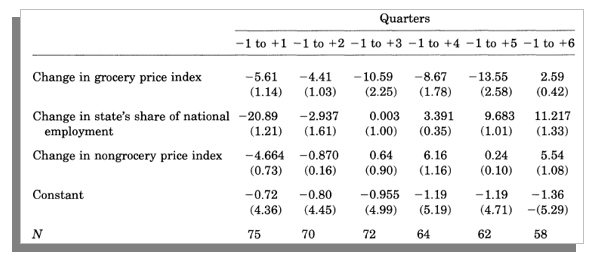
The exit data collected from reliable sources are matched with the available price data. As said earlier, exit happens when the LBO undertaking firm has no stores left in the city in 1993. The results of a probit specification are shown in Table 3.9 above where in the price changes in the quarters following the LBO have been considered as exploratory predictors of the exit that control for the overall change in price level for the city and also for the change in the state’s national employment share.
A close look at the price changes between the pre-LBO quarter and the post-LBO quarters indicates that the coefficient for the price change is negative as predicted for the 1st to 5th time windows and is significant at the 5% level for the price changes between 3rd and 5th post-LBO quarters. This proves that the firm would more likely seek to exit an area when prices fall in the post-LBO period.
An examination of the relationship between exit and price changes through the six pre-LBO quarters reveals that the coefficient of price change is statistically insignificant having the wrong sign for all of the time periods under the study. The results indicate that there is association between the post-LBO price changes and diminishing profitability of the local market of the LBO firm. Thus, supermarket pre-LBO price changes may have occurred due to reasons other than any change in the degree of competitiveness of the market thereby proving the hypothesis that falling prices following the LBOs are on account of predation.
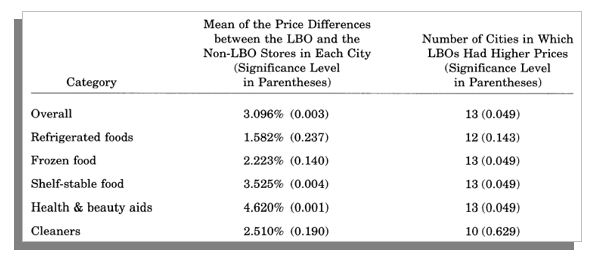
The price differences between the LBO and non-LBO firms in the same city as of 1992 have been tested as shown in Table-3.10 above. 17 cities have been considered here the results of which clearly suggest that the LBO firms happen to be the high priced firms in the corresponding cities and the LBO supermarket price level in a city is about 2.5% higher than that of the non-LBO supermarket. This study finally contributes to three important knowledge areas-
- results showing how product market behavior changes following LBOs extends our understanding of the effects of LBOs
- we now understand that predation occurs successfully, and
- the study provides empirical insights about the linkages between capital structure and product market.
Empirical Analysis- Paper-V
Taking into account the substantial differences between open-market stock prices and equity exchange values, this paper went on to investigate equity valuation in case of corporate control transactions (DeAngelo, 1989). DeAngelo selected 64 buyout proposals from the Wall Street Journal over the ten-year period 1973-1982. Out of the 64 buyout proposals, 31 had no third party equity investors and these non-leveraged buyouts involve firms predominantly controlled by the management.
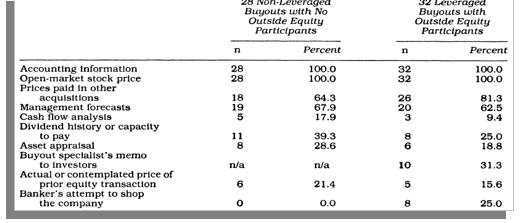
Table-3.11 above reports the information cited in the investment banker’s fairness opinion and/or management’s proxy discussion as influencing the buyout terms. The data for 28 non-leveraged buyouts and 32 leveraged buyouts have been shown in column (1) and column (2) respectively. 100% of the proxy materials cite accounting information as influencing the banker’s evaluation of the offer terms for both sub-samples and 100% also cites open-market prices as influential. Table-3.11 provides evidence indicating that investment bankers unanimously cite accounting information as influencing their fairness evaluation of management buyouts but the data do not indicate as to how accounting information is used in equity valuation.
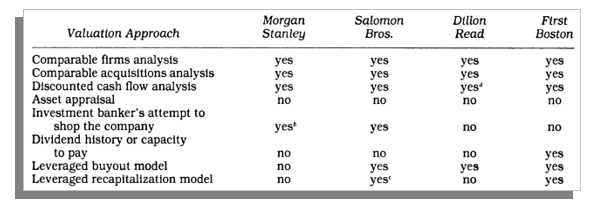
Table-3.12 categorizes the valuation approaches used by investment bankers. As evident, First Boston happens to be the only banker that uses the dividends capitalization approach to estimate the stock prices in case the company needs to remain publicly traded. The other three bankers perform a leveraged buyout analysis. In general, it is aimed to project net income under various scenarios following which interest coverage ratios are calculated using earnings and cash flows thereby assessing financial risk. The returns and sensitivities to equity investors are then calculated and assessed to changes in the underlying assumptions.
The summary valuation of one of the investment banker has been depicted in Table-3.13. The preliminary price range is $35-62 per share in case of First Boston’s summary valuation of Fort Howard Corp. done employing nine different valuation approaches.
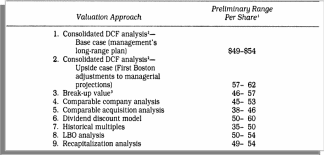
In case of Fort Howard buyout, First Boston estimated terminal values using three methods- a multiple of 1998 unlevered income, a multiple of 1998 book value and a perpetual growth model applied to 1998 cash flows. The terminal value estimates of First Boston include 53-71% of equity values estimated as a multiple of earnings, 56-73% of equity values estimated as a multiple of book value and 53-80% of equity values using a perpetual growth model.
First Boston’s DCF analysis gives the equity values of $49-62 as mentioned in Table-3.13 above. The terminal values assumed here are 14-16 times the 1998-projected unlevered net incomes including a discount rate of 12%. When the full set of assumptions are considered, the range of equity values widens to $39-133 and this, according to First Boston, demonstrates the sensitivity of the discounted cash flow analysis to terminal value assumptions.
This also highlights the preference for the earnings multiple approach. The table further indicates that First Boston also uses comparable company and comparable acquisitions techniques. Equity values of $45-53% are generated through company-wide comparable firm analysis and First Boston’s analysis of historical multiples generates values of $35-50 as the table indicates.
Extensive additional analyses also done by First Boston mainly on the PIE ratios of Fort Howard versus Scott Paper, James River and eleven other less-comparable paper companies. The comparable acquisition analysis describes the attributes of nine paper-industry acquisitions, which are not acquisition premiums, rather they relate to acquisition values subject to various accounting variables. First Boston reports acquisition values as a multiple of the last twelve-month net income, book value, sales, operating income and operating cash flow.
In case of estimating the traditional value of a company that need to remain public in unchanged form, First Boston uses a dividend discount model and this approach capitalizes future earnings. Further, the firm estimates trading values as the present value of expected dividends and terminal values under various discount rates. They also estimate trading values should the firm engage in a leveraged recapitalization.
Finally, First Boston performs a leveraged buyout analysis of the company under various assumptions to assess the financial feasibility of the proposed transactions. The general approach has been to project future earnings based on- long-range plan of the management, management’s projections considering divestiture of certain assets and upside scenario of First Boston. Table-3.13 reports a range of $50-54 based on assumed equity values under this approach. As per the leveraged buyout analysis done by First Boston, $54 stands out to be at the upper range of financial feasibility. The offer materials however mention that it would be difficult to finance a leveraged buyout at higher prices.
Thus, the available evidence does not allow determination of the precise effect of a given valuation method on the final transaction price of $53 per share for Fort Howard equity. $53 appears to be in the mid-range of equity values generated by First Boston. As many as six out of the nine valuation methods have $53 within the range. Only for DCF analysis, it lies below the range. Thus, the ultimate transaction price is constrained to fall within the range of values under the consideration of a broad variety of valuation techniques.
Empirical Analysis- Paper-VI
In this study, Scott D. Lee seeks to investigate the conflicts and criticism associated to management buyout proposals. In case of an MBO, a manager plays the duel roles of the regular manager as well as the purchaser or buyer leading to conflicts of interest. Manager, being a key position, may have excess to internal information of the firm, which the manager allegedly uses for framing buyout proposal to his advantage. Aiming to investigate the influence of internal information on the management buyout proposals, the author selects 118 withdrawn management buyout proposals to explore and examine the shifts in their stock prices just before the actual buyout proposal announcement and after the buyout withdrawal announcement (Scott, 1992). Out of the 118 firms, stock return data was available for 114 firms.
There were 58 firms receiving other bids between the proposal announcement and the two-year cutoff following the withdrawal announcement. Managerial reasons for withdrawal have been grouped into three categories as shown in Table-3.14 below. 14 cases were found where managers withdrew their buyout proposal because of a superior rival bid and another 48 cases found where withdrawals occurred in response to adverse information like rising interest rates, market volatility, economic uncertainty, etc.

There are 52 remaining bargaining impasse withdrawn following the board of director’s opposition for the management’s bid. Further, 20 firms belonging to the bargaining impasse category received other acquisition bids during the period from proposal announcement to two years post-withdrawal announcement. The remaining 32 firms qualify to be the best sample for testing the information hypothesis.
Hypothesis
‘Managers propose a buyout when they have favorable inside information about the firm’s value which is unrelated to the buyout transaction’ (Information hypothesis).
In case of information hypothesis, part of the positive stock price effects documented for withdrawn buyout proposals will persist even in the absence of subsequent acquisition bids. The information hypothesis predicts a permanent stock price revision attributable to the inside information revealed by managers’ buyout proposal. The test results do not support this information hypothesis. Firms do not experience lasting improvements in stock returns after withdrawal of their buyout proposals unless they receive other acquisition bids.
The size-matched index-adjusted stock performance measures (abnormal returns) and market-model risk-adjusted stock performance measures (prediction errors) are given in Table-3.15. These measures are cumulated over various event windows including both the proposal and withdrawal announcements of the withdrawn MBO proposals. For shorter intervals, the alternative method produce almost identical results but the results differ substantially in case of longer intervals. Notably, the market-model procedure seems to be less powerful than the size-matching procedure subject to the use of longer event windows.
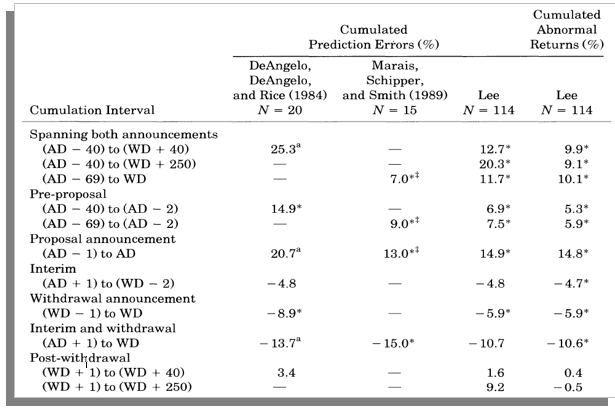
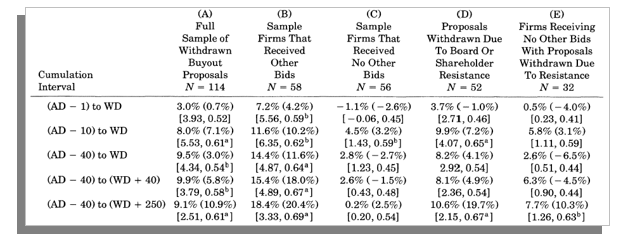
The effect of other acquisition bids and managers’ stated reason for withdrawal on the abnormal returns surrounding withdrawn management buyout proposals has also been examined. The abnormal returns for four subsets and the withdrawal buyout proposals sample have been shown in Table-3.16 above. These returns are cumulated for five overlapping periods spanning firm’s proposal and withdrawal announcements periods as depicted in the table.
The most persuasive evidence regarding the information hypothesis is associated with the 32 withdrawn buyout proposals which the stockholders resisted and which received no other bids. Here, the average abnormal returns cumulated across each firm’s proposal and withdrawal announcements are indistinguishable from zero as shown in Column-E of Table-3.16. Here surfaces another concern whether information asymmetry is less likely to be present in the firms whose buyout proposals were withdrawn than in firms whose buyouts are completed.
Four proxies of asymmetric information have been examined that include- analyst following, number of wholly-owned subsidiaries, firm size and market book value ratio. Considering that the success of MBOs depends on information asymmetry and the information asymmetry declines with analyst scrutiny then we can say that firms with completed buyouts should have a smaller analyst following than firms with withdrawn proposals. However, firms whose buyouts succeeded had significantly larger analyst followings than their counterparts whose proposals were eventually withdrawn even though firms receive analyst coverage as shown in Table-3.17 below.
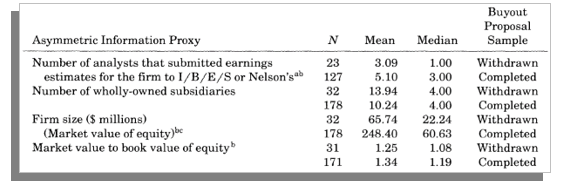
Further test indicates that the managers of buyout proposal withdrawing firms were likely to have access to inside information as managers of firms with completed buyouts. Thus, the results are of cross-sectional nature that does not allow to rule out the possibility that some buyout proposals are motivated by manager’s inside information. Getting no support from the results, the evidence can be said to be inconsistent with the notion that managers commonly propose a buyout when they have access to favorable inside information about the firm’s value.
Empirical Evidence- Paper-VII
In this paper Kaplan seeks to prove that tax benefits are an important source of the wealth gains in case of management buyouts (Kaplan, 1989). This research study considers the importance of tax benefits in explaining the premiums or wealth gains in 76 management buyouts of publicly held companies completed in the period 1980 to 1986.
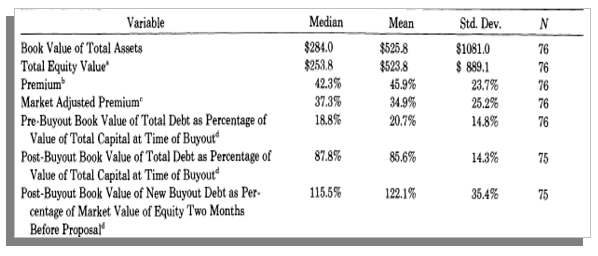
The summary statistics of the 78 sample buyout companies selected for this study are shown in Table-3.18 above. As per this table, pre-buyout shareholders of MBOs earn a median premium of 42.3% where the premium equals the difference between the final purchase price of the equity in the MBO and the market price two months before the initial announcement. The buyout companies experience very large increases in debt levels as revealed in the table. The median ratio of debt to total capital at the time of the buyout was 18.8%. The total capital is equal to the sum of market value of equity and the pre-buyout book values of total debt and the preferred stock. The median ratio of debt to total capital increases to 87.8% after the buyout.
The estimates of the value of interest deductions have been given in Table-3.19. The main assumption here is that all deductions can be used in the same year they are generated. The first estimate of the value of interest deductions, MaxDebt, multiplies the increase in debt associated with the buyout by the appropriate marginal tax rate implicitly assuming that the increased debt level will be maintained forever. In case of the estimation of the Repay debt, it is assumed that the additional debt will be repaid in level principal payments over the tenure of eight years.
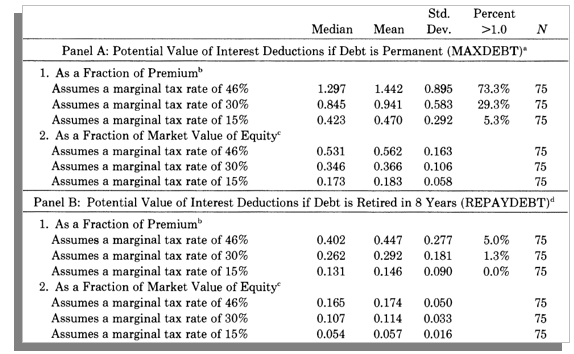
Table-3.20 presents the estimates of Asset Step-up as a fraction of the premium paid to pre-buyout shareholders and of the market value of equity two months before the buyout announcement. Companies are categorized by their step-up decision and in the proxy statements, 29 of the 76 companies in the sample announced that they would elect to step-up the basis of their assets. Another four companies expressed their willingness for such an election thereby making a total of 33 companies electing step-up. 29 companies confirmed that they will not go for step-up and the last 14 companies made no announcements and did not have a proxy statement available.
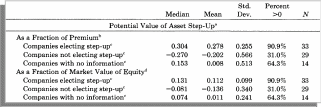
Another potential source of tax advantage in case of a MBO is the use of an Employee Stock Ownership Plan (ESOP). If money is borrowed through an ESOP, the principal repayments on the ESOP loan are tax deductible up to 25% of the eligible payroll. Out of the total 76 MBOs, only five MBOs use an ESOP as an integral part of the buyout. 84.4% of the additional debt created in those five buyouts is borrowed through the ESOP.
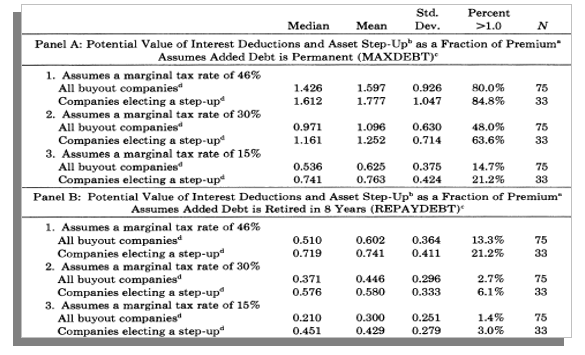
Table-3.21 adds the potential value of the interest deductions to the potential value of the step-up in basis and compares the sum to the premium paid to pre-buyout shareholders. The results of the table provide a wide range for the potential value of tax benefits in management buyouts.
Hypothesis
‘Tax benefits are an important source of the wealth gains in management buyout transactions’.
In Table-3.22, Panel-A presents the debt repayment pattern for the MBOs in the years surrounding the buyout.
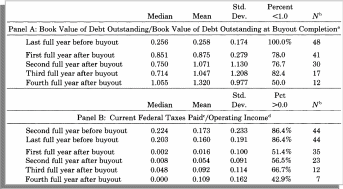
The book value of debt relative to total debt outstanding at the time of the buyout decreases to 85.1% by the first full year after the buyout (an average of 18months), to 75.0% by the second full year after the buyout, and to 71.4% by the third full year of the buyout. In this sample, the level of debt shoots up in the fourth year after the buyout to 105.5% of the total debt outstanding. This reflects the fact that four of the twelve companies borrowed money to repurchase equity in that fourth year.
Panel-B shows the level of current federal taxes paid for the MBOs from two years before the proposal to four years after the buyout. Current federal taxes measure the actual taxes paid by the buyout company to the federal government. This is a cash measure, not an accounting measure. The debt repayment results indicate that the value of buyout tax benefits exceeds the calculated RepayDebt value for a given marginal tax advantage. However, this buyout tax value will be less than the value of maintaining the debt forever, as is the case in MaxDebt. Finally, the results for federal taxes paid and for loss carry-forwards indicate that most of the buyout companies receive close to the maximum value of the deductions.
Empirical Evidence- Paper-VIII
This paper investigates the influence of divisional management buyout proposals on the wealth position of the shareholders of the parent company. Actually, the paper investigated the shareholder wealth effects associated with asset sales to corporate insiders (Hite & Vetsuypens, 1989). The authors scrutinized a sample of 151 management buyouts of divisions to conclude that parent company shareholder, on an average, do not lose from such asset sales. The descriptive statistics of the samples are shown in Table-3.23. Both the MBO sample and the interfirm divestiture sample have been shown and the two samples appear to be very similar. The firms are about the same size and the mean and median transaction prices are more or less identical for both the samples.
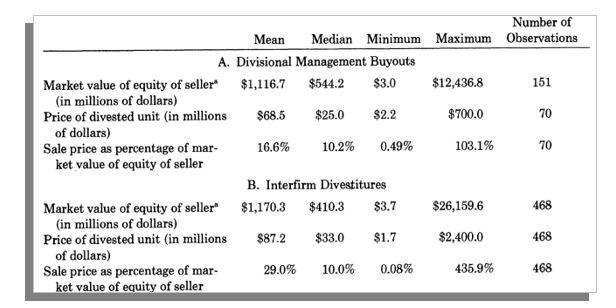
For estimating the effect of divisional buyouts on parent company shareholder wealth, the conventional event-time technique has been used. First, the prediction error for each firm j has been calculated for day t-

Where,
Rjt= the rate of return on stock j for event day t
R = αi and βj
mt= the rate of return on the CRSP value-weighted index for event day t.
The coefficients are the ordinary least squares estimates of the intercept and the slope of the market model regression. The market model regression was estimated for each firm from day t=-120 to day t=-20 relative to the buyout proposal announcement on day t=0.
In order to test for the significance of the prediction errors around the announcement date, the Dodd & Warner’s (1983) procedure has been followed. First each daily prediction error for each firm was standardized by dividing the calculated prediction error by its estimated standard error for that day. Then the standardized prediction errors have been aggregated for each firm for days –1 and 0, which are then averaged across the sample. Under the null hypothesis of no abnormal returns, the test statistic derived from the average of the individual firm cumulative standardized prediction errors will be distributed approximately unit normal.
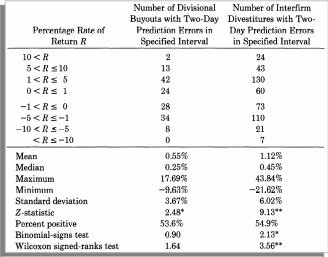
Table-3.24 presents the average announcement-period abnormal returns for the 151 management buyouts and the 468 interfirm divestitures having adequate returns in the CRSP daily return files around the divestiture announcements. In addition, various summary statistics describing the cross-sectional variations in the two samples have been reported here. In the two-day period around the announcement of management buyouts of divisions, the mean cumulative prediction error is 0.55% significantly different from zero at the 0.05 level. The median announcement-period abnormal return is 0.25 percent, and eighty-one out of 151 observations (54%) are positive.
At conventional levels, the binomial-signs test and the Wilcoxon signed-ranks test on the announcement-period prediction errors is not significant. Thus the parametric test statistic may be sensitive to several outlier observations and consequently it can be concluded that there is weak evidence to support the claim that shareholders of the present firms benefit from management buyouts of divisions. The gains are comparatively smaller but there exists no evidence to prove the hypothesis that shareholders are harmed by such divestitures.
The abnormal returns for the sample of interfirm asset sales are shown in the right-hand column of the Table-3.24 that reveals the mean two-day prediction error to be 1.12% and the median to be 0.45%. Moreover, the proportion of positive observations is 55% and here, both the binomial-signs test and the Wilcoxon signed-ranks test are found to be significant at conventional levels. So, the sample of interfirm asset sales is associated with larger mean abnormal returns compared to the sample of management buyout announcements. When the difference of the two sample means (1.12% & 0.55%)is put to conventional test, the two point estimates are not found to be substantially different from each other (when t-statistic, 1.39).
The chi-squared statistic testing for the equality of the median abnormal returns of MBO and interfirm divestiture samples is found to be 0.53, which is insignificant at conventional levels. Therefore, no evidence is found indicating that management buyouts of divisions are harmful to the parent company shareholders. There also are no indications that management buyouts produce substantially smaller average gains to the shareholders than what traditional divestitures produce to the unrelated buyers.
Now we understand that the privately held corporations emerging from management buyouts of divisions represent new organizational forms which compete with publicly traded corporations. This study highlights that the potential reductions in the costs of decision management and decision control functions within the public corporation create productive gains which make this change of ownership structure desirable. This in-turn makes the closely held corporation a viable alternative to the public corporation.
Empirical Evidence- Paper -IX
This paper contributes to the investigation of the determinants of leveraged buyout (LBO) transactions. The authors went on to compare firms having implemented LBOs and firms having no LBOs in order to identify the determinants of LBO initiatives (Opler & Titman, 1993). For this study, a total sample of 180 firms have been selected all of which undertook LBOs during the 1980 to 1990 period. Table-3.25 shows the year-wise number of firms and the mean book values. Some firms uncommon in the list of the LBO sample were also selected from the manufacturing panel to form the non-LBO control sample. Considering the span of 11 years during which these LBOs were initiated, the 11-year data sets can be broken down into two sub-samples- (1980-1984) and (1985-1990).
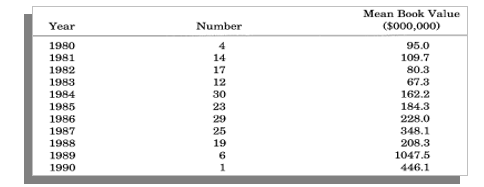
Hypothesis
The study seeks to accomplish its goals by investigating two principal hypotheses:
- [H1]– LBOs are motivated by the gains from realigning incentive problems associated with free cash flow, and
- [H2]– LBOs are deterred by potential financial distress costs.
In order to investigate the hypotheses, proxy variables for financial distress costs and incentive realignment potential have been considered and their expected relation to the incidence of leveraged buyouts have been outlined as given in Table-3.26.
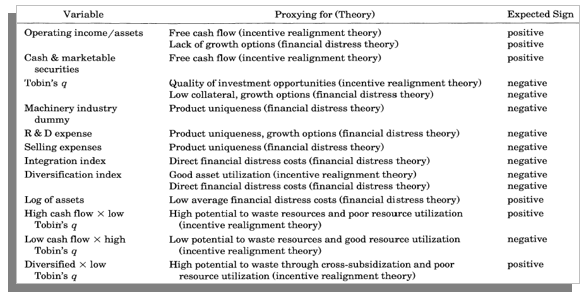
The matrix of the Pearson correlations between the explanatory variables as well as their correlations with a dummy variable has been presented in Table-3.27. The dummy variable actually identifies the firms that undertake LBOs. In both the subperiods between LBO dummy variable and the cash flow variable and the high cash flow/low q variable, there is a significant positive relation. The correlation of the LBO dummy with the Tobin’s q is found to be significant and negative in both the time periods while the diversification index appears to be important in the second subperiod only. Notably, the machinery industry dummy variable is negatively related to LBO incidence in both the subperiods, which is inline with the prediction of the financial distress cost hypothesis.
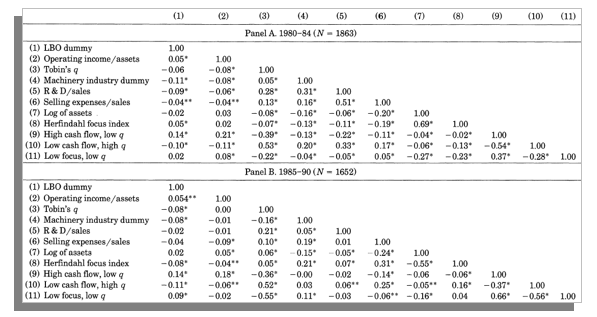
The R&D variable happens to be a significant predictor of LBOs in the first subperiod while the size variable is not significant in any subperiod. Thus, these correlations suggest that financial distress cost is a less-important deterrent to LBOs in the second subperiod.
The multivariate results are presented in Table-3.28 that reports coefficients from multivariate logit regressions using all variables. The results show that after controlling for other effects, firms with high cash flow variable are not statistically significant in any of the subperiods. The coefficients of Tobin’s q are not statistically significant as well.
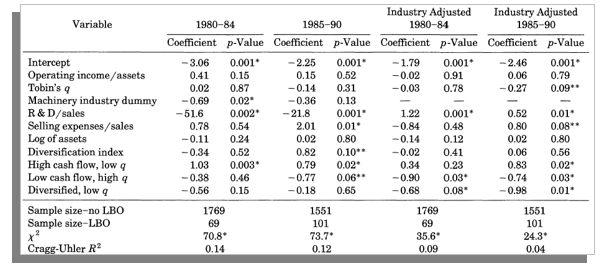
The coefficients on the cash flow variable remain statistically insignificant in both the subperiods following industry adjustments. Interestingly, the coefficient on Tobin’s q is negative and statistically significant during 1985 to 1990 and this is consistent with the free cash flow and the financial distress cost deterrence hypotheses.
The dummy variable, which identifies high cash flow and low q, is statistically significant in the first two logit regressions as shown in Table-3.28 above thereby supporting the free cash flow theory in both the subperiods. In the same way, the dummy variable identifying firms, which are unlikely to have free cash flow problems (low cash flow & high q) has a significant negative coefficient in both subperiods. It may be noted that none of the coefficient estimates for these variables differ significantly in the two subperiods.
The results of Table-3.28 signify the theory that potential financial distress costs deter LBO activity. Firms with high R&D expenditures and firms from the machinery industry were less likely to undertake LBOs. This evidence is comparatively much prominent in case of the earlier subperiod and this supports the financial distress hypothesis. Both the subperiods show positive coefficient of selling expenses, which is more significant during 1985 to 1990 thereby supporting the incentive realignment hypothesis. In the two subperiods, the difference between the coefficient of R&D variable is significantly different whereas the difference between coefficient of selling expenses variable is not so significant. Finally, the findings of this study support the idea that the role for debt relates to the incentives problems associated with free cash flow.
Empirical Evidence- Paper-X
This paper contributes to fill the existing gaps in our knowledge pertaining to overinvestment by the targets successfully acquired through leveraged transactions.
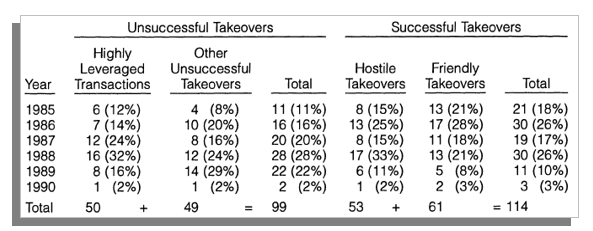
The author investigates 213 targets drawn from successfully completed takeovers executed during 1985-1990 and provides evidence as to how the takeovers are biased against considering the overinvestment. Year-wise distributions of the sample are shown in Table-3.29 above. The distribution of unsuccessful takeovers effectively extends a year past that of the successful takeovers.
The pre-takeover summary statistics for various sample subgroups are given in Table-3.30. The characteristics of pre-takeover attempt are measured at the end of the last full fiscal year immediately before the control contest. The necessary parametric t-test and non-parametric Wilcoxon ranksum tests show that the targets of unsuccessful takeovers tend to be larger (t=4.50, z=4.29) and have higher leverage (t=2.12, 2.31) than the targets of successful takeovers.
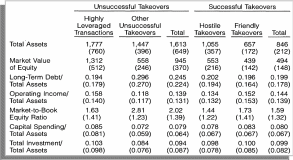
The measures of overinvestment are presented in Table-3.31 below. The targets of both successful and unsuccessful takeovers exhibit no evidence of consistent overinvestment as groups. The industry adjusted capital spending ratio of HLT firms averages 1.0% during the two years before the HLT with a median of 0.4%. The mean and median exceed zero at conventional significance levels and HLT firms’ industry adjusted total investment averages 1.3% of total assets with a median of 0.4%. Both of these are significant at the 0.05 level as shown in the table. Further, an ANOVA with Tukey t-tests indicates that the industry adjusted investment ratios of HLT firms substantially exceed all other subgroups.
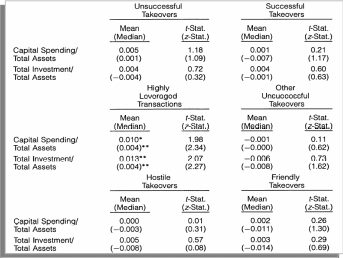
The post-control contest investment changes for the 91 targets of unsuccessful acquisition attempts are shown in Table-3.32. The difference between firms’ average industry adjusted investment ratios from the two full fiscal years immediately pre-takeover attempt and immediately post-control contest gives the measure of investment changes. Measuring investment changes accurately is not as simple as it sounds because there exist many areas of biases.
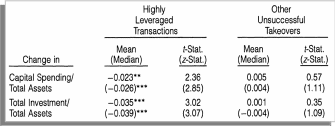
According to the free cash flow theory, the disciplinary takeover threats will force overinvesting targets to eliminate or reduce their unprofitable investment. Now, it is required to test the association or interlink between larger subsequent investment cuts and greater pre-takeover attempt overinvestment. This can be done by regressing firms’ industry-adjusted investment changes on their pre-takeover attempt industry-adjusted investment levels. Table-3.33 includes the tests and OLS regressions. For controlling cross-sectional variation in firms’ post-control contest liquidity constraints, a proxy for firms’ cash flow changes has been introduced.
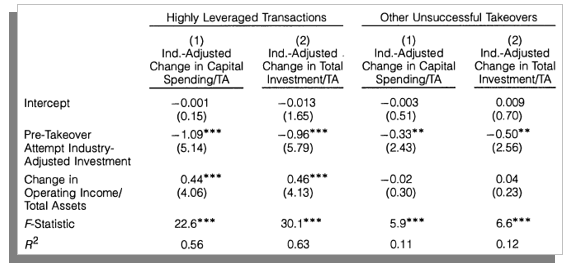
A strong negative relationship has been found between overinvestment and investment changes in both the HLT firms and other targets of unsuccessful takeovers but this relationship is economically and statistically much stronger in the HLT sample. In both investment regressions, the coefficient on pre-takeover attempt industry-adjusted investment of HLT firms is statistically indistinguishable from a negative one. As the table shows, β=-1.09 with a standard error of 0.21 and β= -0.96 with a standard error of 0.17 in the capital spending and total investment regressions respectively. This leads to the fact that firms cut investment one percentage point post-HLT for each percentage point pre-takeover contest investment controlling for profitability effects.
The HLT firms’ debt-related uses of cash flow and investment are shown in Table-3.34 (Panel-A) both as a percentage of operating income, before the takeover attempt. The change of these uses after the restructuring is also shown in the table. Pre-takeover attempt levels are measured over two fiscal years immediately before the control contest and post-HLT changes are calculated as the difference between pre-takeover attempt levels and post-HLT levels measured over the two full fiscal years immediately after the HLT.
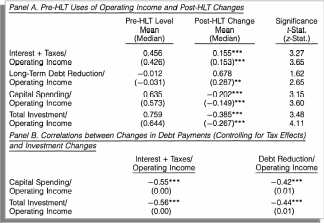
The correlations between changes in debt-related cash flow uses and investment are given in Panel-B of Table-3.34 all of which came out to be significantly negative (less than –0.4). This finding along with the regression results shown earlier indicates lower discretionary cash flows lead to firm’s post-HLT investment cuts and not just mean reversion.
HLT firms’ median industry adjusted investment ratios and median leverage ratio before the HLT and during the four years after are presented in Table-3.35. Two trends are evident from the table- leverage is very high and investment very low during the first two years after the HLT. After this, the leverage begins to fall and investment to rise. The HLT firms median industry-adjusted capital spending ratio bottoms out at -1.6 % during the second year after the HLT, both statistically significant at the 0.01 level. A small increase in median investment is observed during the third year after the HLT and the median leverage ratio falls from 0.66 to 0.52. The fourth year shows larger increase with the median leverage ratio going down to 0.05. This study concludes suggesting that any underinvestment is likely to be temporary and finally, it confirms that target overinvestment plays an important role in the market for corporate control.

Conclusions
This chapter presents empirical analyses and investigations of different LBO transactions initiated during 1970s through 2006. Adopted here is an alternative approach of analyzing and evaluating ten (10) prior research works specifically related to LBO transactions as listed in Appendix-A. Besides discerning the findings and contributions of each of the papers, some emerging hypotheses have also been highlighted in this chapter. The empirical findings now provide better and realistic insights about LBO transactions.
Implications and Future Research Posibilities
Introduction
Today, private equity firms have become increasingly important players in world financial markets. They raise equity capital from limited partners, and then supplement this equity with additional deal-level financing, usually debt when the investment is a buyout and syndicated equity when it is a venture deal. All LBO initiatives are not successful as we learnt from the literature (Chapter-2 & 3). A series of factors-both internal and external, determines the outcome of any LBO initiatives. Taking stock of the literature review (Chapter-II) and the empirical investigation (Chapter-III), this chapter attempts to highlight the implications of this initiative and finally identifies future research possibilities, if any, in this field of study.
Study Implications
Both the theoretical and the policy implications of this study have been discussed here. The theoretical implications have been filtered with regard to the following parameters- speed of privatization, sequencing of privatization, adjustment to the market, and the value creation potential.
Theoretical Implications
Regarding speed of privatization, some researchers advocate for rapid or the Big-Bang privatization while others favor the slower gradual privatization. The empirical findings of this study indicate that there is improvement in performance and value creation. The liberal trade environment and economic reforms undertaken by the government provided operational autonomy to the managers that in-turn lead to better performance. Specially, reforms done prior to privatisation announcements have helped the companies to create value in the food processing, beverage and footwear and leather enterprises as we find in Chapter-2 & 3.
However, the financial performances and the value created in some enterprises showed marginal decreasing trends during the 1997 suggesting that the reforms implemented prior to the announcement of sale improve the value created. Once companies are offered for sale quick divestiture is best.
One important question regarding privatization is- whether governments should restructure state-owned enterprises prior to sale or leave any such restructuring to private buyers. Many studies indicate that governments should restructure state-owned enterprises prior to divestment, both because they are better able than private owners to cushion the financial blow to displaced workers (through unemployment and pension payments) and for providing a clear direction to the private players. In order to make a firm attractive to the potential buyers, governments on many occasions went on to reduce the size of a firm’s labour force and to absorb some debt.
Particularly, more extensive investments in restructuring have usually not paid off in terms of higher privatisation proceeds. The empirical findings reveal that good judgments need to be exercised in this case. A firm must continue to adapt dynamically to its environment, grasping opportunities and avoiding hazards in order to maintain its value. We have seen some firms were able to increase productivity, sales and value by completing the partially finished projects.
The government also gets some money in the form of taxes in the future. The risk of delaying investments makes companies less competitive in particular when the process of privatisation takes a long time. The study indicates that the enterprise in transition requires restructuring that creates value by influencing the fundamentals of the business rather than a restructuring that makes companies superficially attractive.
Adjustment to the changing market conditions has been an issue particularly in case of the large state-owned firms. Can the large state-owned firms can adjust in a flexible and effective way to newly-emerging market forces? Some argue that state-owned manufacturing firms would not respond to the new economic environment, would decapitalize companies by paying out surpluses as wages and would then use their bargaining power to negotiate a bailout with the government thereby recreating bureaucracy in the process. This study however indicates that the state-owned enterprises have been much more responsive than feared, but show a mixed picture.
Some state-owned enterprises are seen as responding rapidly to the new market environment while others appear to be “drifting”, dissipating their assets while making little or no effort to respond to the market. There also are mixed evidences that some enterprises in the food processing, beverage and footwear and leather industries adjusted to the market environment, while the textile enterprises had the problems of adaptation and were losing their local as well as export markets to synthetic and substitute products.
The value creation potentials of buyouts and privatization have been a topic of debate for long. Privatization has the economic aim of improving the efficiency of the existing enterprise assets while protecting their value. The announcement of privatisation and the selling process sometimes decreased the value created in the enterprises. Moreover, as the implementation of the privatisation process takes a long time the potential for value creation in the future of the companies is diminishing. This study indicates that there is uncertainty regarding the time that the companies will be sold. It has been observed that the implementation of privatisation required a longer time than planned. The process of privatisation is affecting the drivers of value of the companies. When the uncertainty of the time of sale increases the government puts restrictive control measures and this is reducing the empowerment of the managers to create value and results in a ‘privatisation trap’.
Policy Implications
This study identifies various fronts as to how state-owned enterprise can be transformed into a value creating private company. The empirical findings reveal that there is neglect of the owner once enterprises are offered for sale and the companies’ value starts deteriorating as time goes on. Good management during the interim period is essential for improving the viability of the enterprises and its future competitiveness. Creating value in state-owned enterprises due to improved management systems facilitates the eventual transfer of these enterprises to the private sector.
The different privatization initiatives show that buyers are looking for viable enterprises with the potential to thrive in the market. Preparing enterprises for sale by reducing redundant labour, imposing hard budget constraints, setting clear commercial goals, introducing performance pay and decentralising and introducing accountable management prior to privatization seemed to have helped some state-owned enterprises to attract buyers and improve their performance after privatization.
Many industries can play an important role in the economy by generating exports as well. However some may also find lack of market for their products. Production efficiency and effective use of resources have high relevance in creating value and it is also observed that any disturbances in materials supply can generate critical problems. Further, obsolete technology is one of the main constraints that the companies are encountering in competing. At the time of establishment many companies started operations with second hand machinery and there was no major investment in case of some firms as this study reveals.
Another important issue in case of value creation is empowering and controlling managers. The study indicates that managers, given operational autonomy, can contribute towards improvement in business performance. However, imposition of any restrictions like restrictions on inventory purchases, credit extensions and fixed asset investments limits the managers from creating value thereby lowering the overall performance of the firms.
Future Research Possibilities
The information base and the data-sets this study used seems to be inadequate and thus, future research can improve upon this one by taking more robust data-sets. Estimating the effect of leverage on the pricing of deals controlling for the endogeneity of leverage is quite difficult but still, it is found that leverage has a strong impact on the prices of deals, controlling for other factors that potentially affect pricing. These results suggest that capital structure in buyouts requires a different explanation than in public firms. In particular, the availability of deal-level financing appears to impact the investment process in buyouts in ways unlike public firms. The results are consistent considering that the partners in buyout firms borrow as much as they can for each deal, and the capital market provides discipline by limiting how much it will lend in different times.
Nevertheless, more research needs to be taken-up on the financial behavior of private equity firms. The results suggest there is a link between the availability of financing and private equity firms’ investments but the basic question of why the availability of financing varies so much over time finds no answer in this research. One factor explaining the recent increase in capital available to provide financing for buyouts is the development of syndicated loan market but the market’s existence begs the question of why so much capital is being provided in the first place. Finally, understanding the nature of this market is clearly an important topic for future research.
References
Anslinger P. & Copeland T., ‘Growth through Acquisitions: A fresh look’, Mckinsey Quarterly (2), 1996.
Andres Christian, André Betzer & Hoffmann Mark, ‘Going Private Via LBO – Shareholder Gains in the European Markets’, University of Bonn, Chair of Finance and Banking, 2003.
Angwin, D. and Savill, B. (1997), Strategic Perspectives on European Cross-border Acquisitions: A view from the top executives, European Management Journal, Volume 15, Issue 4, pp: 423-435.
Blair, Margaret M. ed., The Deal Decade: What Takeovers and Leveraged Buyouts Mean for Corporate Governance, Washington D.C.: Brookings Institution, (1993).
Baker G.P., ‘Beatrice: A study in the creation and destruction of value’, Journal of Finance, 47(3), Proceedings of the 52nd Annual Meetingof the American Finance Association, Lousiana, January 3-5, 1992.
Berger, Allen N., Rebecca S. Demsetz, and Philip E. Strahan, “The Consolidation of the Financial Services Industry: Causes, Consequences, and Implications for the Future,” journal of Banking & Finance 23 (1999), 135-194.
Bruun Claus, ‘The Leverage Buyout process in Private equity- A theoretical exploration and comparison’, USBE, Copenhagen, 2007.
Bull I., ‘Management Performance in Leveraged Buyouts: An Empirical Analysis in Leveraged Management Buyouts: Causes and Consequences’, New York University Press, New York, 1989.
Butler P. A., The Alchemy of LBOs’, Mckinsey Quarterly (2), 2001.
Copeland, T., Koller, T. and Murrin, J. (1990), Valutation: measuring and managing the value of companies, McKinsey & Co., John Wiley and Sons.
Damodaran, A (2002), Investment Valuation, Chapter 15, Online version, 2nd edition, John Wiley and Sons. Web.
DeAngelo et.al., ‘Ancient Redwoods and the Politics of Finance: The Hostile Takeover of the Pacific Lumber Company’, Journal of Financial Economics, 1988.
DeAngelo and Rice E.M., ‘Going Private: Minority Freezeouts and Stockholder Wealth’, Journal of Law and Economics, 1984.
DeAngelo L.E., ‘ Equity Valuation and Corporate Control’, The Accounting Review, Vol. 65. No. 1, University of Michigan, 1989.
Easterwood C., Singer Ronald, Seth A and Lang Darla, ‘Controlling the Conflict of Interest in Management Buyouts’, The Review of Economics and Statistics, Vol. 76, No. 3. (1994), pp. 512-522.
Gaynor, Martin and Deborah Haas-Wilson, “Change, Consolidation and Competition in Health Care Markets,” Journal of Economic Perspectives 13:1 (1999), 141-164.
Galpin, T.J & Herndon M., ‘The complete guide to Mergers and Acquisition, Jossey-Bass Publishers, San Francisco, 2000.
Grundfest Joseph, ‘Jobloss and Takeovers’, Address to the University of Toledo College of Law, Third Annual Colloquium on Corporate Law and Social Policy, March11, 1988, U.S.SecuritiesandExchangeCommissionWashington,D.C.20549.
Hamilton Lin, ‘Walll St. Training note on Corporate Valuation Methodologies’, HL Capital Partners Ltd., Undated.
Hendershott Robert, ‘Which Takeover Targets Overinvest?’, The Journal of Financial and Quantitative Analysis Vol. 31, No. 4. 1996.
Healy, P. M., “The Impact of Bonus Schemes on Accounting Choices,” Unpublished dissertation (University of Rochester, 1983).
Hite G.L. & Vetsuypens M.R., ‘Management Buyouts of Divisions and Shareholder Wealth’, The Journal of Finance, Vol. 44, No. 4., pp. 953-970, 1989.
Kaplan, Steven N. and Michael S. Weisbach, “The Success of Acquisitions: Evidence from Divestitures,” Journal of Finance 47:1 (1992), 107-138.
Kaplan S & Strömberg, ‘Leveraged Buyouts and Private Equity’ University of Chicago, Graduate School of Business and NBER, 2008.
Kaplan, Steven N., 1989, The effect of management buyouts on operations and value, Journal of Financial Economics 24, 217-254.
Koller, T., Goedhart, M. and Wessels, D. (2005), Valuation- measuring and managing the value of companies, (4th edition), John Wiley & Sons, New Jersey.
Liberty, S. E. and J. L. Zimmerman, “Labor Union Contract Negotiations and Accounting Choices,” The Accounting, 1985.
Longstreth, B., “Keeping Management in Check: New Controls for Leveraged Buyouts,” The New York Times (1983).
Lichtenberg, Frank R., and Donald Siegel, 1990, The effects of leveraged buyouts on productivity and related aspects of firm behavior, Journal of Financial Economics 27, 165- 94.
Loos Nicholaus, ‘Value creation in Leveraged Buyouts’, University of St. Gallen, Hamburg, Germany, 2005.
Long, William F., and David J. Ravenscraft, 1993, LBOs, debt and R&D intensity, Bureau of the Census Center for Economic Studies Discussion Paper 93-3.
Mako P. William, ‘Corporate Restructuring Strategies: Recent Lessons’, Asian Regional Seminar on Financial Reform and Stability, Hyderbad, India, 2001.
McCarty, J and Aversano, P. (2007), How private equity firms are adapting to a changingmarketplace, Capital eyes, Bank of America Business Capital, page 1-2, 2007.
Opler Tim & Titman Sheridan, ‘The Determinants of Leveraged Buyout Activity: Free Cash Flow vs. Financial Distress Costs’, The Journal Of Finance Vol. Xlviii, No. 5. 1993.
Olsen J. (2003), Note on leverage buyout, Tuck School of Business at Dartmouth, Center forPrivate equity and entrepreneurship, 2003.
Pautler, Paul A. “Recent Empirical Evidence on Mergers and Acquisitions,” Antitrust Bulletin 38:4 (1993), 741-797.
Phillips, Gordon M., 1995, Increased debt and product market competition: An empirical analysis, Journal of Financial Economics 37, 189-238.
Rozwadowski, K. and Young, B.P. (2005), Buyout competition: The emergence of hedge funds in the world of private equity, Journal of Private equity, Volume Winter, page 67- 73, 2005.
Robert T. Kleiman, ‘The Shareholder Gains From Leveraged Cash-Outs: Some Preliminary Evidence’, Journal of Applied Corporate Finance 1 (1) , 46–53. Web.
Ross, S. A., Westerfield, R.W. and Jaffe, J. (2005), Corporate finance, (7th edition), International, McGraw-Hill, Singapore.
Scott D. Lee, ‘Management Buyout Proposals and Inside Information’, The Journal of Finance. Vol. XLVII, No. 1992.
Smith, Abbie J., 1990, Management buyouts and corporate performance, Journal of Financial Economics 27, 143-164.
Standish Mellon, ‘Leveraged Buyouts – A Window of Opportunity for Private Equity’ by Catalan Andrew, 2007.
Sheleifer A. & Summers L., ‘Breach of trust in hostile takeovers: causes and consequences’, University of Chicago Press, 1988.
Sherman, A.J and Hart, M.A. (2006), Mergers and acquisitions from A to Z, (2nd edition),Amacom, New York.
(TSB)/Tuck School of Business, Note on Leveraged Buyout’, Case-5-0004, Center for Private Equity and Entrepreneurship, 2003.
Watts, R. L., and J. L. Zimmerman. 1986. Positive accounting theory. Prentice-Hall.
Weston, J.F and Weaver, S.C. (2001), Mergers and Acquisitions, Mcgraw-Hill, New York.