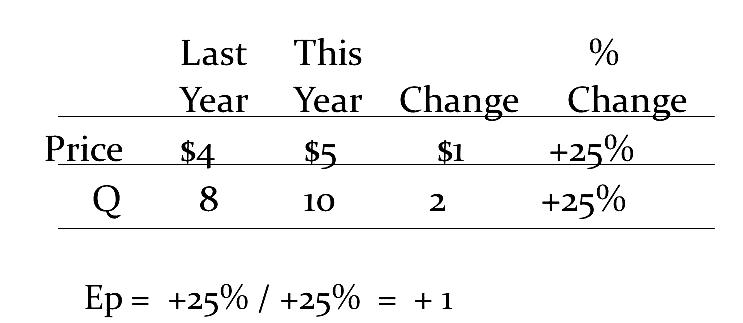
Demand Estimation
The estimation of demand for a specific product a company sells is a significant component for conducting performance analysis of any business. Thus, all decisions related to whether a company should enter the market, whether there is a need for lowering or increasing the prices, how the production capacity should be planned directly relate to demand estimation. Using calculating the estimated demand, a manager can direct the business decisions linked to the future demand for a particular product (“Demand Estimation” 1).
A method of calculating estimated demand is illustrated in Figure 1:

2016 Demand Forecast for LG and Mitsubishi Industrial Air Conditioners
If the LG AC system’s prices have increased by 20% since 2010, the 2016 price will be approximately 38000+20% = 45600. If the price for the Mitsubishi AC has decreased by 25%, then the estimated prices will be 49500-25%=37125. The analysis of the data table on the prices and total sales of AC systems shows that there is a pattern of overall sales increase that is not threatened by the increase in the prices for air conditioners. Furthermore, it is important to note that the second quarter of the year exhibits the most demand and sales since April, May, and June are months when the air temperature significantly increases.
Substitute Commodity and Cross-Elasticities
A substitute commodity is essentially a substitute for a particular product. Thus, when the price of one commodity increases, the demand for its substitute will rise (Econogist par. 2). Cross-elasticity of demand is an estimate which indicates “the percentage change in quantity demand for a good after the change in the price of another” (Economics Help par. 1). It is calculated by dividing the percentage of change in quantity demanded of good (QD) of one good by the percentage of change in the price of another good. Concerning LG, the price of which has increased by 20%, and the GD of its substitute has increased by 5%. The estimated cross-elasticity will equal +0,25.
Complementary Commodity Price Estimation
A complementary good or commodity is a product or a service that is directly linked to the operation of another good. If a price for one item declines, the public tends to buy the complementary product regardless of whether it increases or not (Hill par. 3). In the market of AC systems, electricity is a complementary commodity, the price of which is predicted to rise by 38% in 2016, taking into account an overall pattern of electricity price changes shown in the table.
Advertisement
As mentioned in the Harvard Business Review article written by Paul Farris and David Reibstein, companies that spend more on product advertisements usually exhibit higher rates of income (par. 1). However, the table with LG and Mitsubishi AC data shows no distinct pattern of relationship between the overall sales and the prices on the advertisement. The second quarter of the year is a period characterized by lower prices on the advertisement since there is a higher demand for ad services in the sphere of air conditioning.
Total Sales
By analyzing the complete set of data on LG and Mitsubishi air conditioning systems, it can be estimated that the total sales of these products will remain stable and increase with the come of a hot season. However, when the temperature in particular areas declines, the overall sales of LG and Mitsubishi air conditioning are also estimated to decline.
Works Cited
Demand Estimation. n.d. Web.
Econogist. Economics Explained: Complements, Substitutes, and Elasticity of Demand. n.d. Web.
Economics Help. Cross Elasticity of Demand. n.d. Web.
Farris, Paul, and David Reibstein. How Prices, Ad Expenditures, and Profits Are Linked. n.d. Web.
Hill, Aaron. Complementary Goods in Economics: Definition & Examples. n.d. Web.
“Is This How It’s Done?” n.d. Web.