Abstract
Glycolysis is a process that results in the fission of a six-carbon sugar into a three-carbon acid, pyruvate ion. The experiment was designed to investigate the impact of temperature on the rate of Glycolysis. The substrate was prepared from 775 grams of Saccharomyces cerevisae that was mixed with 50 grams of glucose, a hexose sugar. Four test tubes were labeled depending on the temperature of the corresponding water bath namely control, cold, warm and hot. The rate of Glycolysis was measured as a function of carbon dioxide gas that was evolved within a thirty-minute time frame. The average carbon dioxide evolved was determined as well as t-test values. The experiment results demonstrated that the rate of Glycolysis increases as temperature increases which resulted in the acceptance of hypothesis 1 and rejection of hypothesis 2.
Introduction
Glycolysis (Bodner, pp.568-65) represents the first step in the respiration process and takes place in the cytosol. Glycolysis is an exothermic process that results in a release of chemical energy in the form of Adenosine Triphosphate (ATP). Glycolysis represents the first step in respiration that proceeds Krebs’s cycle (Michaelidis & Storey, pp.155-9). During Glycolysis, Hexa-carbon sugar stability is decreased by ATP which paves way for the formation of NADH and the formation of a three-carbon sugar.
Phases in Glycolysis
The Glycolysis process involves a ten-step (figure 1) bio-reaction that is divided into two-five-step reactions (Ruoff et al, pp.182-8). The first phase involves a priming phase which is instrumental in phosphorylating Hexa-carbon sugar moiety. The process utilizes two molecules of ATP which increase the energy content of the six-carbon sugar. The priming phase has been termed as the investment phase due to the input of two molecules of ATP (Hess & Bouiteux, pp.1569-1566). The second phase also termed as payoff phase involves de-phosphorylation of the 1-6, fructose biphosphate sugar which undergoes internal rearrangement and cleaves to form 3 carbon sugar compounds named pyruvate.

The process of Glycolysis has been proposed to proceed through two pathways as illustrated by the figure below.

Glucose in the cytosol (Bodner, pp.567-9) is phosphorylated through the addition of ATP in the presence of glucose-hexokinase to form a glucose-6-phosphate which undergoes additional ATP to form Fructose-1, 6-phosphate.
Glucose + ATP (in presence of glucose phosphate isomerase) = fructose-6-phosphate
Fructose-6-phosphate + ATP (in presence of glucose phosphate isomerase) = fructose-1, 6-phosphate
(In each of these two steps, ATP is reduced into ADP.
The unstable fructose-1,6- diphosphate undergoes internal rearrangement (Michaelidis & Storey, pp.157-8) in presence of aldolase to form dihydroxyacetone phosphate and glycerate 3-phosphate which undergo further phosphorylation leading into oxidation and formation of intermediate products named as 1,3-diphosphoglyceric acid that is catalyzed by an enzyme termed as phosphoglyceraldehyde dehydrogenase (Ruoff et al, pp.182-5) that takes place in presence of NAD and phosphate group. Based on the electron pathway, 1,3-diphosphoglyceraldehyde is formed as an intermediate product
Glyceraldehydes 3-phosphate (in presence of aldolase) =1, 3-diphosphoglyceraldehyde
1, 3-diphosphoglyceraldehyde (oxidized) = 1, 3-diphosphoglyceric acid which undergoes hydrolysis to form 3-phosphoglyceric acid in presence of magnesium II ions via phosphor glycerate kinase.
3-phosphoglyceric acid undergoes enzymatic conversion into 2-phosphoglyceric acid in presence of phosphor glycerol mutase.
3-phosphoglyceric acid (in presence of phosphor glycerol mutase) = 2-phospho glyceric acid
2-phosphoglyceric acid is converted into phosphoenol pyrivic acid and water in presence of enolase
2-phosphoglyceric acid (in presence of enolase) = phosphoenol pyrivic acid phosphoenol pyrivic acid undergoes exothermic reaction (Hertz et al, pp.343-6) that result in loss of chemical energy into ADP in presence of phosphor pyruvate kinase, potations I ions, and magnesium II ions to form enolypyruvic acid and a molecule of ATP pyruvic acid is the major product.
Kinetics of Glycolysis
The rate of Glycolysis has been claimed to be affected by different factors namely temperature, and concentration of cobalt acetate (Bodner, pp.372-3). The rate-determining steps in the Glycolysis involve the reaction affected by phosphorylase and phosphofructokinase since enzymes are sensitive to temperatures (Hertz et al, pp.340-2). Temperatures affect steps catalyzed by phosphorylase and phosphofructokinase because temperature affects the configuration of the enzymes.
The rate of Glycolysis is determined by measuring the rate of formation of carbon dioxide.
Aims of the experiment
The experiment sought to determine the influence of temperature on the rate of Glycolysis.
Hypothesis for testing
- Hypothesis 1: increase in temperature increases the rate of Glycolysis hence low temperature is a limiting factor to the rate of glycolysis
- Hypothesis 2: temperature changes do not affect the rate of Glycolysis if the rate of Glycolysis is independent of temperature hence temperature is not a limiting factor.
Reagents required for Glycolysis
- 50 grams of glucose
- 775 grams of Saccharomyces cerevisiae
- liter equivalent of distilled water
Apparatus required
- Four sets of water bath
- Four 50 ml test tubes
- Thermometer
The procedure of the experiment
The substrate solution was prepared by mixing 50 grams of glucose (six-carbon sugar) and 775 grams of Saccharomyces cerevisiae to form one liter of solution. 20 milliliters of the solution were pipetted into each of the 50-milliliter test tubes. The four test tubes were then placed under different thermo-regulated conditions in a water bath. The water baths were labeled as control, cod, warm and hot.
The test tubes were acclimatized by being put into the water bath for five minutes. Any carbon dioxide that had built up during the acclimatization period was got rid of by tapping the test tubes.
The independent test tubes underwent a fermentation process and the evolution of carbon dioxide measured in terms of cubic centimeters was recorded from time zero. The first 1.0 centimeter produced was estimated to contain 1.0 cubic centimeters while the rest of 0.5 cm was estimated to contain 1.0 cubic centimeters. After the experiment was completed, the following elements were calculated
- Average CO2/10 minutes interval
- Standard deviation
- t-test values
Results obtained
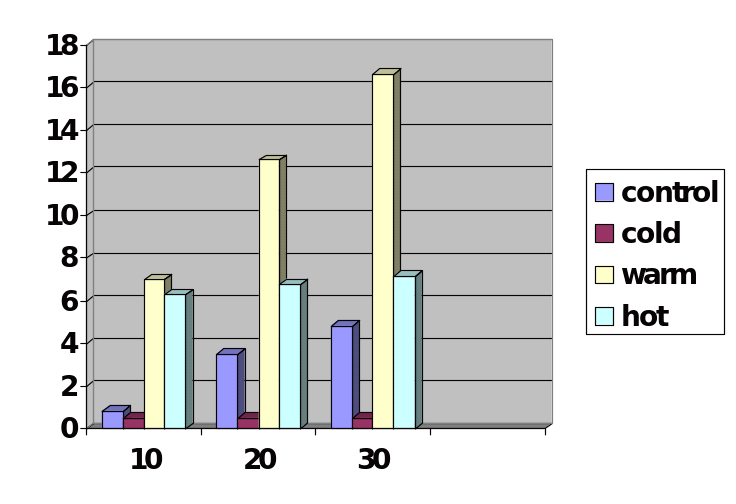
The results of the experiment demonstrated that the Glycolysis reaction that took place in a warm water bath had the highest volume of carbon dioxide than the test tubes that had been placed in control, cold, and hot water baths as illustrated by Figure 4. The results also showed that Glycolysis in warm water took less time to produce the highest volume. In the first ten minutes, the test tube that had been placed in a warm water bath had produced the highest volume of carbon dioxide and the process had stopped after ten minutes which may mean the fermentation process had completed or reached a point where the activity of the enzyme was being affected by the introduction of other limiting factors like the PH. As the rate of fermentation increased, the level of PH continued to decrease meaning the concentration of the acid was increasing until the enzyme maybe was denatured or made inactive through a change of its conformation.
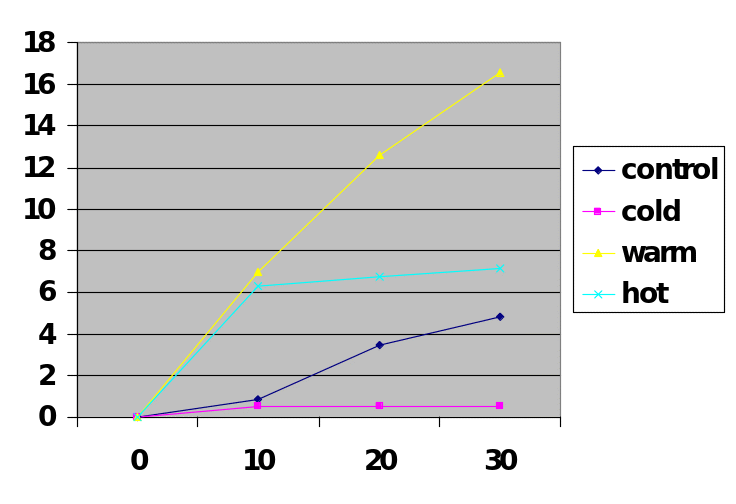
Calculations for the t-test between hot and control water bath was determined to be 0.682, hot and cold-water bath was determined to be 2.453 and hot and warm water was determined to be 2.217. The t-test for the control was calculated to 0.00964, and an average of CO2/minute of 0.1611, the cold water bath t-test was 0.0000 and average CO2/minute of 0.0167, the t-test value of the warm water bath was determined to o.0193 and average of CO2/minute of 0.5556 while the t-test of the hot water bath was calculated to 0.0304 and average volume CO2/minute of 0.2399.
Discussion of the results
The results demonstrated that temperature affects the rate of Glycolysis. Based on the data, the rate of Glycolysis is highest when the reaction was carried out in a warm water bath, followed by a hot water bath, control, and finally the cold water bath. This shows that when temperature increases, the activity of the enzyme increases. From the results on the average volume of CO2/minute, the rate of fermentation is negatively affected by high temperatures. The enzyme is a protein in nature and its regioselectivity is affected by high temperatures. At high temperatures, the enzyme loses its enzymatic properties and cannot catalyze the reaction.
The data obtained during Glycolysis
The results of the t-test showed that t-test values were below the critical point 2.78, which meant that under the experimental conditions, the rate of fermentation was not affected by other factors except temperature. The experiments did not determine the influence of increasing concentration of the substrate to investigate its effects on the rate of fermentation or seek to determine the impacts of PH on the rate of fermentation. The experiment, therefore, qualified to be a case-control since it sought to determine the influence of temperature only as a determinant of the rate of Glycolysis.
The t-test value for the cold-water bath was determined to be 0.0000 which demonstrated that the rate of reaction was very low at 0.0167 cm3/minute due to deactivation of the enzyme while at a higher temperature, (hot water bath), the rate is considerably lower due to denaturation of the enzyme by higher temperature.
Conclusion
The rate of Glycolysis is directly proportional to temperature. This implies at low temperatures, the rate of Glycolysis is low. The rate of Glycolysis increases exponentially with increasing temperature and attains optimum temperature when the rate declines as temperature increases. Based on the data, it can be said that at high temperatures, the rate of Glycolysis would be zero. This led to the acceptance of hypothesis 1 and rejection of hypothesis 2.
References
Bodner, G. M. “Metabolism: Part I, Glycolysis.” Journal of Chemical Education Vol.63 (1986), pp.566–570.
Hertz L, Swanson RA, Newman GC, Mariff H, Juurlink BHJ, Peng L. Can experimental conditions explain the discrepancy whether or not glutamate stimulates aerobic glycolysis? Dev Neurosci. Vol.20: (1998), pp.339–347.
Hess, B., and A. Boiteux. Mechanism of glycolytic oscillation in yeast. 1. Aerobic and anaerobic growth conditions for obtaining glycolytic oscillations. Hoppe-Seyleŕs Z. Physiol. Chem. Vol.349, (1968), pp.1567–1574.
Michaelidis, B. and Storey, K. B. (1990), Anaerobiosis and the regulation of glycolytic enzymes in the sea anemone Metridium senile. Journal of Experimental Zoology, vol.256: 1990, pp.154–161.
Ruoff, P., M. K. Christensen, J. Wolf, and R. Heinrich. 2004. Temperature dependency and temperature compensation in a model of yeast glycolytic oscillations. Biophys. Chem. Vol.106, (2004), pp.179–192.