Introduction
In the recent past, the Nottigham Trent University has rolled out strategies to improve on the general university experience among the students. Specifically, the university has invested a substantial funding to rebrand and improve the existing the Student Union facilities within the campus to facilitate the development, representation, and entertainment of the students. Some the improvements include upgrading of the student center, societies, and awareness creating (Sapri, Kaka & Finch 2009; Woodall et al. 2007). Past researches indicate that such improvements have helped in enhancing student experience (Douglas, McClelland & Davies 2008; Long 2011; Guan, Cole & Worthington 2016; Madriaga 2011; Mallinckrodt & Sedlacek 1987). Therefore, the objective of this research study is to establish the level of increased postgraduate students’ university experience as influenced by improvements in the student union facilities. Apparently, it is assumed that the facility improvement initiative has a positive impact on the campus experience among the post graduate students of the Nottigham Trent University. The scope of this study covers awareness, level of engagement in student societies, and effectiveness of the facilities in entertaining postgraduate students. In order to achieve this scope, the following research questions were generated;
- How aware are postgraduate students of the student union facilities and what use do they make of them?
- How could awareness be better developed?
- Why do some student join and other not?
- What are some more active and other join societies but do not attend after the first meeting?
- Are there any cultural barriers relating to the perception of Students Unions that they need to be more aware of?
- How well are these students being entertained and involved with these facilities?
Research Methodology
Since the study is focused, dynamic, and subjective, the mixed method was selected involving qualitative and quantitative survey (Mason 2017). Specifically, the researcher opted for direct interviews using the questionnaire tool to collect data from 37 respondents, who are post graduate students of the Nottingham Trent University. The aspects of gender, age, and race were balance in the random selection of the respondents. As captured in figure 1, the entire methodology was developed on the following conceptual framework.

Presentation of the Findings and Analysis
Demographic Data Analysis
The response rate was 100%. The demographic data on age, gender, type of student, and ethnicity are captured graph 1, 2, 3, and 4, respectively.
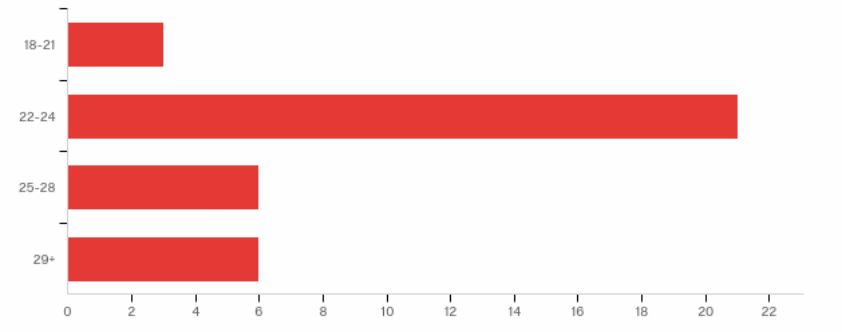
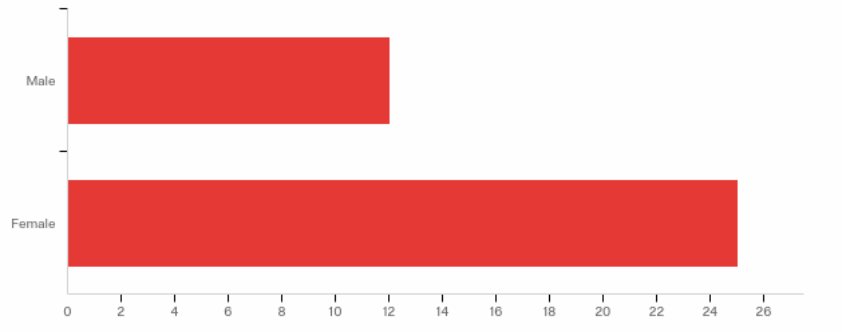
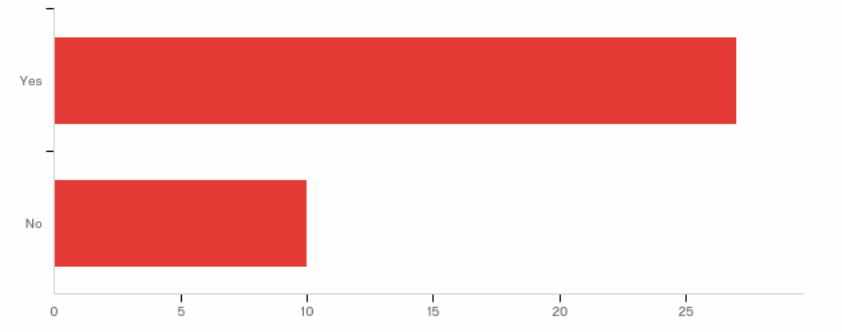
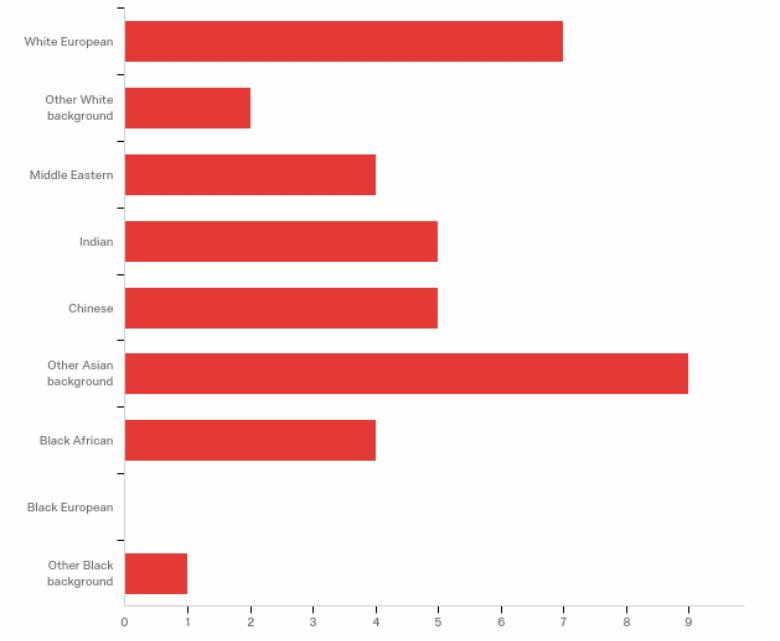
Apparently, the majority of the respondents were between the age of 22 and 24 years. Specifically, 67.57% of the respondents were females while 32.43% were males. Almost 73% of the respondents were international students with only 27.03% being local learners. 24.32% of the respondents were of Asian origin followed by 18.92% white European. The other ethnicities were evenly distributed with exception of the other white background at only 2 respondents.
Responses to the Research Questions
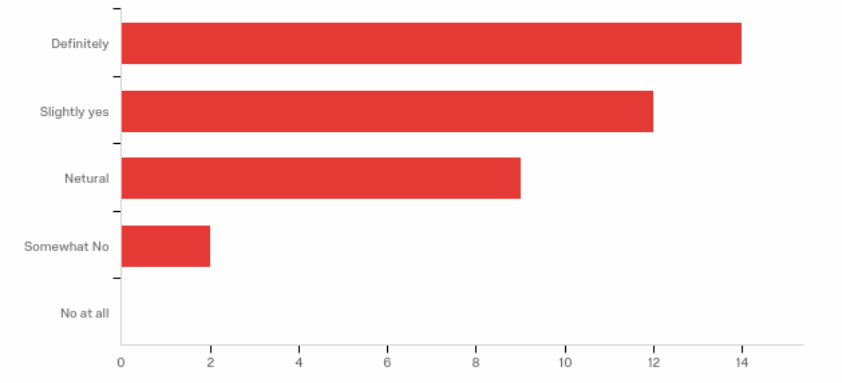
Apparently, 37.84% of the respondents were pleased by the current state of affairs while 32.43% slightly pleased. Only 5.41% of the respondents were unwilling to recommend the institution to other students. As captured in graph 5, a positive response rate of 70.27% is a clear indication that majority of the postgraduate learners are satisfied with general student experience at the university and are willing to share this information with potential new students.
The majority of the respondents do not belong to any society within the college. Specifically, 60.98% indicated that they have not subscribed to any social club in the university. The entertainment and cultural societies attracted 12.20% of the respondents each with the educational society following at 9.76%. As captured in graph 6, the least subscribed social club is the sport society. As captured in table 1, the mean number of hours spent in these societies every week by the respondents ranged from 0.47 to 2.34. Specifically, the majority of the respondents spent more time in the educational than any other society followed by entertainment in any given week. The least time per week was spent in sports and cultural societies.
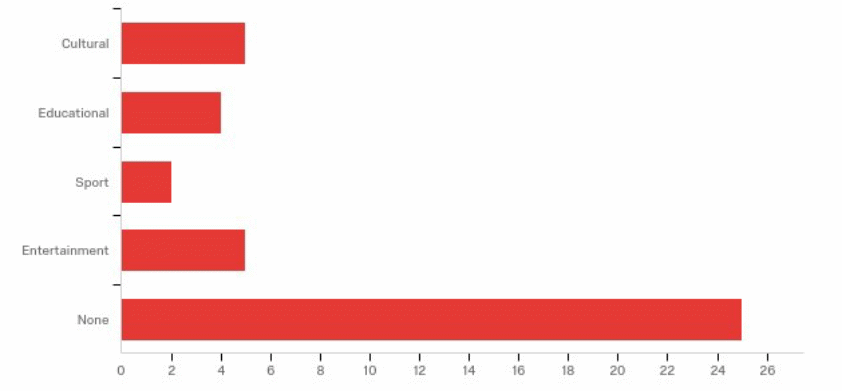
Table 1. Average weekly hours spent in the societies. (Source: Self-generated).
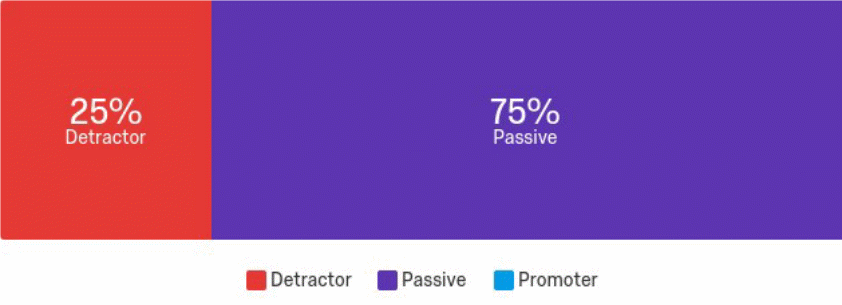
When asked to rate each society, 75% of the respondents had a passive attitude towards the cultural club. As capture in figure 2 and 3, only 25% of the respondents viewed this society as a detractor.

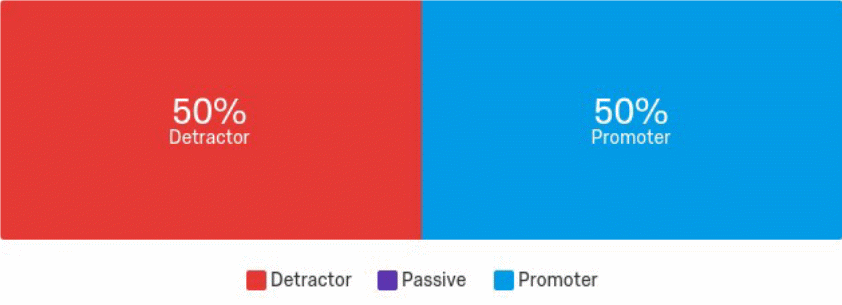
The rating of the education society indicated a 100% passive attitude among the respondents. None of the respondents viewed this club as detractor or promoter. The sports club shared a similar rating in terms of detractor and promote attitude among the respondents. As capture in figure 4, 50% of the respondents viewed the sports club as a promoter.
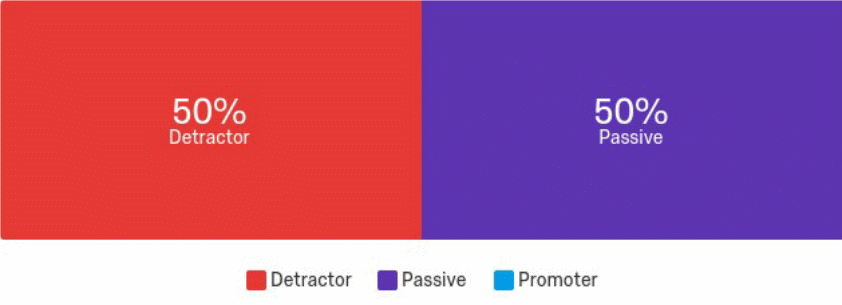
The entertainment society shared a similar rating with the sports society in terms of percentage distribution. As captured in figure 6, this club was rated as 50% passive and 50% detractor.
The respondents who do not subscribe to any society presented several reasons to include limited time, poor time management, lack of motivation, and inconvenience of commuting, especially for those staying outside the campus. Other reasons given are individual laziness, lack of information and interest about these societies, indifference attitude, and language barrier.
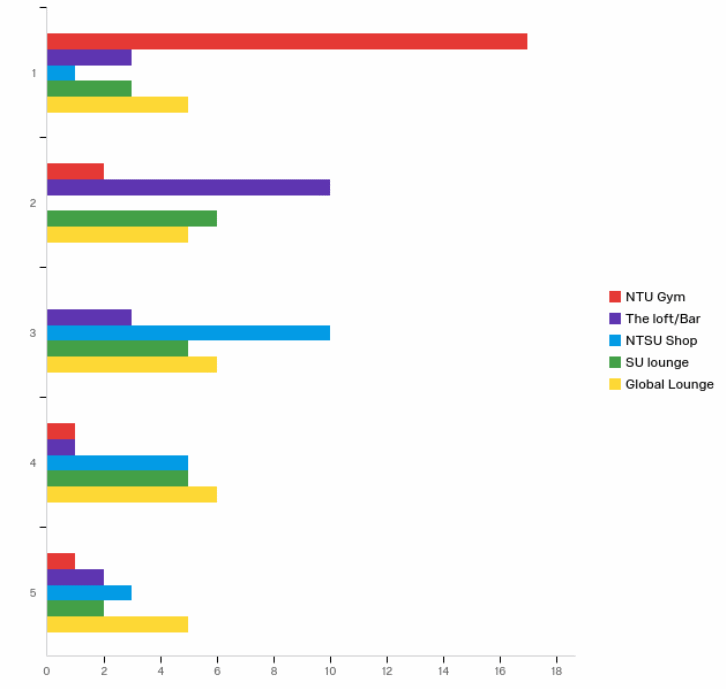
When asked the frequency of visiting other facilities such as the gym, NTSU shop, SU lounge, global lounge, and the loft/bar, on a scale of 1 to 5 (one being less often and 5 often), the gym was the least visited facility. As captured in graph 7, the global lounge, the NTSU shop, and the loft were the most visited facilities. Interestingly, the respondents spent the most time in the gym with a mean of 0.61 per week followed by the bar at 0.51 mean. The respondents spent the least hours visiting the lounge and the SU shop every week.
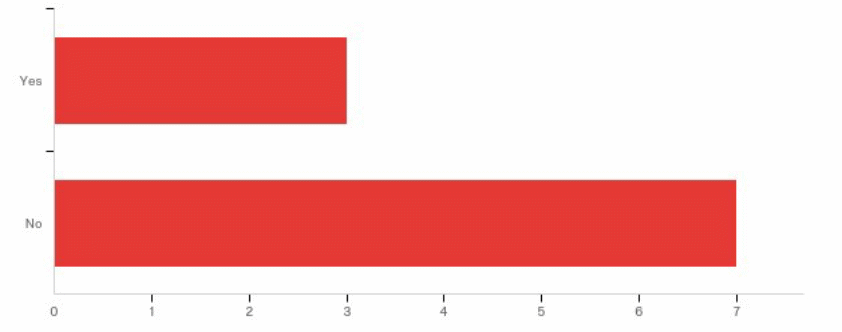
71.43% of the respondents were not aware of their NTSU representative. At the same time, as captured in graph 8, 70% have never contacted their representative. The 30% who have contacted their representatives rated them as 67% passive and 33% promoter. This is an indication that majority of the students do not have frequent contact with the SU leadership and find no reason to do so.
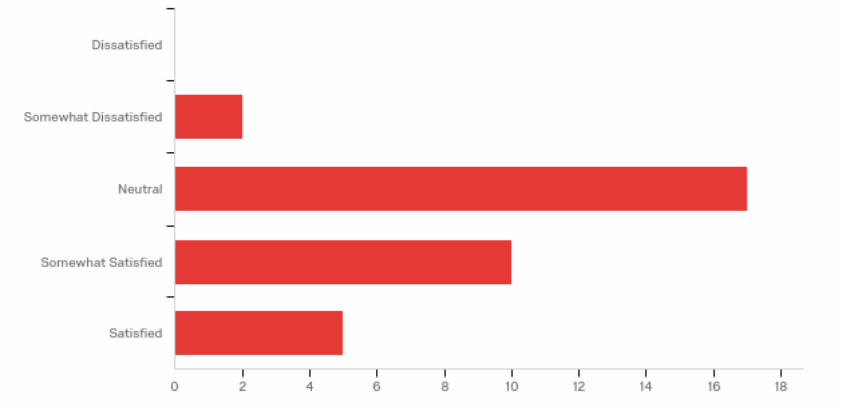
Majority of the respondents were neutral (50%) in terms of satisfaction or dissatisfaction with their experience at NTSU. However, as captured in graph 9, almost 45% were satisfied with their experience with only 5.88% feeling dissatisfied. Interestingly, 21% of the respondents were willing to recommend the NTSU to friends while 47% adopted a passive attitude. However, 32% of the respondents were non-committal.
The most important findings indicated that there is a general awareness of the SU facilities such as clubs, recreational, and its leadership. However, the students displayed an unpredictable trend in responding to their college experience as motivated by these facilities. Interestingly, the students were selective on the facility to use, frequency of usage, and individual benefit attached to it. For instance, the shop, lounge, and the bar are the favorite spots for the students. Again, the students are more interested in educational society because of the direct benefit attached to it as opposed to cultural club. Basically, the lack of interest in the cultural club could be attributed to language barrier and existence of many nationalities who do not share many things in common. The interest and actual participation in the club activities is related to the time at hand and benefits attached to them. For instance, those in short vocational training find joining a club none productive since there is very little they can achieve in a year.
Conclusion and Recommendations
The experience of using mixed research method was very challenging, especially considering the many variables that were being studied. However, the integration of primary survey breached this gap to capture the what and how in establishing a trend in the variables of university experience, awareness, level of engagement, and effectiveness of the facilities to meet the needs of the respondents. The development of a complex conceptual framework facilitated isolation of the significant findings that could be effectively related to the research variables. The findings confirmed the preset assumption that the NTSU facilities improved on the general university experience among the postgraduate students. The survey experience presented an opportunity to capture a true picture of the relationship between the variables of enhanced experience and NTSU facility improvement. However, there is a need to expand sample space to ensure that the final results are more representative of the actual scenario. At present, a sample space of 38 respondents could not capture a true picture of the demographic elements of the subjects of the study. For instance, there was no balance in the ethnicity of the respondents, which could have resulted in the extreme value associated with the lack of interest in the cultural society.
Reference List
Douglas, J, McClelland, R & Davies J 2008, ‘The development of a conceptual model of student satisfaction with their experience in higher education’, Quality Assurance in Education, vol. 16, no. 1, pp.19-35
Guan L, Cole, M & Worthington F 2016, ‘University students’ unions: changing functions, a UK and comparative perspective’, Studies in Higher Education, vol. 41, no. 12, pp. 2095-2109.
Long, P 2011, ‘Student music, arts marketing’, An International Journal, vol. 1, no. 2, pp.121-135.
Madriaga, M 2010, ‘I avoid pubs and the student union like the plague’: Students with Asperger Syndrome and their negotiation of university spaces, Children’s Geographies, vol. 8, no. 1, pp. 39-50.
Mallinckrodt, B & Sedlacek, W 1987, ‘Student retention and the use of campus facilities by race’, NASPA Journal, vol. 24, no. 3, pp. 28-32.
Mason, J 2017, Qualitative researching, SAGE, London, UK.
Sapri, M, Kaka, A & Finch, E 2009, ‘Factors that influence student’s level of satisfaction with regard to higher educational facilities services’, Malaysian Journal of Real Estate, vol. 4, no. 1, pp. 34-51.
Woodall, G, Herrera, R, Thompson, J & Ortega, J 2017, ‘Is an early start the best start?: evaluating the effectiveness of a political science summer bridge program’, Journal of Political Science Education, vol. 13, no. 4, pp. 447-463.