Introduction
The City of Oklahoma has a specific mission of providing quality, committed leadership, and ensuring equal distribution of resources. To attain this mission, the Oklahoma City leaders provide proper infrastructure through ensuring proactive and reactive services. They offer excellent stewardship of public assets and create effective partnerships that promote employment opportunities for individuals while creating a comfortable environment for the success of businesses. The Oklahoma City has embarked so much in ensuring their budget is up to standard. The economists of Oklahoma City work tirelessly towards the provision of high-quality products and services to ensure efficiency and the removal of barriers to future development (Dowler, Ferbrache, McSpadden, Stroope, Fike, & Kelly, 2012). This paper will analyze the payroll of the Oklahoma City public workers, analyze the trend of expenditure, forecast the future of the expenditures, and give a brief overview of capital budgeting.
Payroll Forecast
Oklahoma City has an apportioned $6,717,773,223 to its total revenue for the financial year, 2013/2014. It has also apportioned $6,717,766.766 to its total expenditures leaving behind a balance of $6,462. The agency’s compensation for employees amounts to approximately $2.4 billion for the fiscal year 2014. It happens that an agency with a growing economy will obviously have an increasing trend in the general revenue collection and consequently an increase in total and employee expenditure (City of Oklahoma, 2013). In Oklahoma City, there would be a 2 %, 4 %, or 5 % pay increase in the wage bill for the fiscal year 2014 depending on the expansion of the budget, but this would have some consequences on the budget. It will be a burden to the budget to accommodate the rising benefit cost. The consumer price index increases from time to another and thus the employees would propose a salary or benefit increment.
Such benefits, in this case, would comprise of medical insurance, commuter allowance, entertainment allowance, house allowance, and disability insurance among many benefits. This will have a greater benefit to the employer as their general social welfare will improve. They will have an improved lifestyle and therefore the associated benefits of an increase in employee benefit include:
- Ensuring a controlled health care system
- Increased tendency of retaining employees
- Increased employee satisfaction thus improved productivity
While the government would undergo an increased cost of paying the additional benefits, the productivity, and thus the general GDP would have an increasing tread (Dowler, Ferbrache, McSpadden, Stroope, Fike, & Kelly, 2012). A 2% increase in benefits and salary will have a slugged increase in GDP while a 4% increase will have a sharp increase in GDP. However, any further increase will have a flat return in GDP. This means the agency will be spending more on the wage bill, which would affect other sectors of the economy. The following charts represent the changes in output for a 2%, 4% and 5% pay raise for the fiscal year 2014.
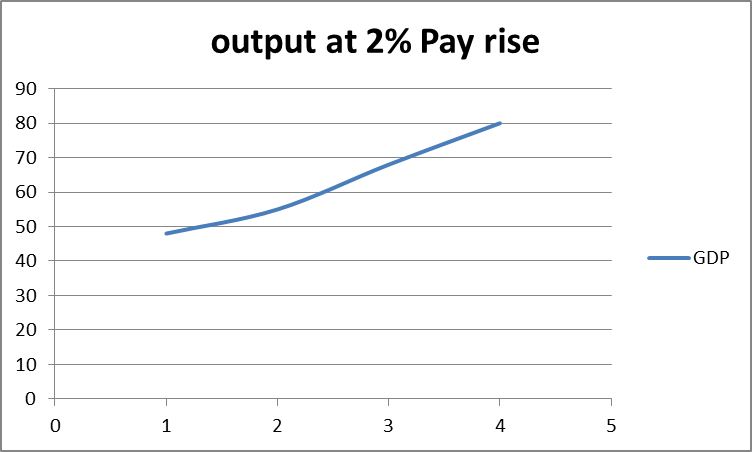
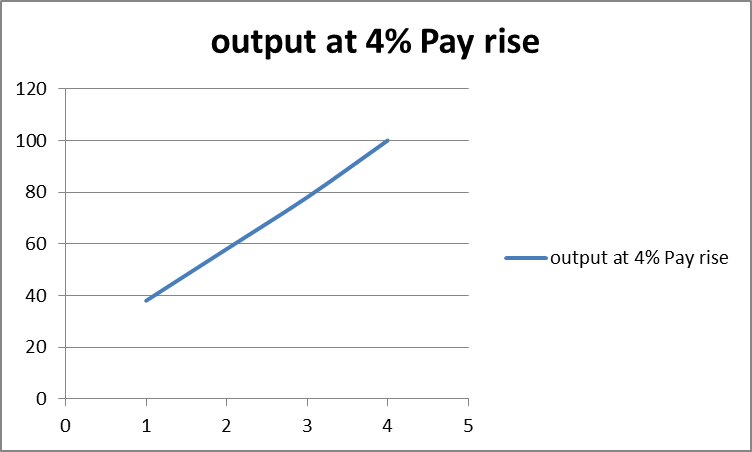
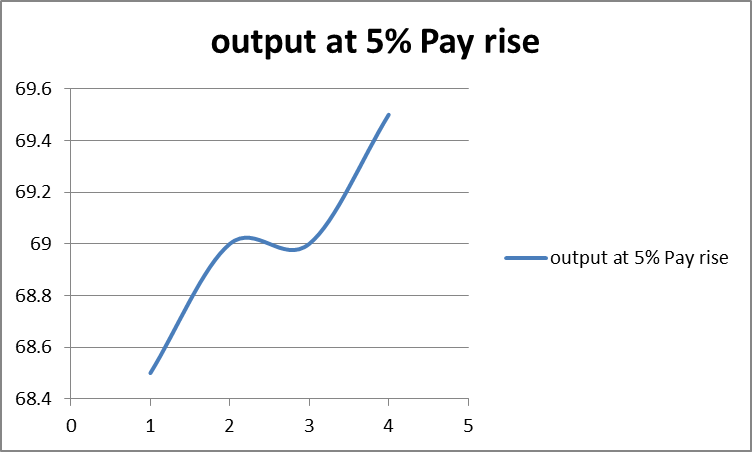
The following chart will present the combined benefits in GDP levels of a 2%, 4%, and 5% increased trend of a pay increase in the year 2014 in Oklahoma City.
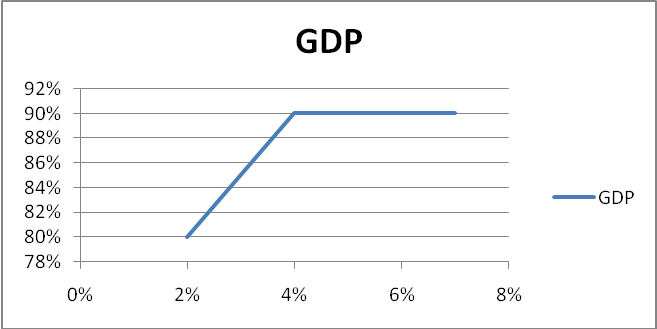
From the chart, it is noteworthy that an increase in employee pay and benefits from 2% to 4% will cause a rise in the GDP levels. Further increase from 4% will not have any effect on the GDP i.e. the pay rise will have reached a diminishing return level. An increase further than 4% will cause the government to overstretch its budget thus cause inconveniences in other budgetary allocations in the fiscal year 2014.
Trend Analysis
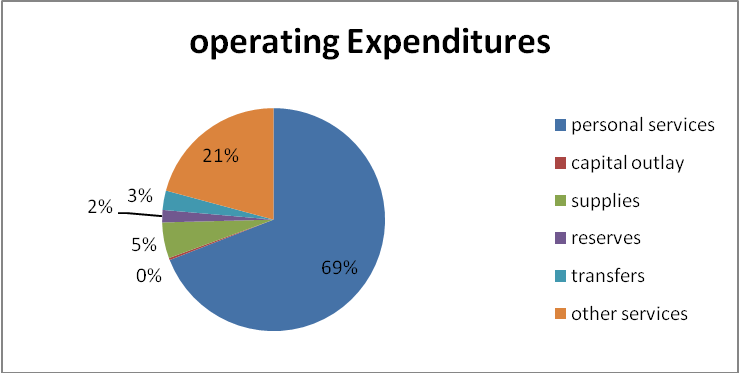
The Oklahoma City budget expenditure is divided between operating and Non-Operating expenditures, which comprise of personal services, supplies, capital, debt services, transfers, and other services (Fallin, 2013). There is also a provision for reservations for future capital costs.
From the pie chart, it is noteworthy that the personal services comprise the largest portion of the Oklahoma City operating expenditures. Of the total operating budget, 69 % takes care of expenses like salaries, retirement benefits, and insurance. On the other hand, the capital outlay takes the lowest percentage, 0.2%of the total operating expenditure.
The trend of the exact amount of monies allocated for the various expenditures over the years 2010, 2011, and 2012 are summarized as below.
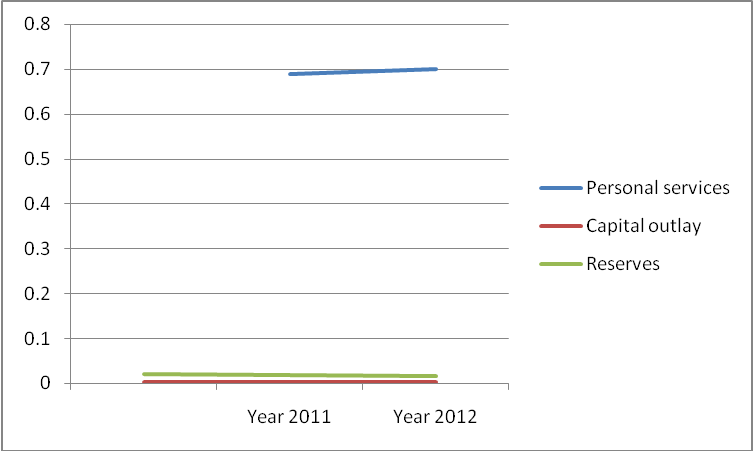
From the table and graph, it is evident that the expenditure on personal services has an upward trend. Records show that total revenue for expenditure increases by at least 20% every year. This means that the increasing expenditure on personal services emanate from the creation of new employment opportunities or raising benefits for the already existing employees. The personal service expenditure has increased from 68% in 2010 to 70% in 2012. This increased expense of personal services is ‘stealing’ from the amounts allocated to reserves.
On the other hand, the expenses of Oklahoma City are analyzed from the functional point of view. The four broad areas of service provided by the city are:
- General Government Functions as taking care of the Manager’s Office, the Municipal Councillors Office, the Office of Mayor and Council, the City Clerk’s Office, Personnel, Finance, and the City Auditor’s Office; comprising about 6% of city’s operating expenditure.
- Public Safety which comprise of which takes care of Police, Fire emergencies, Animal Welfare and the Municipal Courts; comprising 52% of the city’s operating expenditure budget.
- Public Services including Airport, Development Services, Public Works, Planning, Public Transportation, Parking, and other Utilities. These comprise 31% of the operating expenditure budget.
- The Culture and Recreation function as Parks and Recreation facilities, which make up 11% of the operating expenditure budget.
The amounts allocated for these facilities have had fluctuations from time to time as shown in the table below.
Oklahoma City has had an increasing trend of the amount of monies set aside for public safety, public services, and the general government functions. The amounts set aside for recreational services are slowly declining as the years go by.
Expenditure Forecast
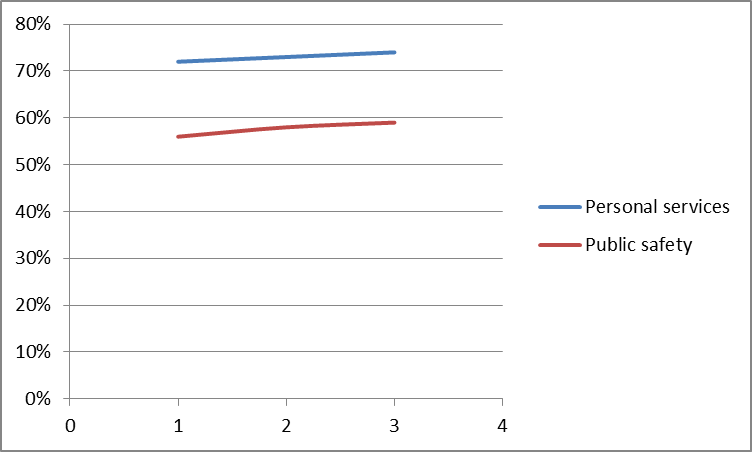
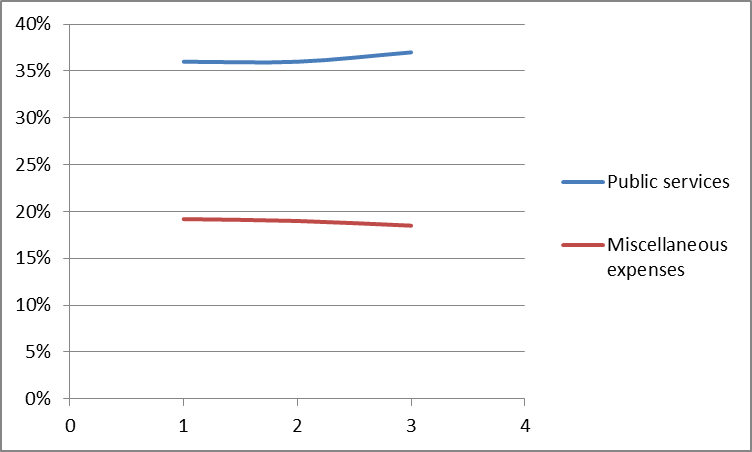
As discussed above, the topmost expenditure allocations are in the personal services, public safety, public services, and the miscellaneous expenses. Over the three years, the amounts allocated for these expenditures increase. The forecasted percentages of the amounts set aside for the four highest expenditures are shown in the table below.
Graphically, over the years, the tread of the personal services and public safety can be expressed as in the graph below. There is an increased tendency one can easily forecast the percentage of the amount to be allocated for Oklahoma City’s operating expenditure in the year 2014 as 72% of the amount set aside for operating expenditures. This is justifiable in that in any growing economy, there is an increased trend of employment opportunities in the public sector. This calls for the employment of more people and thus more monies spend on the wage bills. Moreover, the already employed employees tend to have more allowances as a privilege of working for the government, thus this adds on the personal service expenditure. Public safety becomes more and more wanting with time as insecurity cases do arise (City of Oklahoma, 2013). The government is more likely to increase the number of security centers to protect the increasing population. In the year 2015, the amount set aside for public safety would rise to 58% of the amount of the functional services.
The expenditure on public services has an upward trend. From 30% in 2010, it increased to 34% in 2012. Therefore, prediction shows that the amount set aside for public services would rise to 36% in 2014. This is due to the increased demand for public services as the population increases (Fallin, 2013). The monies set aside for miscellaneous use is slowly diminishing as the specific uses are identified and effectively allocated. Miscellaneous expenses would, for example, be used for building a new health facility to cater to the rising need for health facilities. Therefore, the costs of personal services, public security, public services, and miscellaneous expenses are effectively allocated and should be approved.
Capital Budget
In considering the most viable project to invest in, one needs to employ the capital budgeting techniques. These techniques enable one to take the most viable project that would have less initial cost while yielding profitable returns in the future. About that, we compare the two options available in refurbishing the lighting system of an administrative building.
Option 1
Initial cost (purchase and installation) = $500,000
Estimated lifetime = 20 years
Energy cost = $20,000
Maintenance cost = $ 2000
The total annual cost = $20,000+ $2,000= $22,000
Discount rate = 4%
We calculate the equivalent annual cost (EAC)
EAC for project 1 = 500,000/A20, 4 +22,000 = $58,790
Where A20, 4= /0.04=13.5903
Option 2
Initial cost (purchase and installation) = $100,000
Estimated lifetime = 20 years
Energy cost = $50,000
Maintenance cost = $10,000
Discount rate = 4%
We calculate the equivalent annual cost (EAC)
EAC for project 2 = 100,000/A20, 4 + 60,000 = $67,358.189
Where A20, 4 = /0.04=13.5903
From the literal view of things, one would opt for option 2, which is installing a convectional system because the initial cost is quite low. With that regard, one would discard option 1 because initial cost of $500,000 is prohibitive. However, on employing the equivalent annual cost budgeting method, the annual cost of maintenance is considered. Calculations clearly depict that the equivalent annual cost of option 1, which is installing an urgolight system, is much lower than installing a convectional system. An urgolight system will have an annual equivalent cost of $58,790, while a conventional system will have an annual equivalent cost of $67,358. Therefore, the urgolight system is recommended. The initial purchase and installation cost is quite high, but the maintenance cost is relatively low compared to the second option.
Conclusion
Capital budgeting is very essential for the managers, agencies, and decision-makers to make feasible decisions. The cost of undertaking a project is analyzed while considering its benefits. If in any case, the cost outweighs the associated benefits, then the project is not worth investing. The various expenditures that Oklahoma City undergoes are subject to deep investigation and analysis. As discussed, for example, increasing employee benefits over 4% would result in diminishing returns on the GDP level. The expenditure on public security, public services, and any other expenditures should be under stringent investigation to ensure that misappropriate allocation of the scarce resources does not occur.
References
City of Oklahoma (2013). Your City Budget: FY 2012- 2013 Annual Report. Web.
Dowler, D., Ferbrache, J., McSpadden, J., Stroope, M., Fike, D., & Kelly, L. (2012). Proposed Budget Focused on Priorities: The City of Oklahoma City. Web.
Fallin, M. (2013). State of Oklahoma: Executive Budget for Fiscal Year Ending 2013. Web.