Abstract
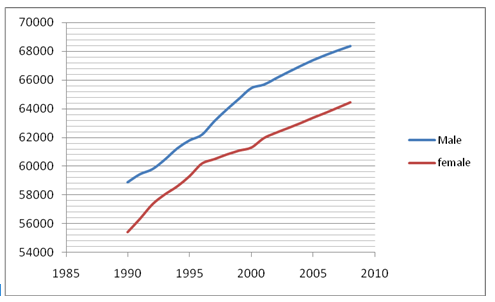
This paper examines the policy of one child per couple in china. This is in regard to the composition of the population of this country. A number of statistics are going to be illustrated and analyzed at length. An important data to be analyzed is the population growth rate data for both males and females in China, from 1985 to 2010.
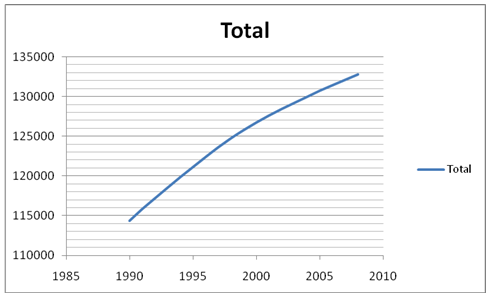
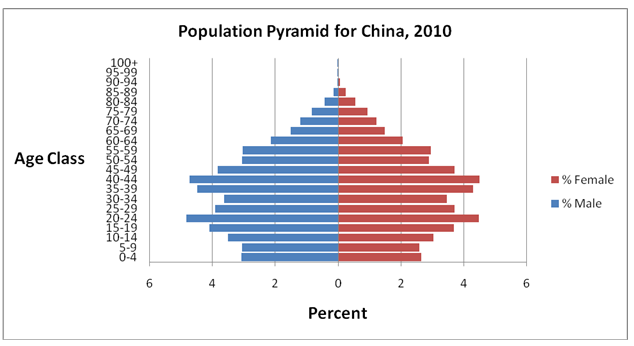
Another data used is the general population of China. The data used in determining if the population is ageing is the dependency rates. There are three rates in this case, the general, the old (working), and the young (working). The rate of death is incorporated in this examination. Finally, a population pyramid is used to give an illustration of the population of China.
Introduction
In China, a policy to plan families was introduced during the eighteenth century to rein in on an increasing population. In this policy, citizens of China were enticed into marrying later than they used to. The time for giving birth was also regulated by this policy.
According to it, married citizens living in cities were to have only a single child, and those in the rural areas were allowed not more than 2 children (Xinhua News Agency par 2).This policy has been credited with reducing China’s population by millions over the past decade.
However, there have been a number of concerns about its effects to the population. One such is the part of the population who are now categorized as old compared to the younger generation. There are now concerns among the authorities who are considering undertaking a policy shift (Xinhua News Agency par 3).
Some population parameters that are used include the total number of people in China, rates of deaths and births, the young people, and their dependence on the older generation for sustenance and the older people who are also dependent on others. Since the policy was implemented in 1978, the analysis will include the population data for the period before and after this time.
China’s population has grown so fast over time. The rate of growth was highest in the nineteen fifties. The graph below shows a great reduction in this rate in recent times.


From these values (whose data is found in the appendix), it is evident that the population growth rate of China continued to grow at a steady rate a number of decades after the introduction of the single child for every couple policy.
What is however evident is that the population growth rate of females is lower as compared to that of women. This has an implication on the sustainability of this population in terms of raising young and energetic individuals who can take over productive roles in the society. This is because women are the ones responsible for conceiving new life.
In China, the dependency between different age groups has been varying for the past fifty years. The dependency ratio is calculated from the proportion of the working population. It excludes those dependent on the working population below 15 years and older than 64 years.
A total of a hundred working people in the same age bracket are taken for every proportion of dependants. “This percentage was 78.49 in 1964 8.21 in 2010” (Li p 65). The values that follow are much more comprehensive about the subject from the year nineteen sixty to two thousand and ten for China as provided by the World Bank.
From figures given below it can be seen that the general age dependency has been on the decline as from the nineteen sixties. This implies that a good percentage of the country’s population has been incorporated into the countries work force gradually year after year.
These are the people who are in the age bracket between fifteen years and sixty four years of age. The reason for this could be the increase in the number of people within this age bracket over time. What cannot be said about this particular dependency is whether it is of the old the young or the old citizens of China. To look at this, it is necessary to look at these two types of age dependency.
The statistics in this table, that is figure five which represents the number of old people over the age sixty four years of age shows a particular trend which is that of a gradual increase in the number of old people who are dependent on the people involved in work.
This means that these categories of Chinese citizens have increased with time in the past years. The likely cause could be the one child policy of maintaining population growth rate which appears to have influenced a slowdown in the number of young people.
We cannot however conclusively say this until we look at the trend displayed by the dependency of the young people over the working population of China.
Looking at figure six, it can be seen that the young dependency rate for China has been on the decline for the past twenty years. This means that for the past fifty years the number of those less than fifteen years of age in the Chinese population has been decreasing.
We can thus say that there has been an increase in the number of people who are above the age of fifteen years in this country over the past year. In the same breath from what has been observed in figure five, we can also say that the number of Chinese citizens above the age of sixty four has increased. These two imply a population that has grown older because of some policy changes
Figure eight in the appendix gives the figures for the death rates, the rates of birth and alongside the rate at which the population is growing. Starting with the figures for the birth rate, it can be seen that save for the first two years, it has been decreasing since 1978.
From a high of 18.25 in that year to a low of 12.21 in the year 2004.For the death rate there are slight declines in it, even though the figures are very marginal, decimals actually they are sustained at the rate of six averagely through out. The population growth rate on the other side has shown some amount of decline except for the year 1981.
The decline is significant, from a high of twelve in 1978 to a low of 5.87 in the year 2004.A low birth rate over the year’s means that few children are born to replace the existing population. This explains the decrease in population rate over time. Since the death rate is almost constant and also low at the average rate of six it means that more people live to their old age.
Finally, an analysis is done to figure out if the population of China is ageing. This achieved by scrutinizing a recent Chinese population pyramid. It can be seen in the figure seven below. The given figures confirm that majority of the Chinese population are above forty four years old, which is the symptom of an ageing population.

Conclusion
The fact finding about China’s population trends indicates a number of things. The first among them is a decline in the rate of growth of the population.
The other notable fact is a reduction in the rate at which the young people below the age of fifteen are dependant on the population over the years. Still on dependency, it can be noted that there is an increase in the number of people above the age of sixty four who dependant on the working population.
From the country’s population pyramid what is notable is that that the age brackets with the most people are those of people between the ages twenty to twenty four years, thirty five to thirty nine and forty years to forty four.
The last two age groups mentioned consist of people who are approaching retirement. Considering the low numbers in children who are five to nine years old and zero to four years, it is important that a reversal in the population growth trend is sought.
Works Cited
Li, Lillian. Fighting famine in North China: state, market, and environmental decline, 1690s-1990s. Stanford: Stanford University Press, 2007.
Xinhua ,News Agency. One child policy pressurized by aging population. 2009. Web.