Introduction
The foundation of most physicochemical studies is a thorough understanding of the principles of instrumental methods of analysis. With such methods, both direct and indirect calculations of unknown quantities can be performed, which significantly simplifies laboratory practice. In this work, the basics of cyclic voltammetry theory were applied to study the potentiodynamic characteristics of chemical media to determine the rates of redox processes in reducing ferrocyanide reaction to ferricyanide using a glassy carbon electrode. The core of this methodology is the cyclic increase in the working electrode’s potential, leading to periodic unloading of the analyzed system. Formulas for determining the potential [1] and peak current [2] were used for this purpose. Besides directly taking voltammograms for four solutions with different concentrations, the diffusion coefficient value was also measured and compared with the reference. The nature of mutual relation of peak voltage and scanning frequency and peak current and concentration of working substance was studied.

Experimental
Reagents
- Potassium Ferricyanide, K3Fe(CN)6, high purity/metal grade.
- Potassium Nitrate, KNO3, metal grade.
Solutions
- potassium nitrate, 1.999 M. Weighed by the difference 10.1076 g of dry potassium nitrate, dissolved in 30 mL of distilled water and quantitatively transferred into a 50 mL flask bringing the solution to the mark.
- potassium ferricyanide, 6.107×10⁻² M. Weighed by the difference 0.5027 g of dry matter, dissolved subsequently in 20 mL of distilled water using a 100 mL flask. Quantitatively transferred into a 25 mL flask and brought up to the mark with distilled water.
Instrumentation
- Pine Research Wavenow Potentiostat.
- Par G0229 Glassy Carbon Milli-Electrode (diameter 2 mm ± 0.2 mm disk).
- Ag/AgCl reference electrode.
- Pt counter electrode assembly.
Procedure
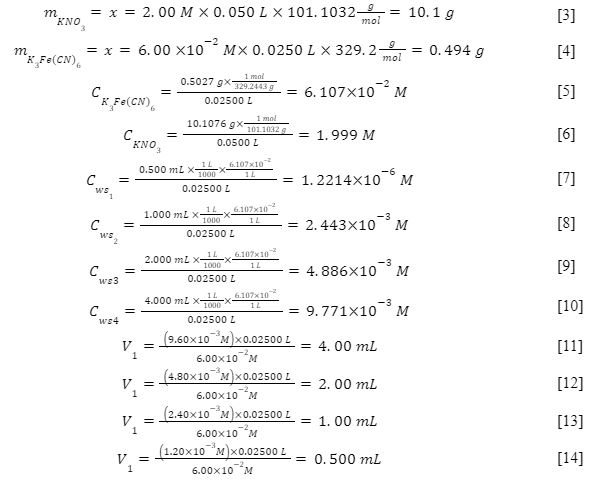
The measurements were performed according to the instructions in the Lab Procedure document. The first step was preparing potassium nitrate and potassium ferricyanide by weighing the dry substance by difference and dissolving in appropriate volumes of distilled water: equations [3] and [4]. The substances were placed in glass flasks for storage. The obtained substances’ concentrations did not practically differ from the reference and were equal to 1.999 M and 6.107×10⁻² M, respectively: equations [5] and [6]. Four working solutions with actual concentrations of potassium ferricyanide equal to 1.221×10⁻³ M, 2.443×10⁻³ M, 4.886×10⁻³ M, and 9.771×10⁻³ M were obtained using the sequential dissolution method: equations [7], [8], [9], and [10]. The liquid volumes required for dissolution were pre-calculated using the formulas shown in [11], [12], [13], and [14]. The concentrations obtained were also slightly different from the reference concentrations given in the manual. For a 10 mL aliquot of all four solutions, cyclic volumetric waveforms were obtained at two scan rates: 40 and 200 mV/sec. For the 9.60×10⁻³ M solution, values at 80, 120, and 160 mV/sec were additionally measured.
Results and Discussion
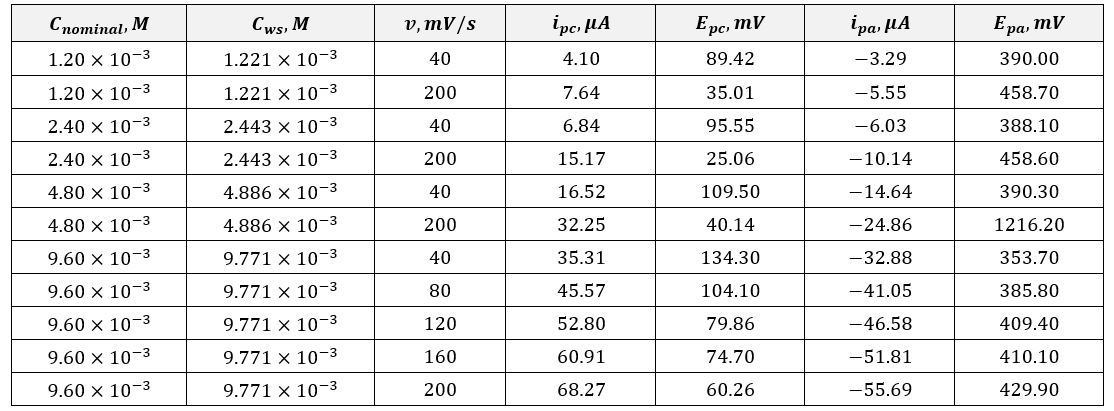
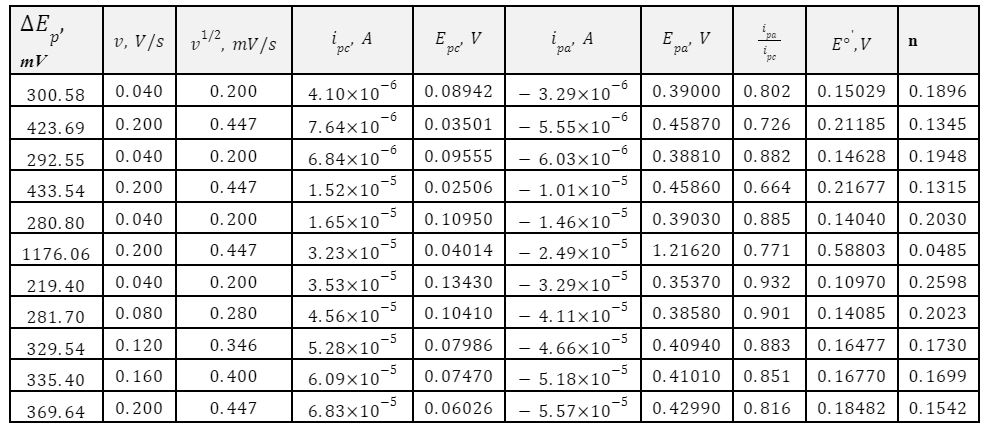
In this laboratory work, the cathodic values of peak current and voltage and their anodic counterparts for four working solutions were measured according to the scheme mentioned above. A total of eleven measurements were made, the results of which are presented in Table 1. This table demonstrates the slight discrepancy in the concentrations of the solutions and the unique voltametric values. Based on the data obtained, Table 2 was formed, reflecting the calculated values with units according to SI manuals. In addition to the information from Table 1, Table 2 shows the indirect calculations’ parameters. In particular, the values of the voltage difference at the electrodes were obtained by subtracting the peak anodic current from the cathodic current, and the calculation of the number of electrons transferred during the reaction was made using the formula [1].
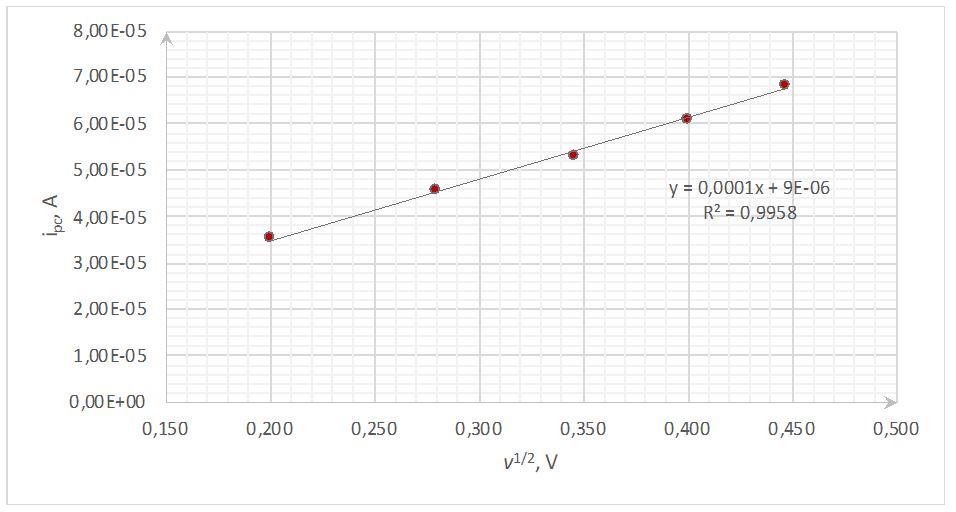
Based on the data in Table 2, three graphs reflecting the volumetric characteristics were plotted. In particular, the dependence of ipc on v1/2 made it possible to determine the diffusion coefficient, as shown in equation [15]. It should be noted that this number does not agree with the reference:![]() . Probable sources of the discrepancy of several hundred units could be errors in current measurements or differences in the study’s approach. For instance, they used dissolution of ferrocyanide in potassium chloride at steady-state pH, whereas this work investigates the dynamics on the electrode walls in potassium nitrate without measuring pH.
. Probable sources of the discrepancy of several hundred units could be errors in current measurements or differences in the study’s approach. For instance, they used dissolution of ferrocyanide in potassium chloride at steady-state pH, whereas this work investigates the dynamics on the electrode walls in potassium nitrate without measuring pH.

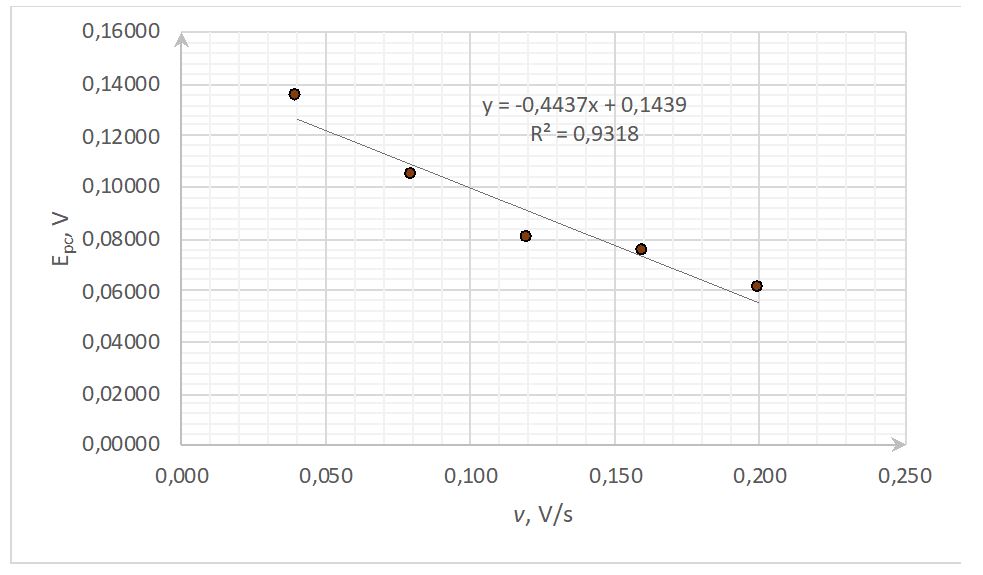
The cathode peak voltage values dependences on the scanning rate shown in Figure 2 illustrate the relationship’s reciprocal nature. In particular, a gradual increase in the scanning frequency was associated with slow unloading of the electrode. This confirms the validity of the formulas [1] and [2], which show the inverse proportionality of the values when combining.
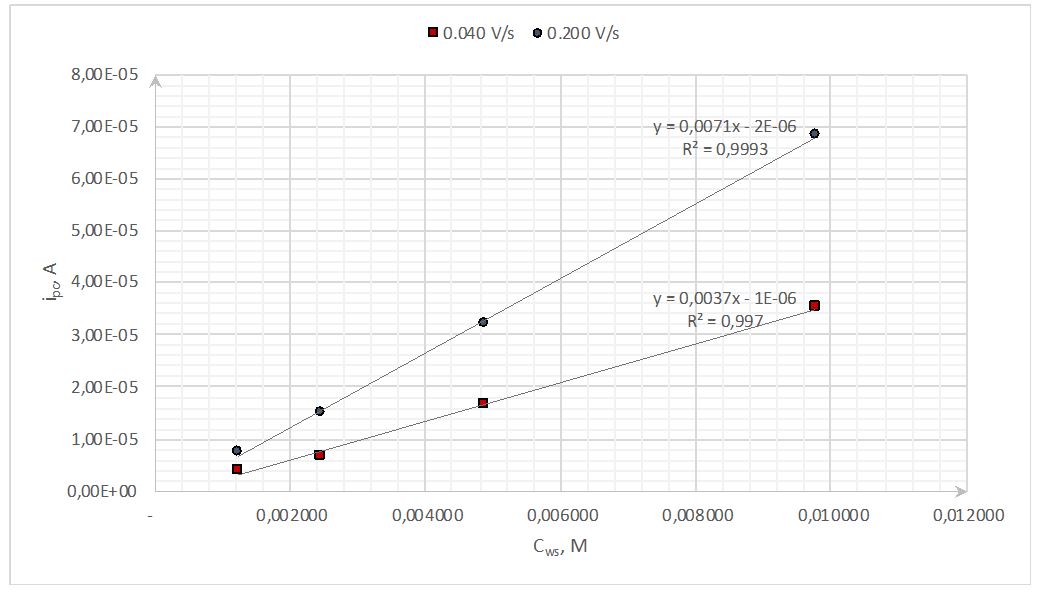
In addition, it has been observed that the cathode peak current naturally increases as the concentration of the working solution increases while the scanning frequency remains the same (Fig. 3). This phenomenon can be justified by the presence of more charged particles in the solution near the electrode wall and, therefore, a higher current. At the same time, the effect persisted when the scanning frequency was increased to 200 s-1. This indicated the independence of the nature of the cathode current from the sweep rate in the pool of substances with different concentrations.
Finally, considering the cyclicity of the electrode wall’s charging and discharging processes, it is appropriate to note that the ratio of anode and cathode currents should ideally tend to zero. The eighth column of Table 2 clearly shows that this is generally true, although achieving zero error in laboratory practice is practically impossible. Thus, Table 2 shows that as the sweep frequency increases, the quality of transients decreases, and many noises appear in the current ratio: the fraction moves away from the reference. Consequently, lower frequency values corresponded to a more standardized charge transfer process. Moreover, it is known that for the same scan rate, a fraction closer to 1 means an increased probability of a reversible reaction. Consequently, when the working solution’s concentration was increased, there was an intensification of ferricyanide oxidation.
Summary
In this work, the effect of working substance concentration on the potentiodynamic reversible Ferri/Ferrocyanide system was measured. Among several findings, it was shown that the system tends to react reversibly with increasing concentration. In addition, the mere increase in the presence of charged particles in solution linearly increased the values of the electrode currents. The work also calculated the diffusion coefficient and suggested potential sources of error.
References
- Baur, J. E.; Wightman, R. M. Diffusion Coefficients Determined with Microelectrodes. J. Electroanal. Chem. Interf. Electrochem. 1991, 305(1), 73-81.
- Hua, X.; Xia, H. L.; Long, Y. T. Revisiting a Classical Redox Process on a Gold Electrode by Operando ToF-SIMS: Where does the Gold go? Chem. Sci., 2019, 10(24), 6215-6219.
- Wang, W.; Fan, X.; Liu, J.; Yan, C.; Zeng, C. Temperature-Related Reaction Kinetics of the Vanadium (IV)/(V) Redox Couple in Acidic Solutions. RSC Adv. 2014, 4(61), 32405-32411.