Research Question
Does performance appraisal-feedback program have any influence on the employees’ self-efficacy?
Hypotheses
H0: Performance appraisal-feedback program has no influence on the employees’ self-efficacy.
The null hypothesis holds that the feedback program has no influence on the performance of employees. This means that self-efficacy measures before and after the implementation of the program has no significant difference. In this view, the null hypothesis assumes that the program is not relevant in enhancing the employees’ self-efficacy. As the director has no clue regarding the direction of the differences, the two-tailed hypothesis testing is suitable.
H1: Performance appraisal-feedback program has an influence on the employees’ self-efficacy.
The alternative hypothesis holds that the feedback program influence performance of employees. Hence, it means that there is a significant difference in self-efficacy measures before and after implementation of the program. Therefore, the alternative hypothesis assumes that the program is important in improving the employees’ self-efficacy. Since the director has no any assumptions concerning the direction of differences, it implies that two-tailed hypothesis test is appropriate.
Variables
Self-efficacy measure (SEM) is a dependent variable of the study because it varied from one individual to another. It also varies due to the appraisal-feedback program, which the study seeks to establish if it has any influence on self-efficacy of employees. The SEM is a continuous variable that range from 10 to 100 depending on the self-efficacy of an employee. Since it is a quantitative variable, the scale of measurement is interval scale. Comparatively, the independent variables are employees before and after implementation of the appraisal-feedback program. Before and after implementation of the appraisal-feedback program, the employees represent qualitative data, which exist in categorical form. Hence, nominal scale is an appropriate scale for the independent variable.
Descriptive Statistics
The case processing summary below shows that fifty individuals participated in the study (N = 50).
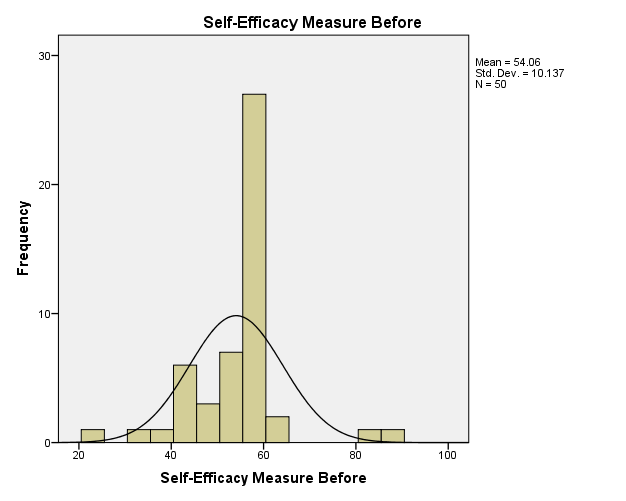
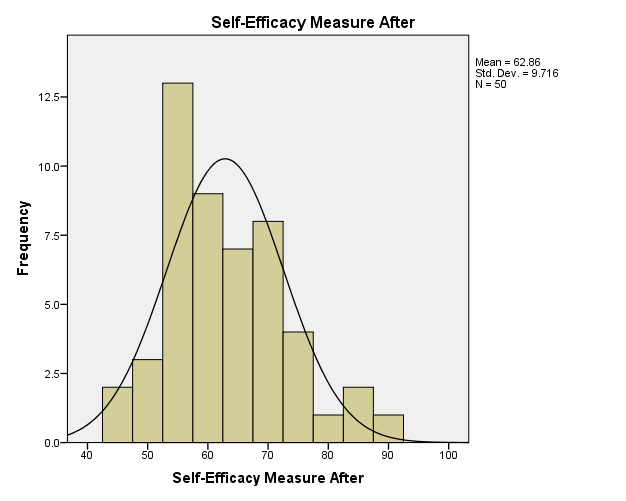
The descriptive statistics below show that there is an apparent difference in the SEM scores before and after the appraisal program. The mean of SEM scores before the appraisal is 54.06 and the standard deviation is 10.137 (M = 54.06, SD = 10.137). Comparatively, the mean of SEM scores is 62.86 and the standard deviation is 9.716 (M = 62.86, SD = 9.716). The descriptive statistics indicate that there is an apparent difference in SEM scores and thus requires statistical analysis.
The median of the SEM score before the appraisal is 56.00 and the variance is 102.751, while the median of the SEM score after the appraisal is 61.50 and the variance is 94.409. The maximum and minimum SEM score after the appraisal is 86 and 23, while that of the SEM score before the appraisal is 89 and 45 respectively. In the analysis of the distribution, the SEM scores before appraisal have skewness and kurtosis of 0.802 and 0.581; while the SEM scores after have skewness and kurtosis of 0.255 and 3.929 respectively. Skewness and kurtosis values that are close to zero follow normal distribution (Jackson, 2012). Hence, the bar graph below shows the distribution of SEM scores of the employees before and after implementation of appraisal-feedback program.


ANOVA Test
To test if performance appraisal-feedback has any influence on the performance of employees in terms of self-efficacy measure, the study employed one-way repeated measures ANOVA. Since the study entailed an assessment of self-efficacy of employees before and after implementation of the feedback-appraisal program, one-way repeated measures ANOVA is suitable. Moreover, the test requires one-tailed analysis because the direction of the influence is clear. Given that the study has a single group that is tested twice, the data do not qualify for the post hoc analysis.
The multivariate table below shows that there is a significant difference in SEM scores before and after implementation of the feedback program. In the table, all the p-values according to various ANOVA tests is less than 0.05 (p<0.05).
The ANOVA test within subjects shows that there is a significant difference in the SEM scores before and after implementation of the appraisal program.
Sphericity F value is 15.949 with a significance value of 0.000. When a p-value is less than 0.05, it implies that there is a significant difference in means, and thus study should reject the null hypothesis (Weinberg, & Abramowitz, 2008). From the within subjects effects, it implies that there is a significant difference in SEM scores.
Likewise, the difference in SEM scores within-subjects contrasts portrays that there is a significant difference in SEM scores before and after the appraisal program. The within subjects contrast has F value of 15.949 and a p-value of 0.000.
Comparatively, between subjects SEM scores has F value of 4510.321 and a p-value of 0.000. Hence, the ANOVA test indicates that appraisal program has a significant influence on the performance of employees.
Conclusion
From the results, one can draw the conclusion that an appraisal-feedback program enhances performance of employees in the organization. However, one should not be certain that the appraisal-feedback program is the only factor that enhances employees’ performance as other confounding variables like experience gained during the study period can enhance employees’ performance. Since the study analyzed the performance of employees in one organization, the findings have low external validity and thus their extrapolation is minimal.
References
Jackson, S. L. (2012). Research methods and statistics: A Critical Thinking Approach (4th ed.). Belmont, CA: Wadsworth.
Weinberg, S., & Abramowitz, S. (2008). Statistics Using SPSS: An Integrative Approach. Cambridge: Cambridge University Press.