Introduction: Statement of the Criterion Variabledelves
This research paper continues towards the goal of examining the standard of living across the 129 or 132 countries for which relevant measures have been assembled in the ACLP database. As in most matters of political economy, standard of living is a valid yardstick for the benefits the population derives from both economic development and good governance.
In the previous paper, we had commenced with an analysis of some correlates of per-capita income as a measure of the comparative wealth of the individuals who are the nation’s governed. But merely dividing gross domestic product (GDP) for any given period over population size – while rather standardized and hence, a useful measure for international comparisons – can mask poor governance and serious inequities. The most glaring, of course, is that per-capita GDP conceals the fact that rising economic activity may be concentrated in the hands of dictators, self-declared messiahs, mullahs who have not the wit to run government bureaucracies, dialectic theorists and their cronies. And such public services as exist do not satisfy the ever-rising aspirations of a people for a better standard of living and quality of life, even those at the most basic level: food sufficiency, sanitation, primary health care, education, jobs, and a stable currency. A country’s rising “wealth” may have precious little trickle-down effects, especially in the face of civic disorder, unstable governments, or long-running ones that care little about the long-term good of the people.
This is one reason why the United Nations and other multi-lateral agencies go beyond GDP to urge governance according to more widely benevolent goals such as those in the Human Development Index. The HDI extends to such indicators as child life expectancy, climate change, births attended by skilled health personnel, contraceptive usage, gender issues, etc. (source: United Nations Development Programme).
In turn, any halfway benevolent government with the slightest egalitarian sense realizes sooner or later that income distribution (also known in more familiar terms as the “rich-poor gap”) is a critical goal if one is to subdue urban unrest, insurgency in the countryside, and be seen to promote the common welfare.
The theory this current research paper propounds is that more equitable income distribution is an end-result of income growth due to economic development, a tradition of benevolent governance, the absence of civic strife owing to intractable religious or ethnic conflict, a regime that manages to maintain law and order, some basic form of participatory democracy, and an economy making the transition from purely agriculture and extraction to a greater contribution from the industrial and service sectors.
Operationalizing the Concepts and Variables
In the ACLP database, the criterion variable for the inequality of income distribution is the Gini ratio. In formal terms, the Gini income inequality coefficient measures the dispersion of personal income (and, by inference, wealth) across the national population. The Gini coefficient takes values ranging from 0 to 1 where 0 is perfect equality (the egalitarian ideal, all citizens have the same income) and 1 stand for perfect inequality (one person has all the income, everybody else earns nothing). In turn, the alternative term “Gini index” is simply the coefficient in percentage form.
Table 1. Summary Descriptive Statistics: Gini Index
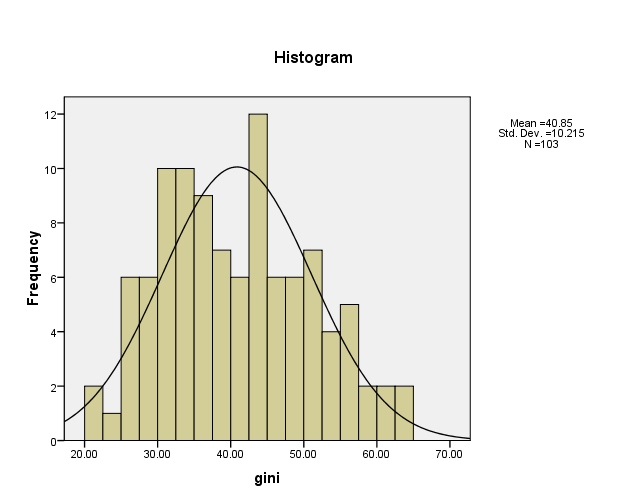
The ACLP database reveals that, for 103 countries reporting such information, the range of the Gini ratio was from 20% to 63% (see Table 1). The former is rather close to the “perfect equality” end of the distribution.
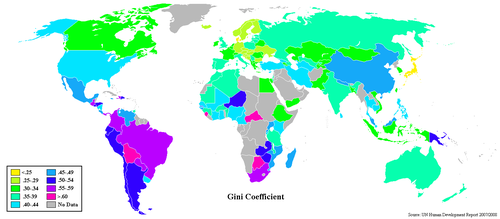
Around the world, the income inequality situation would seem to segment countries into two. The first group, very likely industrialized and/or free-market economies, cluster around a secondary mode of between 30 and 35 Gini ratio points. The most developed European nations, chiefly the original Common Market signatories plus the UK, show Gini indices of between 24 and 36. The second world grouping, presumably less-developed countries, cluster with distinct kurtosis around the modal class interval of 42.6 to 45.0 ratio points, and form a “heavy tail” to the right. Figure 1 also reveals that the overall distribution is distinctly bipolar. The mode is to the right of the mean and median. Nonetheless, the differences are by no means extreme. Nearly two-thirds of the countries (± 1 standard deviation) are within 10.2 ratio points from the mean.

One caveat is that the Gini ratios are not perfectly comparable across countries because the national statistics agencies operate with slight variations in what constitutes income. One country may report solely cash income while another will incorporate the cash equivalent of gifts and payments in kind (e.g. tenants paying their landlord with a half share of the harvest). A second caveat is that one number hardly represents the totality of income equity in even a small country. More sophisticated treatment of Gini coefficients delve into inequality within an income stratum, net inequality between income groups, and what Costa and Morales term the “intensity of transvaluation between subpopulations” (from International Advances in Economic Research, 2008). Yet a third caution is that where there is a sizeable underground economy – as in newly industrializing economies like Brazil or the Philippines, and in former socialist countries like Russia or the Ukraine – the official Gini numbers overestimate the extent of income inequality. Nonetheless, the Gini index is a widely accepted benchmark of the results of welfare and compensation philosophies and policies.

One by no means contends that the Gini index is an all-encompassing descriptor of the economic wellbeing of the population. For instance, high inflation can erode incomes and whether family incomes are reported in nominal or real terms, the Gini ratio is static, suggesting that income inequality is unchanged. And yet, it is inherent in the income inequality situation that those with greater incomes have the discretionary incomes to surmount fast-rising CPI and the savings to invest for a future stream of income. Nonetheless, growth with equity is a worthwhile political, economic and societal goal because attaining progress towards equality reduces social frictions, puts a damper on crimes against property, opens up opportunities for capital formation, and ultimately, stabilizes government regimes.
Hypotheses About Causation and Antecedents
Given the broad range of welfare and compensation variables that can impact the Gini index in any country, this research proposes a shortlist of independent variables as antecedents for hypothesis testing, eight that could show a positive linear relationship and six others for which (bearing in mind that a lower Gini number is to be desired) one expects an inverse relationship:
Analysis

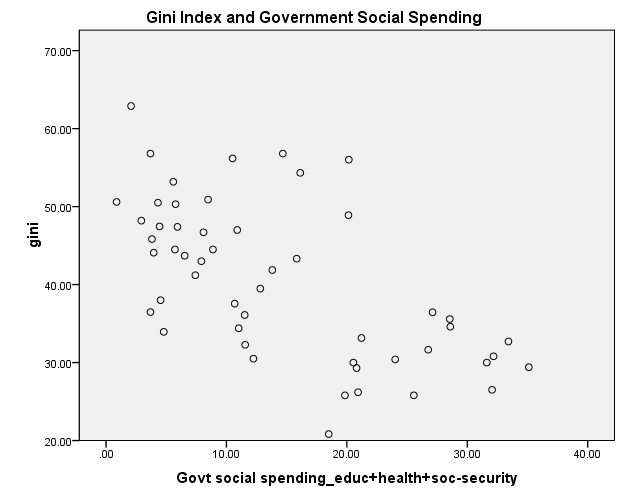
One of the least intuitive relationships in this juxtaposition of the Gini index and the IV’s is the effect of social spending on the part of the government. But the rationale for investigating such a relationship could well be that government spending on health services, free medicines, free education, and welfare payments constitute a return in kind of income that has been taxed. To the extent that such fiscal-sourced subsidies flow to the poorest first, one should certainly expect poverty reduction and, on the assumption that the well-off are disproportionately taxed, some redistribution of income and hence somewhat reduced inequality.
The other hindrance of such an analysis is that scatter plots such as Figure 4 (above) mislead at first sight. The trend line should be downward-sloping and hence, affirm an inverse relationship. It is an inverse relationship of numbers: As government social spending rises, the Gini index for a “typical” country falls. Recalling that lowering the inequality index is a worthwhile social goal, one interprets the relationship correctly as the lower government social spending falls, the worse the inequality index.
Table 2: Leading Correlates of Gini Index
The same situation is evident when the “gxpdssec” correlation is tested against the DV: as government spending on social services as a percentage of GDP rises, inequality falls.
A series of Pearson’s correlation runs reveals that each of the 15 IV’s selected is significantly correlated with income distribution on at least the 0.95 confidence level. But the question remains: can a value for the Gini index be predicted from deciding on what values of the discretionary IV’s to deploy or control?
The answer lies in multiple linear regression which provides the benefits of quantifying the relationship of the many IV’s as a group (understanding the relationship) and improving the extent to which one can move towards improved Gini indices given some flexibility in, say, implementing family planning practices and raising government social spending.
Evaluation of Results
The result is a model that predicts a value for the Gini index at greater than 0.99 confidence level and for which the strongest IV relationships are shown by government social spending, secondary education opportunities for women, robust investment, and political stability.