Introduction
Thermodynamics is a branch of science that investigates the association between the heat conveyed into and out of an object and the work carried out by the object. Heat and work handle the transmission of energy. However, heat entails energy transmission because of a temperature disparity (Turns, 2006).
An adiabatic process is a physical process that assumes the absence of heat loss or gains in a system when work is done. This phenomenon is in line with the first law of thermodynamics, which implies that energy is neither gained nor lost, but is transformed from one form to another (Zumdahl, 2007). The best illustration of the adiabatic process is in the form of the equation PVn = constant where p corresponds to the pressure, v corresponds to the volume and n is the polytropic coefficient, which corresponds to the proportion of specific heats within a restricted range. A process that obeys the above equation is referred to as a polytropic process (Turns, 2006). An adiabatic process presumes that the reaction vessel is perfectly insulated and that no heat is lost to the environment.
The expansion and compression of gases are useful processes in various mechanical and natural applications such as the operation of the Carnot engine and the formation of clouds. Clouds form when the temperature of the air is reduced to the dew point and saturation through adiabatic cooling in rising air packages.
Carrying out simulations and experiments on the transition states of different gases enables a comparison of the transition states in ideal and real situations. During simulations, computerized software is used to measure the adiabatic temperature and make-up of various gases at various pressures. The main objective of this lab was to determine the polytropic coefficient for the adiabatic expansion of a range of gases. The lab also aimed at comparing the coefficients with simulations for reversible adiabatic expansion using Gaseq software.
Experimental Methods
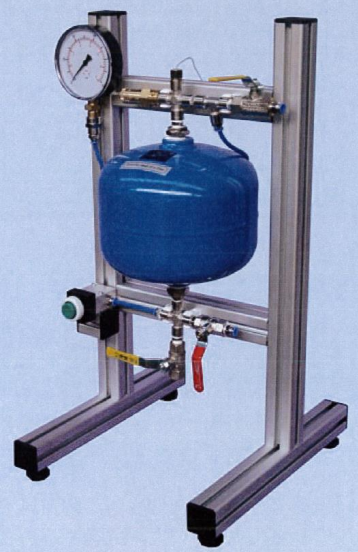
The experimental apparatus shown in figure 1 below was used to determine the temperature and pressure of four gases namely pure air, argon, nitrogen, and carbon dioxide. It comprised a steel vessel with a built-in inlet and purge valves, a safety valve, pressure gauge, thermocouple, and a button actuated release valve.

The air pressure and room temperature at the start of the experiment were recorded as P1 and T1. The red inlet valve was opened and filled with gas to 6 barg, which led to an increase in temperature. The gas was allowed to cool to room temperature while maintaining the pressure of 6 barg by the addition of more gas. Once the gas was within 1 oC of room temperature, it was expanded by venting. The green button was pressed to release the air until the pressure was 5 barg. The lowest pressures on the gauge, as well as the lowest temperature of the thermocouple, were recorded to the nearest decimal place. The release of the gas led to a temperature increase, which was recorded once it was within 1 oC of room temperature. The above procedure was repeated while targeting pressures of 3, 2, and 1 barg during the release of the gas. The experimental values were used to complete tables 1 to 4 for air, argon, nitrogen, and carbon dioxide.
The “Adiabatic compression/expansion” problem type in the Gaseq software (Morley, 2010) was used to simulate the above gas transitions. The pressure gauge readings in the bar were converted to atmospheres because the Gaseq software worked in atmospheres. Adiabatic simulation results in the yellow highlighted boxes were entered in the provided Excel spreadsheet. The “Frozen Chemistry” box was checked as well as the “View species” box followed by a selection of the gases. The mole fraction of the gas was entered as 1. The reactant pressure in atmospheres and temperature were entered, followed by pressing the calculate button to generate the product temperature and gamma values, which were recorded.
Results and Discussion
Table 1 lists the results obtained from the experiments with air: p1 is the pressure at the start of the transition, p2 is the pressure immediately at the adiabatic expansion, p3 is the pressure after the isochoric heating to room temperature. Similar data for argon, nitrogen, and carbon dioxide were recorded in tables 2, 3, and 4 respectively.
Table 1: Experimental pressures and temperatures for air. The table also lists the calculated n and T2 values.
Table 2: Experimental pressures and temperatures for nitrogen. The table also lists the calculated n and T2 values.
Table 3: Experimental pressures and temperatures for argon. The table also lists the calculated n and T2 values.
Table 4: Experimental pressures and temperatures for carbon dioxide. The table also lists the calculated n and T2 values.
The value of n was computed using the equation =1-1/n.
For air at 6 barg, P1= 5.921538 atm P2=4.934615 atm, P3= 5.141869 atm, T1= 295.9 K and T3=295.5 K.
Therefore, =1-1/n.
0.9584= 0.83331-1/n let 1-1/n be equal to x
0.9584=0.8333x
Log 0.9584=x log 0.8333
-0.01846 =-0.07918x
X= 0.23308
1-1/n= 0.23308
1- 0.23308= 1/n
n=1/0.76693
n=1.30
The atmospheric pressure in the room was 100.8 hPa

The value of n was computed using the equation =1-1/n.
For air at 6 barg, P1= 6 barg P2=5 barg, P3= 5.21 barg, T1= 22.9 and T3=22.5.
P2 had an error of ±0.05 while the P1, T1, and T3 had errors of ±0.01 each.
The largest values of P1, P2, P3, T1, and T3 were 6.01, 5.05, 5.22, 22.91, and 22.51, which were equivalent to 5.931407 atm, 4.983961 atm, 5.151738 atm, 295.91K, and 295.5K.
The lowest values of P1, P2, P3, T1, and T3 were 5.99, 4.95, 5.2, 22.89, and 22.49, which were equivalent to 5.911669 atm, 4.885269 atm, 5.132 atm, 295.89K, and 295.49
The largest value of n was calculated using the largest values of the computation parameters, which gave n= 1.36.
The lowest value of n, similarly, was computed using the lowest values of the computation parameters, which gave n= 1.25.
The computed value of n was 1.30.
The error in n values = (1.36-1.25)/2
=0.055
The error in all the n values was equal to ±0.055.
The experimental values of T2 were lower than the calculated values of T2 due to poor accuracy in the measurement of the temperatures. During the cooling process, there was a rapid drop in temperature, which was difficult to measure precisely. Therefore, it was likely that the final measurements of T2 were obtained long after the correct cooling temperature had been reached.
Table 5: Average n values for the experimental adiabatic expansion. The table also lists the ratios of specific heats

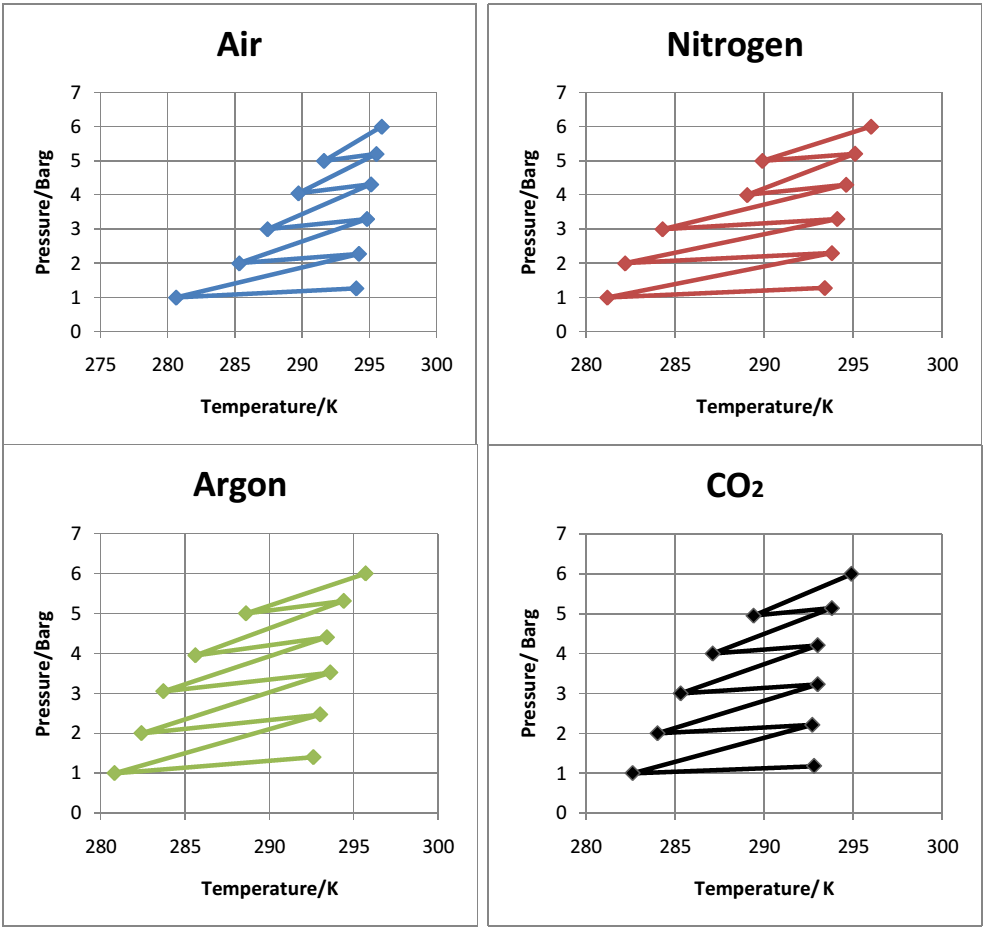
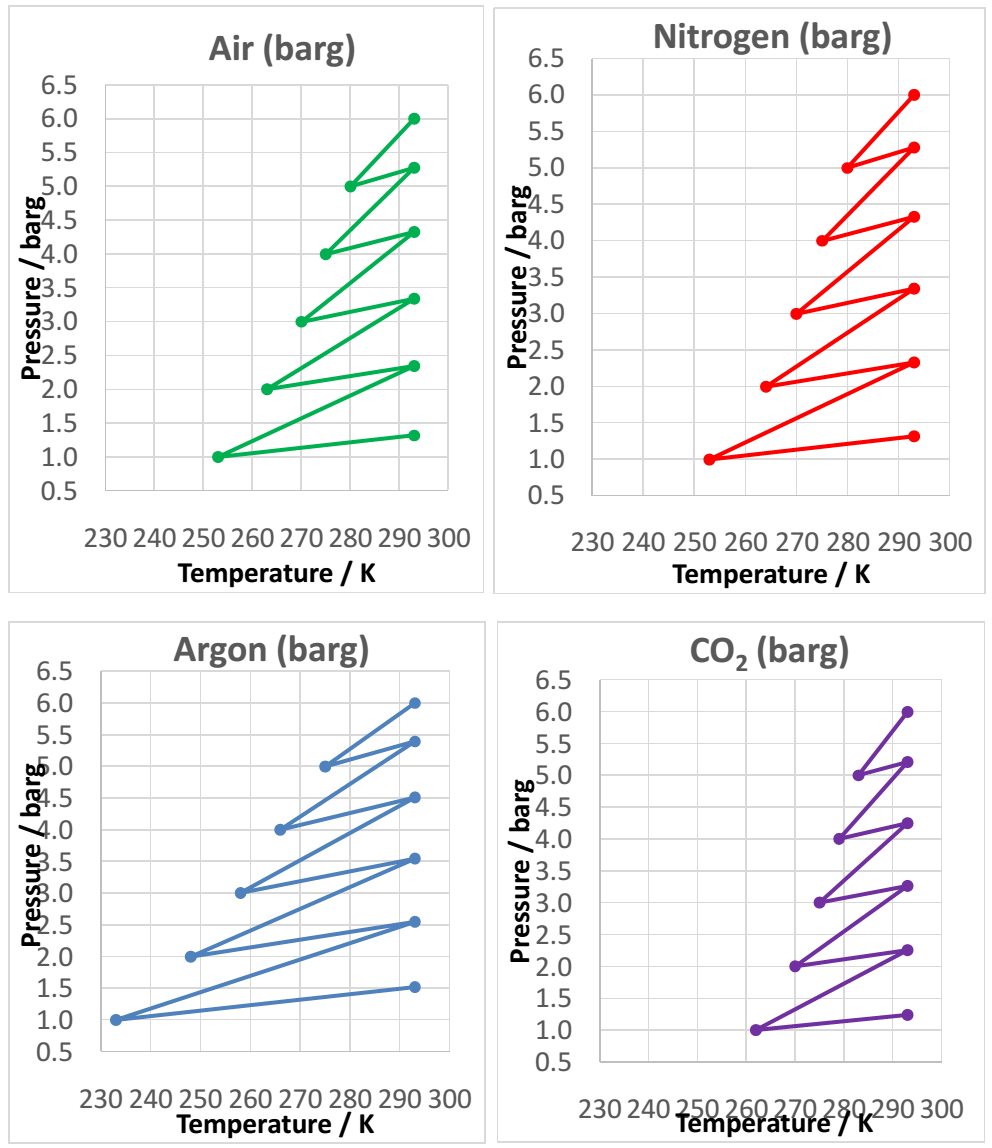
It was observed that argon expanded and contracted over the widest temperature range while carbon dioxide expanded and contracted over the lowest temperature range. Air and nitrogen expanded and contracted over a similar temperature range. It was also observed that the minimum temperatures in the experiment were higher (approximately 280 K) in the experiments compared to the simulations (approximately 250 K). The differences in the experimental and simulation values could be attributed to experimental errors such as leakage of the valves and poor sensitivity to temperature change by the thermocouple.
Conclusion
The key principle that connected the findings from the experiment and the simulation was the effect of temperature and pressure on gas molecules. During the expansion of gases, there was a decrease in the atmospheric pressure of the air pockets of the gases. The pressure decreased because the frequency of the collision of the gas atoms with the walls of the container was reduced. Thereafter, the kinetic energy possessed by the molecules took part in expanding the volume of the gas, which led to the slow movement of the gas molecules that was accompanied by a decline in temperature. This process was what was referred to as adiabatic expansion or adiabatic cooling. When the valve was closed, the volume of the container was reduced by increasing the ambient pressure. The frequency of clashing of gas atoms intensified thereby leading to a corresponding rise in temperature in a process that was referred to as adiabatic heating.
The differences in the experimental and simulated values arose due to the possible loss of heat to the environment. Adiabatic processes assumed that no heat was lost or gained. However, the simulation took place under ideal conditions where perfect insulation is possible. The experiment could be improved by enhancing the efficiency of the valves and the sensitivity of the thermocouple.
References
Morley, C. (2010). Gaseq chemical equilibrium program. Web.
Turns, S. R. (2006). Thermodynamics: Concepts and applications, volume 1. Cambridge: Cambridge University Press.
Zumdahl, S. (2007). Chemical principles. USA: Cengage Learning.