This study consisted of 86 respondents who were asked to answer questions related to alcohol use and potential predictors of intent to drink in the future. The total number of those respondents who said they had not used alcohol in the past (58.14%, n = 50) was greater than those who had (41.86%, n = 36). Notably, the question about the frequency of past alcohol use demonstrates a slightly different context, as 44.19% (n = 38) of respondents reported a non-zero level of this consumption; in other words, two participants stated that they had not used alcohol before but then reported the frequency of this consumption. Since these data were contradictory, it was decided to focus on the first data, which reported that only 36 participants had consumed alcohol in the past. Intention to consume alcohol in the future, measured as levels from 1 to 9, where 9 was the maximum degree of intention, was used as the dependent variable. Thus, the critical question was whether there was a significant difference in intention to use alcohol between those who had and had not used alcohol in the past.
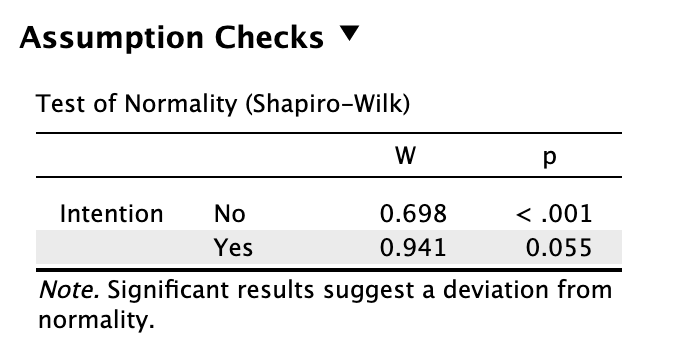
A two-way t-test for independent samples was conducted in which the samples represented respondents who answered “Yes” and “No” to the question about drinking alcohol at home. The mean value in the alcohol intentions label for those who had already had such experiences, 4.667 (SD = 2.323), was significantly higher than for those who had not previously consumed alcohol, 2.187 (SD = 1.873). The results shown in Table 1 demonstrate that t(84) = -5.475, p <.001, from which it can be concluded that the mean values of the samples in intention to drink alcohol are not equal. In other words, the test results prove that there are statistical differences in intention to drink in the future depending on respondents’ past experiences. An additional Shapiro-Wilk test for normality of distributions showed that only respondents who answered “Yes” had a normal distribution; the results are demonstrated in Table 3A below.
Table 1: Results of the t-Test for Independent Samples

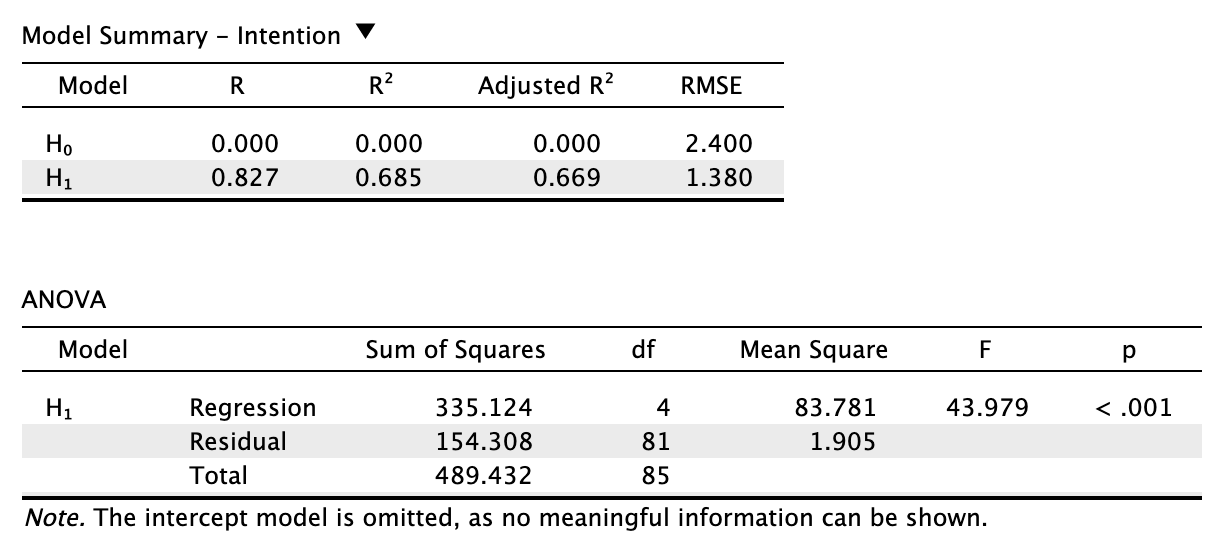
The second research question was to determine whether prior drinking levels, attitudes, social norms, and self-efficacy could significantly predict future drinking intentions. Predicting variable values through multiple independent factors simultaneously refers to multiple regression, hence, an appropriate test in JASP was chosen to test this question (Grant, 2019). According to Table 4A, the constructed multiple linear regression model had statistical significance because the corresponding p-value for the ANOVA was significantly below the critical alpha level: F(4, 81) = 43.979, p <.001. In addition, R2 =.685, which means that the constructed model covered up to 68.5% of the variance of all data.

Table 2 shows the coefficients of the constructed linear regression model with their statistical significance. It can be well seen that all factors except social norms had a significant effect on increasing intentions to drink alcohol in the future.
Table 2: Coefficients for Multiple Regression
Implicit Association Test
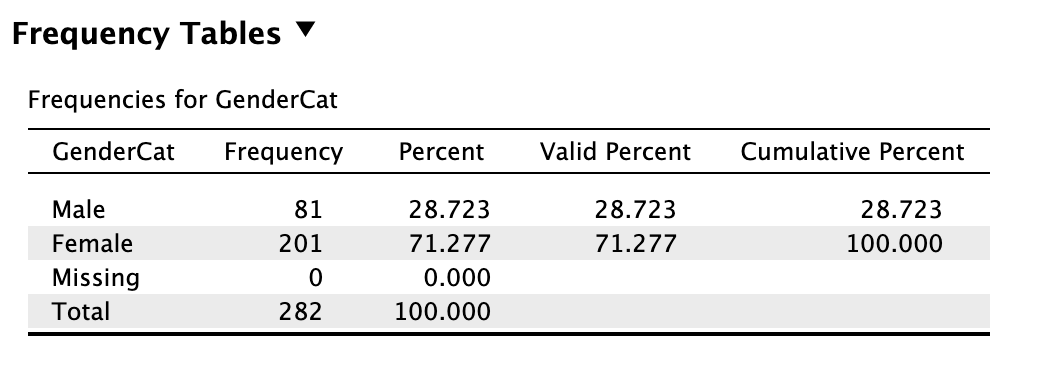
For the second data set, the relationship between response time and the nature of the response, namely congruent and incongruent, was subjected to statistical analysis. The sample consisted of 282 participants, with an average of 2.5 times as many women (71.28%, n = 201) as men (28.72%, n = 81), as shown in Table 1B.

In terms of ethnicity, the largest portion of the sample was Caucasian or White (46.10%, n = 130), followed by Hispanic (15.60%, n = 44), Asian (14.89%, n = 42), African-Caribbean or Black (12.41%, n = 35) and finally American Indian (10.99%, n = 31). The first question asked whether there was a significant difference in mean reaction times for congruent and incongruent reactions. Descriptive statistics reported that the mean reaction time for incongruent reactions was 1.215 (SD = 0.360), slightly higher than for congruent reactions, 1.117 (SD = 0.578). To evaluate the statistical difference of this separation, a one-way t-test for paired samples was used to test the hypothesis that μ1 < μ2. Table 3 shows the results of the analysis; in particular, the mean time for incongruent reactions was not significantly different from congruent reactions, t(281) = -1.571, p =.059. In other words, the difference between the mean time values for both types of reactions was statistically insignificant.
Table 3: Results of the t-Test for Paired Samples
The second research question was to determine the significance of the interaction between respondents’ ethnicity and implicit associations. In other words, the hypothesis that ethnic differentiation affects the recognition rate of congruent and incongruent reactions was examined. To find this interaction, it was decided to use pairwise correlation analysis, showing the strength and direction of the relationship between the variables. Table 4, showing the results of this analysis, clearly shows that the interaction between time to congruent reactions and ethnicity revealed a statistically significant weak positive correlation, r(280) = 0.158, p =.008.
Table 4: Results of Correlation Analysis
However, for incongruent responses combined with respondent ethnicity, the correlation coefficient was not statistically significant, r(280)= 0.088, p =.139. Thus, it can be concluded that a statistically valid interaction was observed for the relationship between respondents’ ethnicity in the sample and congruent response rate, although this relationship was weak. In comparison, the correlation between response rates for the two types of responses was significantly higher and statistically valid, r(280) = 0.728, p <.001. As a consequence, ethnicity was only partially related to implicit associations.
Reference
Grant, P. (2019). Understanding multiple regression. TDS. Web.