Introduction
Project management involves a series of activities which must follow each other in a sequential way; to interpolate the trend, there is the use of charts and net work diagrams. This paper analyses a project of Building a cordless vacuum cleaner
The Bestclean is a new cordless vacuum cleaner. An analysis of the task of building the Bestclean reveals the following list of relevant activities, their immediate predecessors, and their duration.
The following are the data for the project;
Network diagram for the project
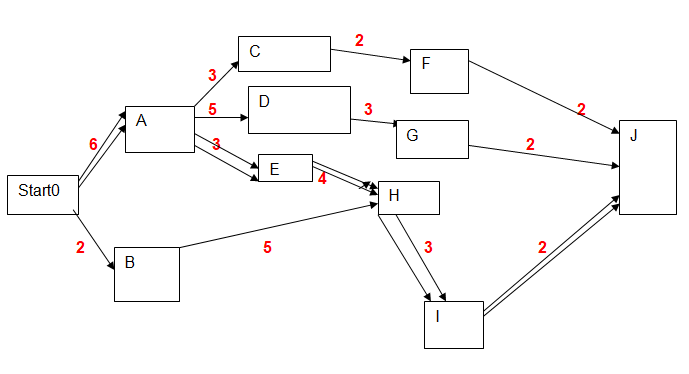
Network analysis
A net work is a diagrammatical representation of a project which interpolates the various activities that are to take place during a program. It has a representation of activities as they follow each other. it shows which activity follows another and which activity can follow either two or more projects.
It does the task by the use of activity-on-node, which are used to represent predecessor activities and successor activities ( Walkenbach, 1997).
Critical path
This is the longest path in a project; it denotes the longest duration that a project will take. In our case the critical path is through,

The total time is 6 + 3 + 4 + 2 + 2 = 17 weeks
The following are the activities along the critical path;
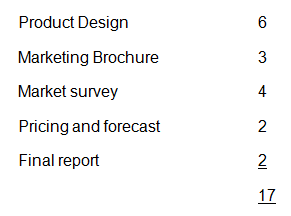
Critical path have no slack or float time. This means that any change on the duration of the crystal path activity will result to a change in the overall duration of the project. If the time is added or there an adoption of some technology that makes the path shorter, they will make the entire project shorter.
Another characteristic of critical path is that there can be more that one critical path in one project. When the critical path of one path is altered it automatically alters the path of the entire project (Pons, 2008).
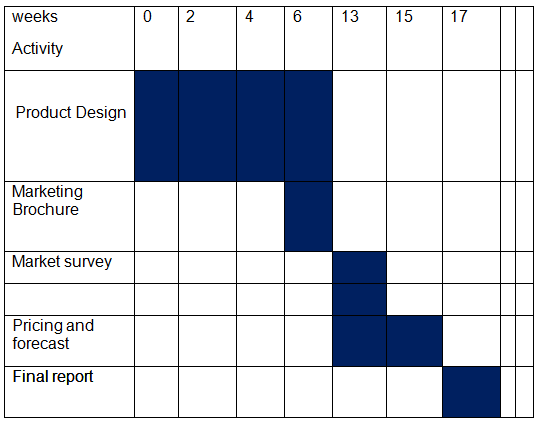
Critical Path Gantt chart
Project duration
This is the period that a certain project is likely to take from start to the finish. In a well managed program, project duration is the duration through which critical path follow. This is because activities along this path have a float time of Zero. Any delay on these activities result to a delay of the entire project activities.
Floats of the non-critical activities
These are functions that are not in the critical path. They can be delayed for a certain period of time and still the project finish in the right time. There is a maximum time that the activities can be delayed, the period is referred to as slack time or float time.
There are three types of floats:
Free floats
This is the maximum period of time that a single project activity can be delayed without affecting the earliest start time of the following activity.
Total float
This is the total delay time that a single activity in the non critical path can be delayed without affecting the duration of completion of the project.
Project float
This is the total duration that a project can be delayed and still ensuring completion at the customers expected time.
In our diagram above, the non critical paths are;
START – A – D — G — J
START – B — H – I – J and
START — A – C – F – J
To calculate the float time of each path, one needs to calculate the time taken in the path then you subtract it from critical path;
Uncritical path 1
START – A – D — G — J duration is 16
Float time is 17-16 = 1 week
Uncritical path 2
START – B — H – I – J duration is 10
Float time is 17-10 =7 weeks
Uncritical path 3
START — A – C – F – J
Float time is 17-13 = 4 Weeks
Knowing the amount of float time helps in resource allocation where the project manager can know the activities that he can hold for a certain time due to a certain reason. One of the reasons that can make a project to be held momentarily is lack of funds or employees (McComb, Kennedy, Green, & Compton, 2008).
Early-start Gantt chart and resource profile for the project
The chart contain the earliest start Gantt chart; it follows START – B — H – I – J duration is 10
The following are the activities:
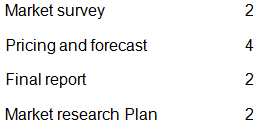
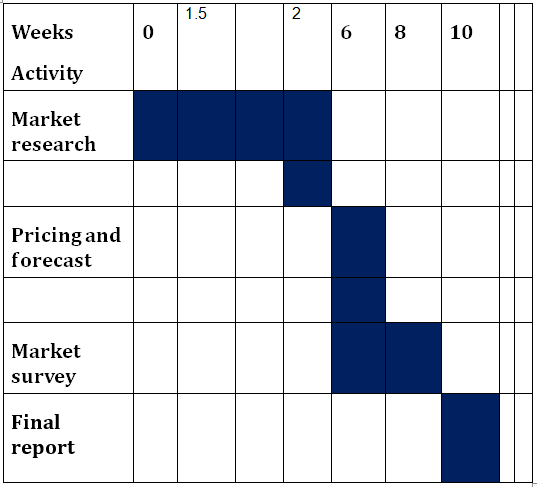
Resource profile for the project
Resource profile for the project is interested on how resources will be distributed in various projects. There are projects which allocation can be delayed (non critical path activities) and there are those which resources must be available if the project have to be completed in good time. They are the activities along the critical path.
In case there is a deficit, then in our case;
Uncritical path 1 (START – A – D — G — J) can be delayed for one week; uncritical path 2 (START – B — H – I – J) can be delayed for a total of 7weeks and Uncritical path (START — A – C – F – J) can be delayed for 4 weeks.
Using the critical path, a project manager is able to give the longest period that a certain project can take. If the project is required at an earlier or later date, then network diagrams are used in adjusting the duration (Kumar, 2005).
Conclusion
Using Gantt chart and network diagram assists a project manager to understand the processes that the project will undertake. When analyzed, those activities which can be delayed for a reason or another are sort. They are managed well not to ensure that they don’t affect the completion of the project in time. Float time are utilized in managing time which a project can be delayed.
Using the critical path, a project manager is able to give the longest period that a certain project can take. If the project is required at an earlier or later date, then network diagrams are used in adjusting the duration.
Bibliography
Kumar, P. (2005). Effective Use of Gantt chart for Managing Large Scale Projects Cost Engineering, 47(7), 14-21. Retrieved from Business Source Complete database.
McComb, S., Kennedy, D., Green, S., & Compton, W. (2008). Project team effectiveness: the case for sufficient setup and top management involvement. Production Planning & Control, 19(4), 301-311. doi:10.1080/09537280802034059.
Pons, D. (2008). Project management for new product development. Project Management Journal, 39(2), 82-97. doi:10.1002/pmj.20052.
Walkenbach, J. (1997). Gantt charts in Excel. PC World, 15(12), 386. Retrieved from MasterFILE Premier database.