Introduction
Qatar prides in some of the best airports, not just in Asia but globally. Similarly, it also prides in top global airlines. Its largest international Airline, Qatar Airways, is amongst the best airlines in the world, and has one of the most extensive route networks, internationally (Qatar Airways, 2010: n.p). The airline’s income has been on the rise over the years. In the 2012 financial year only, the company’s income was £10,827, translating to over 8.4% revenue increase as compared to the last financial year. Throughout its years of operation, the airline has been faced with various challenges
Aims and objectives
- Assessing quality issues affecting Qatar Airline’s operations management
- Recommend action plan to enhance quality of operations management.
Key issues facing Qatar Airways
The company’s annual reports highlight the risks and uncertainties which affect Qatar Airways with emphasis on the ones that are critical for its continued maintenance and operations. Qatar Airways, like other major global airlines faces multiple risks including government regulation non-compliance, infrastructure challenges, competitors encroaching into its markets, staff unrest, Information technology failures, fluctuating oil prices, currency fluctuations, security issues, threat of terrorism, natural disasters, debt funding, interest rate fluctuations, and Middle-East tensions.
At the end of the 70s, air traffic deregulation in the United States opened doors to increased competition. In 1990, the common market enabled deregulation in Europe leading to entry of low-cost airlines. Additionally, the rise of internet platform has largely changed airline-customer relationships. Additionally, the changing economic fortunes, alongside fluctuating fuel prices are major factors affecting the airline industry.
Conventionally, any GDP changes are reflected in the airline usage. The same is the case with fuel prices; sadly, fuel prices today are 50 % more than they were in early 2010. Obviously then the 2009 economic crisis lead to one of the least profitable years in the airline’s history. The global recession and European economic downturn largely affected all international airlines. Consequently, Qatar Airways also recorded reduced bookings due to decline in international travel reservations.
However, 2009 came to be the best year, thanks to reduced fuel prices, demand recovery, as well as growing demand for cargo services. In 2010, the global airline industry made a whopping $15.9 billion profit translating to a 3% margin. Nonetheless, competitiveness remains then biggest challenge the airline industry faces, and by extension, Qatar Airways.
Another important area where Qatar Airways is facing challenges in compliance to the ever-changing environmental governmental regulation. However, it is widely argued that the industry’s interest with regard to carbon emissions is in line with ecologists’; the lesser the fuel burned, the more the money saved. Investment in highly efficient and cleaner engines, light aircraft and biofuel programs mean air travel should move towards being carbon-neutral (Antony, J. et al., 2003). However, such investments are costly. The same cannot be said of. While it is expected to earn from increased flights through its airports, government is keen to open airspace to allow more planes to fly directly to their destinations; this is definitely not good business.
Amongst the major challenges faced by are;
- Reduced number of frequent fliers – due to recession.
- Escalating costs
- Growing demands of better facilities at lower fares
- Stiff competitions from other airports
- Availability of best crew.
Legal suits are also another problem that plagues Qatar Airways and. Lawsuits damage the corporation’s reputation. Other than law suits, loss of cargo technological failures are also an area of concern. According to a study by association of European Airlines, noted that BA lost luggage of an average of nine passengers on each jumbo jet flight in 2008 and was bound to be forced to cancel more than 200 flights in days following the opening of terminal 5 failure of computer log-on for luggage handling which sparked chaos. Additionally, Qatar Airways faced stiff competition from other service providers including Qantas, Jet star and Tiger Australia. Whilst Qantas enjoyed a monopolist reign over corporate sector flyers, Jet star and Tiger gave it stiff competition in low-cost airline market sector (Knibb, 2011).
The environment where Qatar Airways flies is substantially dynamic and hence unpredictable. Amongst the major challenges in the sector include fuel price fluctuations, natural disasters such as floods and earthquakes, staff union strikes as well as the ever changing global economic fortunes. These are elements known to adversely affect the airline industry and not just Qatar Airways. 2008 world economic recession resulted into a huge reduction in leisure travel volumes.
This coupled with the rising domestic competition in terms of pricing made it difficult for Qatar Airways to make any substantive profits as well as other low-cost airlines. Additionally, the increasing market liberation has seen international players also join in competing the market enjoyed by Qatar Airways. Nonetheless, Qantas remains the single largest competitor to Qatar Airways enjoying near monopoly in the business airline sector of the market (Knibb, 2011).
As a game changer, Qatar Airline’s CEO introduced a myriad changes include the revamp of the existing fleet, creating world-class lounges as well as introduction of new staff uniform as a way of attracting the rather choosy corporate travellers. The changes were purely meant to get a share of the rather reserved corporate travel segment believed to make about 20% of the corporate travel sector (Flynn, 2011).
For an organization to be able to sustain itself in a dynamic and extremely competitive environ, there is need for the organization to be able to cope with change (Magnusson, Krsolid & Bergman, 2003: 54). Additionally, there is need for proper planning more especially with respect to the required investments, level of staff involvement/motivation, as well as understanding of the counter-movements by competitors and the outside environs (Shields, 2009). Change is very difficult to predict in an external environment where lots of dynamic things happen. Nonetheless, it is easy to anticipate change if it is to be handled in an effective way. Qatar Airways has made substantive efforts in an effort to market itself and maintain its relevance in the market.
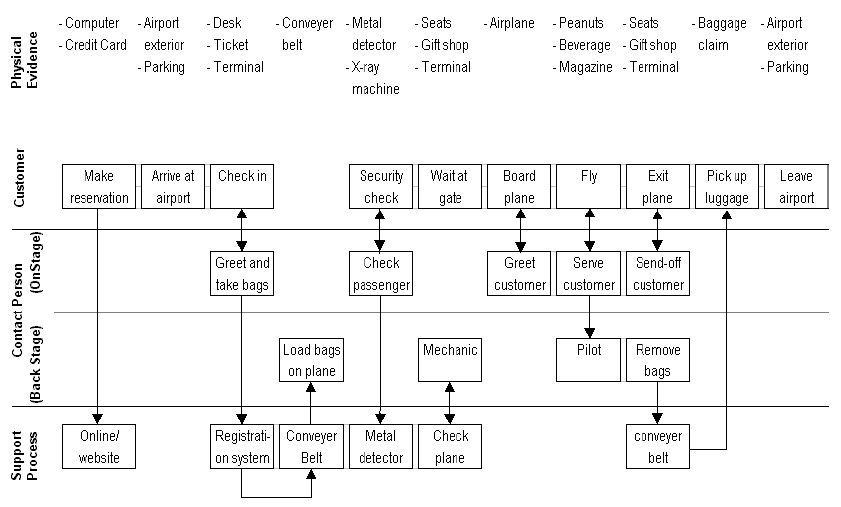
Qatar Airways service blueprint
Airline industry
Over the recent past, the airline industry has undergone extensive changes. Since the mid-90s, new airlines have emerged, some low cost while others expensive and luxurious (Montgomery, 2005: 45). Some have been able to stay afloat while others have gone under a short while after being commissioned. In essence, the mixed fortunes are indicative of the delicate airline industry market and hence it is important that any proposed new airline gains an understanding of the market prior to entry if it is to achieve success (Lowa, 2012). As is stated in Module 1, airline demand forecast requires in-depth understanding of various factors including ccompetition, frequency of travel, pricing, capacity issues, and economic fluctuations, among others. In order to establish demand for a new airline, the following factors are important to understand,
- Potential market: the market is very important and largely dictates the demand for a product. It is important to answer questions such as, “who are my target market, are they adequate to keep the airline afloat, and what kind of airline services do they prefer?” Simply put, the market must be well-understood as a key determinant to the prospective airline demand.
- Substitutes: It would be so irresponsible not to consider other existent airline which offers services which can be considered a substitute to the services you offer. It is important to be aware that they are already in the market and it will be upon you to wrestle clients from them. Understanding the substitutes will help you in creating a unique line of approach. If the clients you target are same as their clients, then you have an obligation to assess how loyal these clients are to the substitute airlines.
- Pricing: This aspect is pegged to buyer’s purchasing power. If the airline is targeting middle income earners, it would not be prudent to charge high prices as this could leave you with no market at all (Steiner, 2009). It is important to establish the present airline pricing, compare it against your pricing and the services you offer. On this basis, it would be possible to know whether there will be demand for your airline at the prices you intend to charge. More often than not, poor pricing can be costly to the airline as well as number of clients willing to use the proposed airline.
- Taxes: Taxes often affect pricing and hence it is important to understand whether the existing taxation will offer reasonable margin for the airline to charge prices which still accommodate demand for the airline (Steiner, 2009).
- Client expectations: demand is largely pegged on the willingness of clients to pay for the services being offered. It is therefore extremely important that a clear understanding of what the clients expects and how such expectations will affect demand. More often than not, clients will want to use an airline which meets their needs and these needs are addressed sufficiently.
Nonetheless, if the market boundaries can be determined, it becomes possible to establish the number of potential buyers or even estimate the same as proposed in the figure above. It is important to emphasize that market demand represents the buyers within the market will be willing and are able to buy at other prices within the specified duration. It should be noted that the determinants of demand are same as individual demand with addition of potential buyers.
Problem description
For some time now, Qatar Airways staff reports they have been experience a considerable decline in the number of clients, a problem they seem to attribute to entry of competitors into Qatar Airways typical routes. A close spot check has revealed that competitors are charging lower processes, offering lots of discounts, and more comprehensive loyalty programs. Although it has not been proved that these are the causes for the decline in clients, they have been touted in a number of board meetings as the possible causes of the loss in clients.
Additionally, it has been noted that the new airlines into the traditional Qatar Airways offer higher on-board luggage limits, ad recently modernized their flights, sacrificed comfort for price, and have put in place extra security measures, other than those offered by the respective airports. These have been touted as the possible causes for the loss in clients.
While it is estimated that in the first quarter of last year, Qatar Airways experienced client increase of 10%, within the same period this year, a decline of 2.5% has been recorded creating an alarming situation amongst the management team. Ongoing trends reveal that in the second quarter, passenger volume might decline by up to 7%, if measures are not put in place to curb the decline. However, the management is in a quandary as to which particular areas need to be immediately addressed and which ones can be addressed on a long-term basis. Due to financial limitations, not all problems can be addressed immediately.
Additionally, the management requires proof that the loss of clients being experienced by Qatar Airways is not only an issue that can be addressed internally, but also is not a product of the recent harsh economic conditions. Conventionally, such conditions are accounted for a fall within acceptable limits and hence it is important for the management to see proof that the current losses and beyond acceptable limits. Such proof would warrant release of funds for remedial actions to be taken.
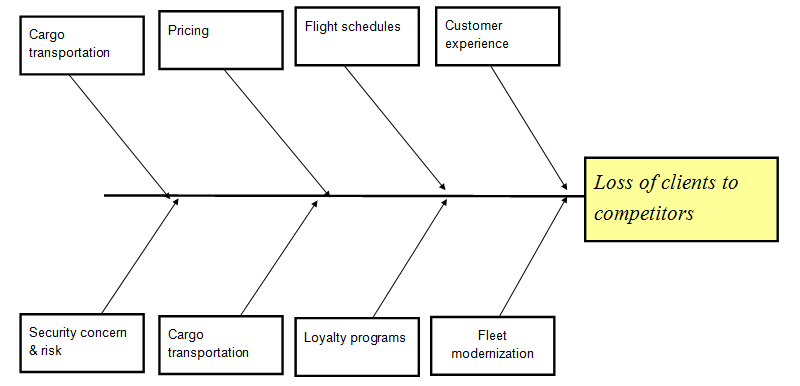
Three models are used to achieve this, that is, Pareto analysis for identifying the few problems that result into huge losses and hence warrant immediate action, control charts which seeks to establish if the losses being exhibited exceed acceptable limits, and envelop analysis, which sought to establish if the losses were limited to specific branches or if it was across the board. The problems facing Qatar Airways service business are further illustrated in the fishbone diagram below,
Model development
Pareto analysis
The Pareto analysis as applied in this project, presumes that 20% of the problems identified results into loss of 80% of the clients. As a matter of fact, the technique helps in narrowing down on the few issues that result into loss of a majority of the clients. As a result, it assists in identifying the areas which should be given optimal attention. As already mentioned, it is presumed that 20% of identified issues are the reason for 80% of the lost clients opting to use competitors’ services over Qatar Airways. This is based on Pareto principle that states that 80% of issues in end product/service are attributed to 20% of problems in production/service processes (Yin, 2003; Snee & Hoerl, 2005).
Control charts
Control charts are statistical tools which distinguish between process variations resulting from either common causes or special causes (Pande et al., 2000). It offers graphical display of the stability or instability of a process over time. Some variation result from normal causes while others result from causes not normally present in the process (Bruttin & Fraser, 2005). Such non-normal causes are referred to as special cause variations. Control charts assist in obtaining process stability. Consistency is attained by data streams which fall within the control limits which are normally based on ≠3 standard deviations from the centre-line referred to as ‘3 sigma’ (Carleysmith, Dufton & Altria, 2009: 97).
The control limits represent the variation limits for as long as the process is within a statistical control state. A process is said to be within statistical control if all its variations are a result of the commonly known causes and hence affect the entire production in similar manner (Johnson, 2006). In general control charts provide the following benefits to quality assessment in the company;
- Process variation monitoring over time.
- Differentiation of normal cause and special cause variations.
- Assessment of changes effectiveness in process improvement.
- Communication of process performance during a given time.
To monitor a service, random samples of the output from the service are taken and examined to check if the service process is in control. This is nothing but a hypothesis test with the hypotheses formulated as
- H0: The process is in control
- Ha: The process is out of control
Data envelop analysis
Data envelop analysis provides an opportunity to relate performance of various branches or operation locations where the airlines operate. While the airline operates in various locations, only a few selected locations are considered. Conventionally, a problem such as loss of clients to competitors is not a blanket occurrence but rather is limited to specific branches or locations. The efficiency of operations of various airports is considered on the assumption that the lower the efficiency, the higher the number of clients lost on the particular location and hence the location should be accorded special attention.
Model results
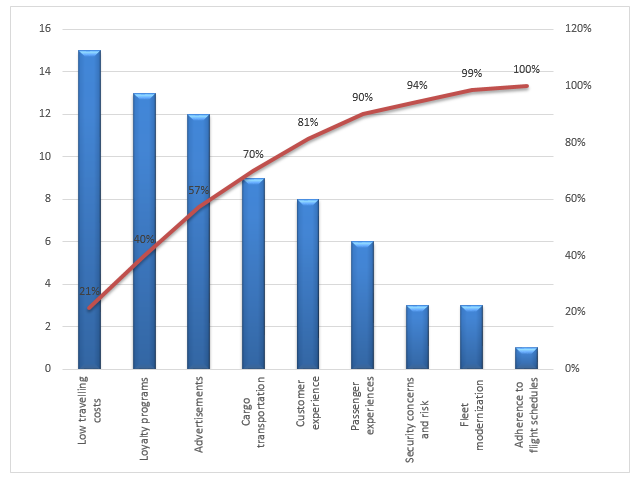
Three issues are identified as being of great importance to the airline as they contribute to 80% of the lost clients. These include low travel costs offered by other airlines, loyalty programs, and advertisements. In the recent past, competitors have engaged Qatar Airways in price wars. Most of the clients shifted allegiance to other airlines which offered lower prices and those that had loyalty programs which came with additional benefits. Additionally, advertisement seemed to play an important role in determination of the airlines people chose for their travels. The Pareto shows that while there are other causes of loss of clients to competitors, 80% + clients were lost mainly due to these three reasons. In terms of travelling costs, Qatar Airways seemed to be the biggest beneficiary due to its low cost airline services. The other airlines also seemed to have heavily invested in advertisements and enticing loyalty programs.
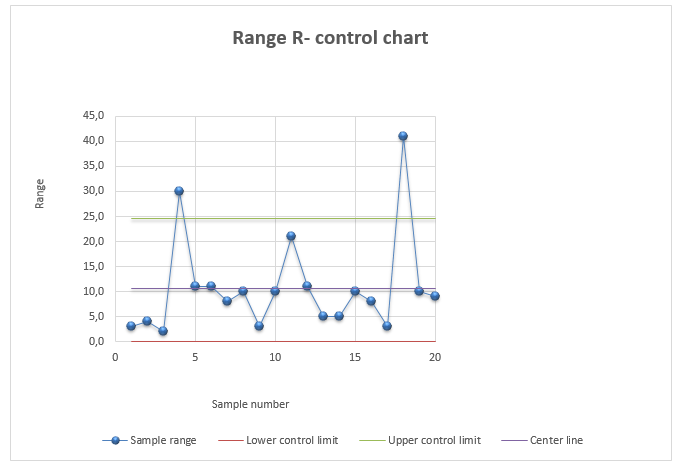
Some anomaly happens during the sampling 12 and 13 with the process of production because. Because of the 13 sample mean is near at the upper limit, and the standard deviation of the 12. Sample is above the upper control limit. It is reasonable to inspect the service delivery.
The efficiency frontier is included below,
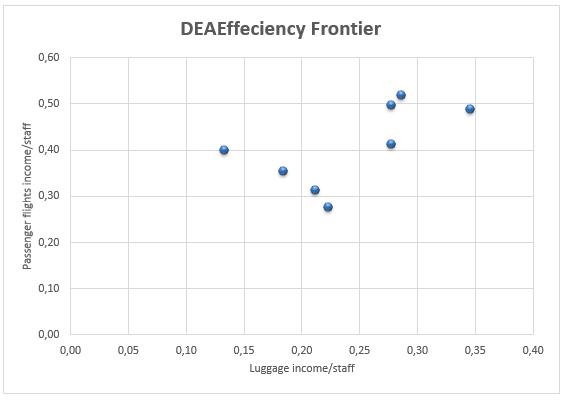
The results report findings with respect to various destinations of Qatar Airways flight. The most efficient branch in terms in income generation to staff ratio is Miami, USA; followed by Haneda Airport, Tokyo, Japan; and Hangzhou, China. UAE which is its major market comes at a distant fourth. This is alarming a clear indication that although Qatar contributed to a big portion of the revenues, competitors are slowly encroaching into the market and as such impeding its productivity. Emphasis should be placed on streamlining operations at its various points of destinations in order to attract more clients. However, while investing in high-end tourism is a good move, care should be taken to ensure such investment is controlled to match the realities on the ground. This is the only way through which quality service delivery can be guaranteed.
It is important that Qatar Airways over-reliance on leisure travellers as the prime source of income exposes the risks brought about by market shocks. As a matter of fact, the recent global recession and Eurozone crisis have revealed the importance of airline’s diversifying their services in order to survive changing economic times. The tough times resulted into a sharp decline in the leisure travellers market and hence interfering with Qatar Airways revenues.
The aviation market is a risky market and hence it is also important that Qatar Airways make hedging arrangements. Although it already hedging arrangements, Qatar Airways should endeavor to make other arrangements as it increases its global presence. Additionally, it is important that Qatar Airways form more partnerships and increase its marketing endeavors in order to reach out to more clients and further tap into the high yielding market segments.
It is important to note that most of the technology being currently used by the Corporation is out-dated and hence access and communications is difficult. The need for projects and platforms to replace these older databases is rife now more than ever. A future requirement is to develop Qatar Airways as an e-commerce business and the web will therefore become a key technology for the company in the future.
The rapid expansion has no doubt fused the businesses’ operations and as such there is a need to ensure that the IT system too is designed to reflect the same. The major problem no doubt underlies in the company’s sharing and communication of information aspect, with much impact being felt by the mobile sales force. The corporation currently makes use of an Ethernet LAN, in addition to broadband connections across all its countrywide offices. Qatar Airways have a web server and a company web site which is currently being redesigned. This is being done in-house.
It is all in the marketing and what Qatar Airways will offer over other airlines or any other such. Aspects such as increased luggage allowance, elusive of special checks and access to often restricted areas will most likely make the clients feel esteemed and as such choose to fly Qatar Airways. Qatar Airways in this case will have to present itself as an airline which values its clients and accords them high importance. How? Well, simply through quality service delivery and being responsive to the needs of the client. Taking into consideration that low-pricing is not an option, Qatar Airways has no choice but to offer its clients something valuable that its competitors are certainly not offering and further such an offer should not come expensive and dig into the airline’s funds.
Total Quality costs
Quality service delivery is core to objectives of Qatar Airways. Conventionally, consumers prefer services of high quality and at par or exceeding their expected value. In ensuring that clients receive value for their service purchases, Qatar Airways as largely invested in prevention as well as appraisal costs. As a matter of fact, the airline understands that it is important to minimize costs associated with client complains by ensuring there are no grounds for such complains. For instance, it is cheaper to train staff on how to handle clients that to deal with legal suits resulting from staff misconduct or even the costs associated with negative publicity.
Prevention costs
Prevention costs incurred by Qatar Airlines in order to minimize unsatisfactory and imperfect services include operations maintenance, staff/supplier training, and continuous service reviews. The main aim of investing in preventive measures to eliminate or in the least minimizes adverse impact on the airline’s service’s and operations.
Appraisal costs
Other than prevention costs, the airline also incurs appraisal costs in regular assessment of its quality. Such costs are meant to help the airline meet and possibly exceed client expectations. The costs incurred by Qatar Airways in appraisal include inspection costs, ISO certification costs, service testing costs, as well as costs incurred in seeking recognition for other airline quality service delivery awards.
Failure costs (Internal and external)
Failure costs also form part of the larger total costs incurred for purposes of achieving total quality in service delivery. Such costs are either classified as internal or external. External quality costs incurred by Qatar Airways include service warranty costs and customer ticket cancellations. On the other hand, internal failure costs include re-servicing airlines, and costs incurred as result of wastages.
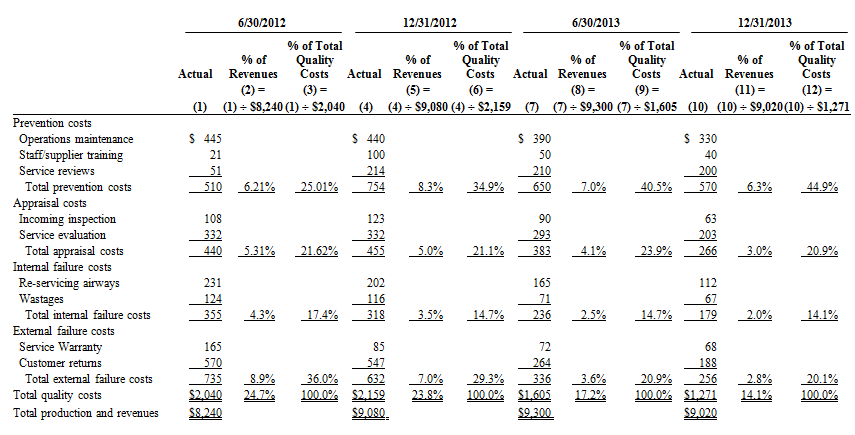
The total costs of quality as a % of revenues decreased from 24.71% to 14.10% over the 2 year period. On the other hand, external failure costs are the costs that signal client dissatisfaction. These costs have reduced from 8.90% to a marginal 2.80% as total revenues percentage and from 36.0% to 20.10% of all quality costs. The reductions in warranty service and ticket cancellations are likely to translate into an increase in revenues. Internal costs have also reduced by almost a half, from 4.30% to 2.0%. Similarly, appraisal costs have declined from 5.3% to 3.0%. It is believed that prevention of service issues from taking place is translating into reduced need for service evaluation. Appraisal costs have decreased from 5.3% to 3% of revenues. Preventing defects from occurring in the first place is reducing the demand for final testing.
The costs of quality have changed in prevention due to efforts to solve problems prior to service delivery. This is seen by the increase in total costs of prevention from 25.0% to 45% of the total costs incurred for quality purposes. The $60,000 increment in prevention costs is however offset by a substantial reduction in other costs of quality. Additionally, wastages have been minimized. Additionally, there is a sharp reduction in time spent on solving customer issues and hence a decline in related costs.
Conclusion
In a market previously characterized with prestige travellers, thanks to booming oil business, Qatar Airways find himself in an unfamiliar territory. Losing clients due to availability of low cost travelling can therefore be attributed to fare wars that have plagued the industry since deregulation. This has come to the delight of travelers but to the dismay of industry stakeholders. The truth is, airline industry is not the sole U.S. industry plagued with price wars.
The top presses have routinely featured stories on price wars in supermarkets, consumer electronics, as well as service industries; wars which break out when different firm attempt to dispossess others of their market share. However, the price wars in this industry is rather unique and of great interest.
Firstly, the wars are a part of the airline industry’s turbulence and continuous adjustment to deregulation, a reality that calls for policymakers’ attention at a time when all other top industries such as communications and electricity are faced with significant deregulation. Secondly, the industry’s technology and investment trends, unpredictable demand, as well as complex patterns of competition invite multiple competing theories about the reasons why airlines engage in fare wars, and further provide a rich laboratory for testing of the theories.
Lastly, industry executives, a number of whom are ready to believe that fare wars are a temporary measures rather than permanent occurrence, and policymakers, most of whom continuously scrutinize industry’s financial performance, fail to realize that this ultimately impacts on the airline’s profitability and have a rippling effect on other operations of the airline. This, as is revealed in the Pareto chart, is an important are the airline needs to look into.
Another area which is observed to make the Airline’s client vulnerable is the loyalty program. For instance, an article by Tierney (2013) reflected on changes made by Qatar Airways to its loyalty program. The article read in part, “Qatar Airways Listens to Its Customers and Makes Changes in Rapid Rewards Loyalty Program.” An important question then is, “has Qatar Airways listened to its clients in developing its loyalty program?” Answering this question could potentially open new doors to understanding how to solve the problem of such losses. Qatar Airways must not allow its competitor’s loyalty program to look more attractive than its own which is restricted to specific flight numbers.
Advertisement is also another area where the Airline should most definitely focus on. Brands like Coca Cola, Pepsi and BAT have largely thrived on advertisements through they keep brand imposed in the minds of many (Steiner, 2009). This is definitely required of Qatar Airways. The airline must use advertisements to continuously remind clients of the services offered the Airline.
In general, over the recent past, the airline industry has undergone extensive changes. Since the mid-90s, new airlines have emerged, some low cost while others expensive and luxurious (Lowa, 2012). Some have been able to stay afloat while others have gone under a short while after being commissioned. In essence, the mixed fortunes are indicative of the delicate airline industry market and hence it is important that any proposed new airline gains an understanding of the market prior to entry if it is to achieve success
The airline’s pricing is vital to its growth. It is rated as one of the high cost airlines in Europe. The airline should provide convenient, low cost flights to clients of all origins. This has enabled it to maintain a strong client base even in the worst of times when other airlines faced tremendous passenger decline. The South West airline’s website describes the airline as having the lowest cost structures in the domestic airline industry through consistent provision of low and simple fares (Qatar Airways, 2011). Basically, this approach can facilitate increased sales.
References
Antony, J 2003, Lean Sigma, Manufacturing Engineer, vol. 56, no. 12, p. 40-42.
Bruttin, F. & Fraser, H 2005, ‘The metamorphosis of manufacturing: From art to Science’, An IBM Institute for Business Value executive brief, vol. 14, no. 5, p.1-35.
Carleysmith, S. W., Dufton, A. M. & Altria, K. D 2009, ‘Implementing Lean Sigma in pharmaceutical research and development: a review by practitioners’, R & D Management, pp. 95-106.
Johnson, A 2006, ‘Lessons learned from six sigma in R &D’, Managers at work, vol. 24, no. 3, pp. 15-19.
Lowa, S 2012, ‘Supply and demand metrics for airline industry’, Journal of Supply and Demand, vol. 32, no. 4, pp. 45-52.
Magnusson, K. Krsolid, D. & Bergman, B 2003, Six Sigma: The Pragmatic Approach, Studentlitteratur, Lund.
Montgomery, D. C 2005, Design and Analysis of Experiment, New York, John Wiley and Sons.
Pande, P. S 2000, The Six Sigma Way- How GE, Motorola and other top companies are honing their performance, London, McGraw-Hill.
Snee, R. D. & Hoerl, R. W 2005, The Six Sigma-Beyond the factory floor: Deployment Strategies for Financial Service, Health Car and the Rest of the Real Economy, London, Person Prentice Hall.
Steiner, P. O 2009, Markets and Industries, New York, Crowell Collier and MacMillan Inc.
Tierney, J 2013, Qatar Airways Listens to Its Customers and Makes Changes in Rapid Rewards Loyalty Program, Daily News.
Yin, R. K 2003, Case Study Research: Designs and methods, London, Sage Publications Inc.