Abstract
Albert Bandura’s social cognitive theory presents an analysis human self – development, adaptation and change from a human action perspective and presents the notion that individuals have an ability to exercise some measure of control over their thought processes, motivations, affects and actions through the workings of their personal agency. Self – efficacy, which can be translated somewhat loosely into a layman’s language as being confidence has an influence on the ability of individuals to achieve even prior to the time when individuals commence their struggle to achieve a desirable goal. This laboratory report presents an examination of Bandura’s views on self – efficacy through the analysis of a data set related to the levels of self – efficacy and performance discrepancy amongst 131 students who are studying statistics at the college level. Results indicate that the analysis of the data set broadly supports Albert Bandura’s theories on self – efficacy.
Declaration
I hereby certify that, except where cited in the text, this laboratory report is the result of the research carried out by the author of this report. The main content of the laboratory report which has been presented contains original data that was collected by the author.
_____________________________________________
(Name and Signature of Author)
This laboratory report is submitted in fulfilment for the requirements related to practical data collection and analysis associated with self efficacy amongst students studying statistics.
Introduction
According to Albert Bandura, the pioneering psychologist who researched the topic, self – efficacy can be defined as “the belief in one’s capabilities to organize and execute the courses of action required to manage prospective situations (McKeena, 2007, Part 2). The concept of self – efficacy is an important component of Albert Bandura’s social cognitive theory (Wikipedia, 2007, “Social Cognitive Theory”). It has been asserted by Bandura that the personal beliefs which an individual has about self – efficacy for some task or goal influences their action, effort, perseverance, resiliency to adversity and the realisation of goals that are associated with the efforts that they put into the accomplishing a task or achieving a goal. This means that the beliefs that an individual has about their capability have an impact on any outcomes before any action for the achievement of a goal or the performance of a task has occurred.
Although Bandura accepts that the influences of the environment, interpersonal factors and behaviours do influence the manner in which a human functions, an increase in perceived self – efficacy can influence the likelihood of success in the accomplishment of a task or the achievement of a goal. Some of the factors that do influence the sense of self – efficacy which an individual has about their ability in something is often influenced by performance accomplishments, verbal persuasion, emotional arousal and experiences that an individual develops as a result of sharing with others. This means that encouragement, learning from others and positive experiences associated with efforts that have been directed towards the achievement of a goal or in the accomplishment of a task are likely to enhance the self – efficacy of an individual and will probably lead to a higher probability of success. Self – efficacy and differences in gender have been a subject of research and in general it has been discovered that male men and adolescents tend to be more confident then girls and women when it comes to having confidence in their ability to achieve success in a complicated and difficult undertaking (Schunk, 2000, Pp. 10).
Studying mathematics or statistics has been considered as being an academically challenging task and in view of this, the academic achievement of students in mathematics or statistics courses should be able to be used to examine the validity of Bandura’s views about the notion of self – efficacy. Many researchers have previously attempted to examine the validity of Bandura’s views related to self – efficacy through an examination of student performance in academically challenging tasks, such as dissertation writing (Lane, 2003, Pp. 1 – 8).
This laboratory report presents the results of an analysis of student performance and self – efficacy data for 131 students who were studying statistics at the college level. The sample was not balanced across gender lines and a total of 20 male students were included, against a total of 111 female students. Statistics related to age, sex, self – efficacy measure for likely success in the statistics course at the commencement of a semester and at its end as well as the difference between actual and expected grade in statistics for a semester and the self – efficacy related to success in statistics at the commencement of the next semester were recorded and the results were statistically analysed to see if they fitted in with the notion of self – efficacy presented by Bandura.
Methodology
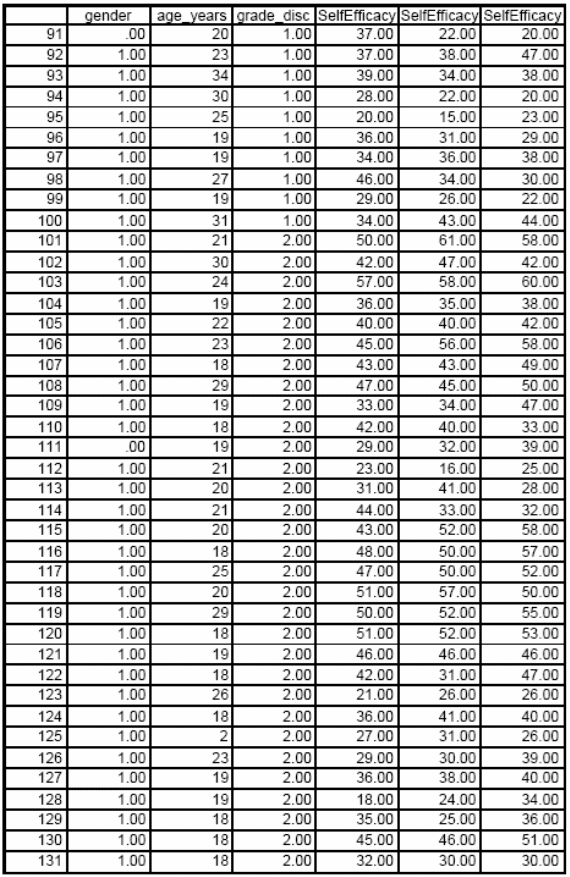
Raw data which was collected for the 131 students has been presented in Appendix A, after coding into SPSS worksheet. The task of this laboratory study is to determine if the statistical analysis of the data which has been collected will support Albert Bandura’s views about self – efficacy.
It is possible to carry out statistical analysis for the data which has been collected by using a number of statistical techniques in order to make sense of the data which has been gathered. Descriptive statistics can be used to enhance an understanding of the nature of self – efficacy and performance results that have been presented by respondents and to determine characteristics associated with age and gender for the sample that is under consideration. Correlations between statistical variables are likely to deliver useful insights into thinking about what influences self – efficacy has on actual academic performance and how encouragement or setback arising out of examination performance can have an impact on self – efficacy ate the beginning of the second term.
Pearson’s Correlation Coefficient is the most often used statistical parameter that is used for determining correlations between statistical variables. When performing correlation analysis between statistical variables, the following sets of ranges for the Pearson’s Correlation Coefficient indicate weak to strong relationships between variables (Bryman, 2005, Chapter 8):
– r = 0.01 to 0.20 indicates weak relationship
– r = 0.21 to 0.50 indicates moderate relationship
– r= 0.51 to 0.80 indicates a strong relationship
– r= 0.81 to 1 indicates a very strong relationship

It is possible to check for the level of correlations between various statistical variables of interest and the researcher can choose what investigations they may want to carry in regard to the level of correlation between various statistical variables from the survey instrument.
Partial correlation using the Pearson r coefficient is also possible with SPSS. This statistical technique is often used in social sciences and the technique makes it possible for researchers to determine the correlation between two variables while holding one or more variables constant (Bryman, 2005, Pp. 295 – 300). Using the Pearson coefficient analysis, it should be possible to investigate the correlation between self – efficacy at the beginning of a term and the discrepancy between in results, or the relationship between discrepancy in examination results and the self- efficacy at the end of a term. It should also be possible to explore the relationship between discrepancy in examination results, self – efficacy at the end of a term and self – efficacy at the beginning of the next term. Thus, it should be possible to test if the views about self – efficacy that have been presented by Albert Bandura are reflected in the measurements for self – efficacy and examination results which were collected for the sample.
K – Means cluster analysis can be used to examine those statistical variables that are capable of being grouped, or classified, into clusters of somewhat distinct, but relatively homogeneous data sets (Norušis, 2006, Chapter 16). The researcher can then select the statistical variables that should be investigated using cluster analysis and what clustering phenomenon needs to be investigated. As an example, it may be possible to see if respondents with the same level of self – efficacy performed according to their expectations in the term examinations. It may also be possible to explore several other perspectives by using cluster analysis and other statistical techniques such as the comparison of means of distributions using the t – tests. However, it should be adequate to rely on descriptive statistics, Pearson’s Correlation Coefficient analysis and K – Means cluster analysis to say something sensible about the data that has been collected and the agreement of observation with Bandura’s views on self – efficacy.
If Albert Bandura’s notions about self – efficacy are observable in the data that was collected for the sample, then the relationships between self – efficacy at the beginning of a term should indicate a negative correlation with discrepancy in examination results, because those who have high self – efficacy should have performed well in the examinations according to expectations and will have a low level of discrepancy in examinations. Also, discrepancy in examination results will have made an impact on self – efficacy at the end of a term and self – efficacy as well as discrepancy in examination results will have a correlation with self – efficacy at the beginning on the next term. Unfortunately, because the sample is heavily biased in favour of female students, it will not be possible to try and examine relationships between self – efficacy and gender.
Data analysis for the sample has been presented and discussed in the next section.
Data Analysis
Frequency analysis of the data set which has been presented in table 1 indicates that only 20 of the 131, or 15.3 % students, were males and 111 students were females. Because of the fact that a disproportionately large number of students were females, it is not possible to use the data set that is available for the examination of relationships between self – efficacy and gender.

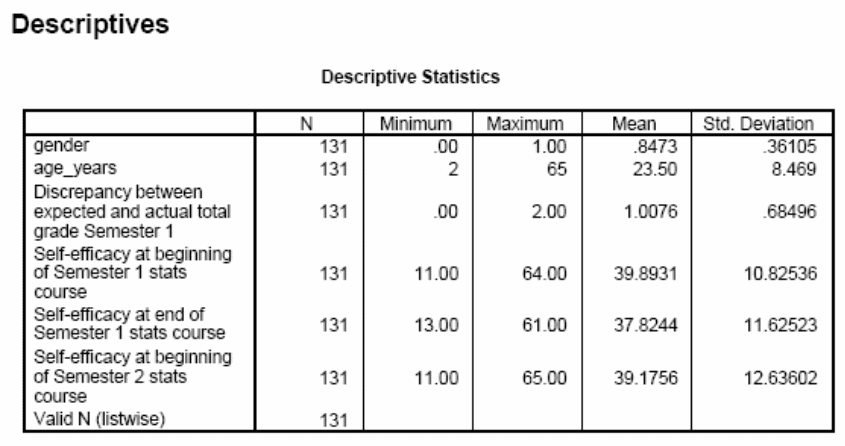
Descriptive analysis of the data set which has been presented in table 2, which has been presented below, indicates that the average age of the sample was 23.5 years, with the maximum age being 65 years. The average self – efficacy at the beginning of term 1 was 39.89 and on the average students had a 50 % discrepancy in expected and actual examination results, considering that the maximum discrepancy in examination results was scored as 2. The average level of self – efficacy at the beginning of term 2 declined somewhat to 39.17, as students were, on the average, slightly disheartened.
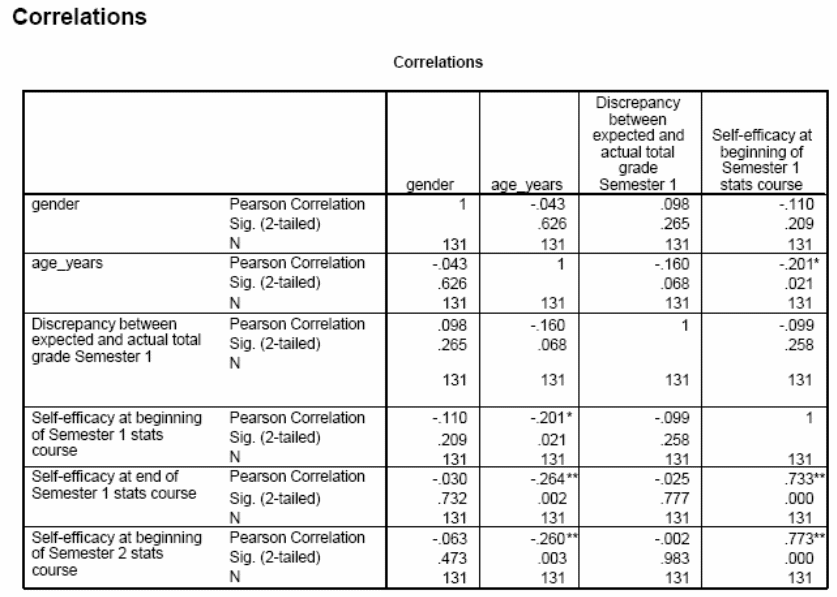
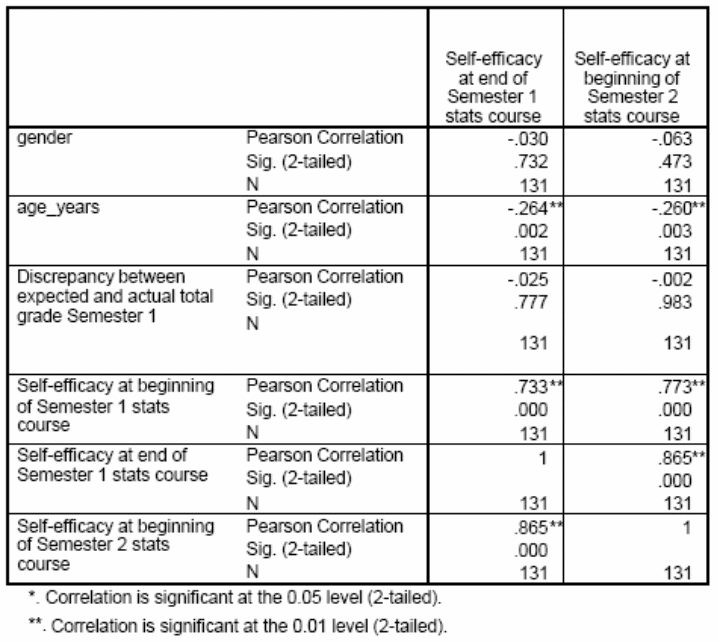
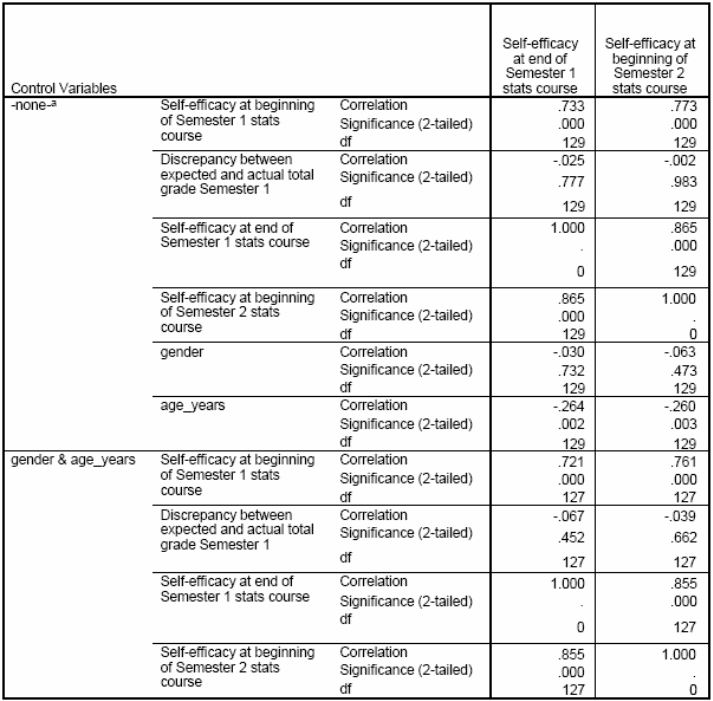
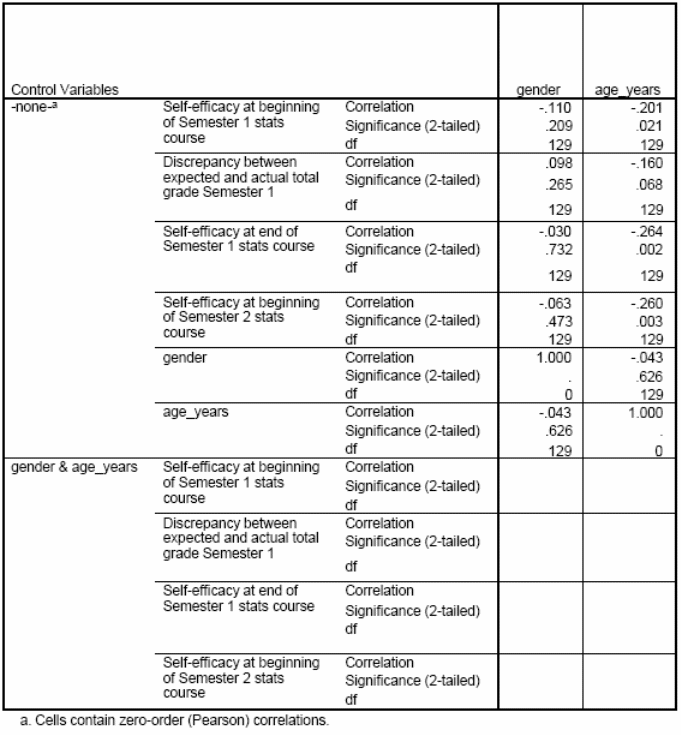
A correlation matrix which indicated the Pearson’s Correlation Coefficients (not the Pearson’s r Partial Coefficients) was prepared in order to investigate the correlations between various statistical variables in the data set and this is presented in table 3 which has been presented below. From the correlation matrix, it can be seen that self – efficacy at the beginning of term 1 is negatively correlated with age and gender and this indicates that females were less confident and younger students indicated higher levels of confidence.
Self – efficacy at the beginning of term 1 was slightly negatively correlated with discrepancy in examination results and this indicated that those who were confident of success had a tendency to perform in accordance with their expectations in examinations. Self – efficacy at the end of term 1 was very strongly correlated with self – efficacy at the beginning of term 1 and very slightly negatively correlated with discrepancy in examination results. This indicated that a tendency for self – efficacy continued over time, but was very slightly modified as a consequence of performance results in examinations. Thus, those with self – confidence continued with this confidence, but performance results had a slight influence on self – efficacy.
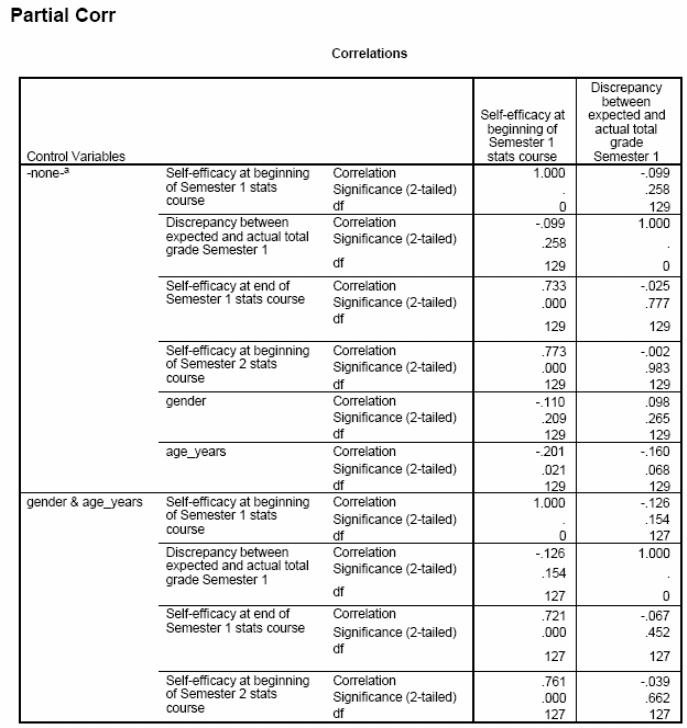
A Pearson r partial correlation matrix was prepared with age and gender being controlled variables, whose effect was desired to be nullified and this matrix is presented in table 4 which has been presented below.
From this table it can be seen that a tendency to have self – efficacy at the beginning of term 1 was likely to result in students performing according to their expectations and a negative correlation existed between self – efficacy and discrepancy between actual and expected grade. Those who had levels of self – efficacy tended to maintain them throughout and the discrepancy in expected and actual examination results only had a sleight influence on the levels of self – efficacy. A low level of discrepancy in actual and expected examination performance had a tendency for maintaining or slightly encouraging the levels of self – efficacy.
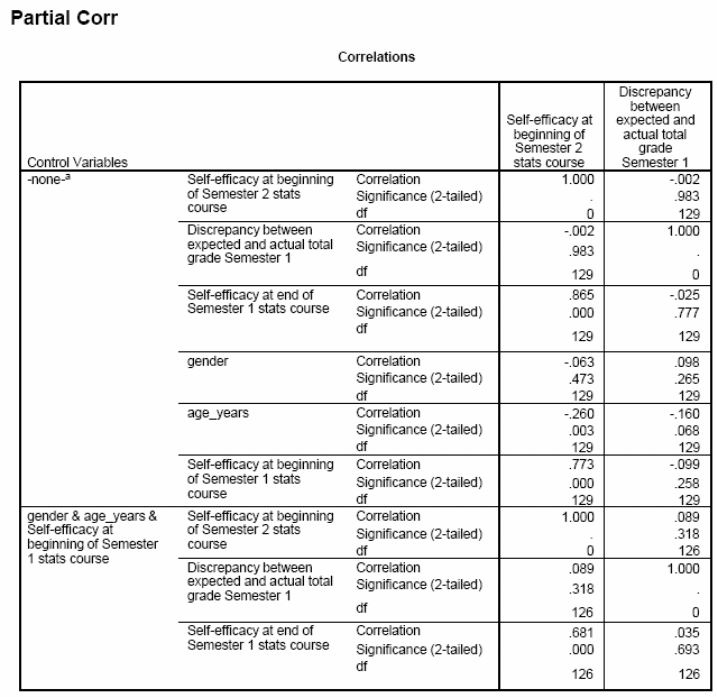
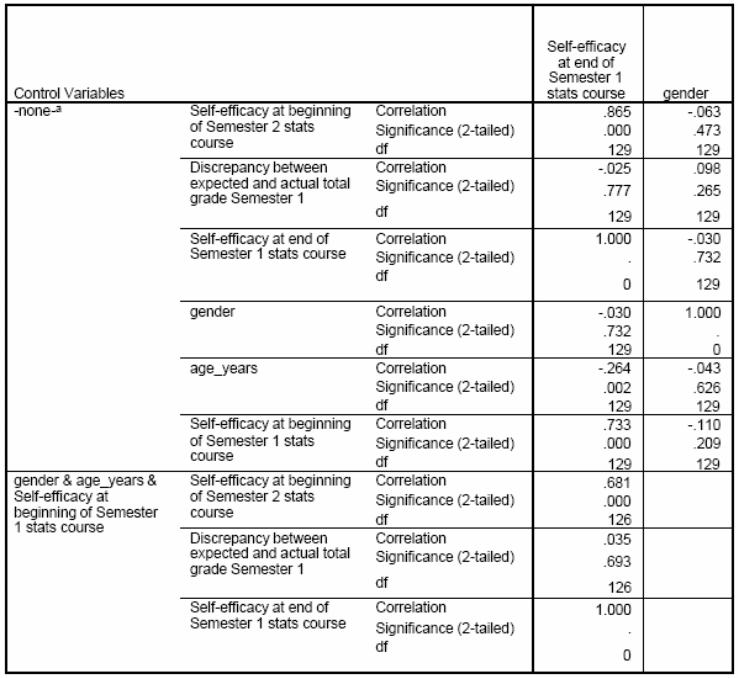
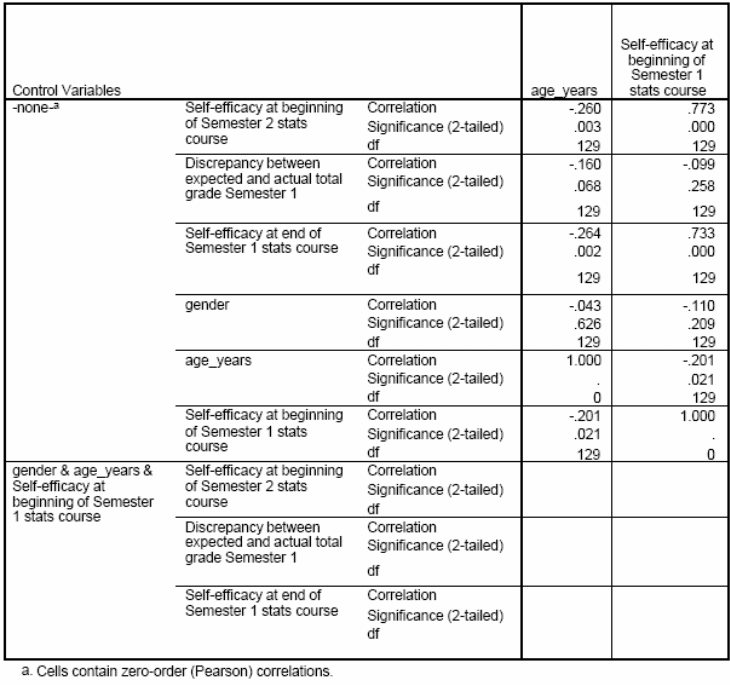
A Pearson r partial correlation matrix was also prepared with age, gender and self – efficacy at the beginning of term 1 as controlled variables, which had the effect of eliminating the effects of these variables. This Pearson r Correlation matrix is presented in table 5, which has been presented below.
From this matrix it can be seen that self – efficacy at the beginning of term 2 is slightly POSITIVELY correlated with discrepancy in expected and actual examination performance results and this indicates that students with high levels of self – efficacy had a tendency to recover from lower then expected examination performance and were looking forward to attacking term 2 with renewed vigour. Self – efficacy at the end of term 1 was well correlated with self – efficacy at the beginning of term 2 and this implied that those who had confidence of success in statistics continued with this tendency.
K – Mean cluster analysis was used in an attempt to classify students according to their levels of self – efficacy at the beginning of term 1. A total of four clusters were utilised in the hope that the discrimination that will be provided for classification will be adequate in four clusters. The results are presented in table 6 which has been presented below.
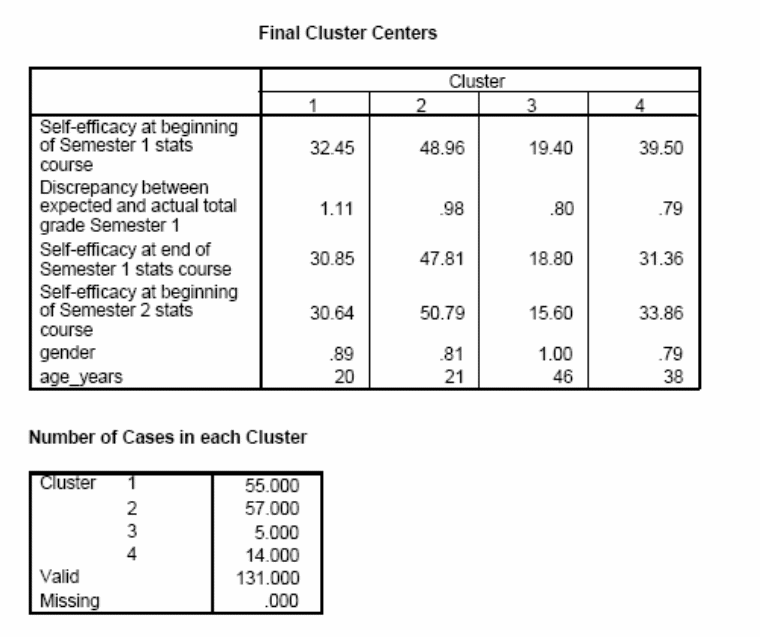
An examination of the clusters indicates that cluster 2, with the highest number of students in a cluster numbered 57 and these students had on the average the highest level of self – efficacy of all cluster groups. Students in cluster 2 had somewhat lower then average discrepancy in actual and expected examination performance and they performed according to expectation. Their level of self – efficacy was slightly reduced as a result of examination performance at the end of term 1, but they had the highest levels of self – efficacy at the beginning of term 2 and forged ahead with attacking statistics with renewed vigour.
Students in cluster 1, consisting of 55 students had modest levels of self – efficacy at the beginning of term 1 and they had somewhat higher then average levels of discrepancy in expected and actual examination performance. These students were somewhat younger then the others. However, as a result of higher then average levels of examination discrepancy, they felt slightly frustrated and had decreased self – efficacy at the beginning of term 2.
Students in cluster 3 were the oldies who wanted to learn statistics, but had left the matter rather late in their lives. They were willing to try, but lacked self – efficacy, performing according to their expectations and lost even more confidence at the beginning of term 2. Cluster 4 students were similar to cluster 3 students, except for the fact that they were somewhat younger and had higher levels of self – efficacy.
Discussion
The results for the data analysis which have been presented in the previous section broadly support Albert Bandura’ s theories about self – efficacy being a character trait which continues despite slight knocks from reality. Those who had high levels of self – efficacy continued and performed somewhat in accordance with their expectations in examinations and their level of self – efficacy was either enhanced, if the performed in accordance to their expectations, or this was somewhat reduced if they had relatively high levels of discrepancy in their actual and expected performance.
Those who did not have high levels of self – efficacy performed poorly according to their expectations and this further reduced their self – efficacy as they received the hard knocks from performing poorly in examinations.
Thus, it pays to have positive feelings and expectations and to hurl oneself at a task with vigour. This is likely to get a difficult task done and to help with the achievement of goals.
Conclusion
From the results of the previous discussion it can be concluded that the data set that was considered broadly supported Albert Bandura’s theories about self – efficacy.
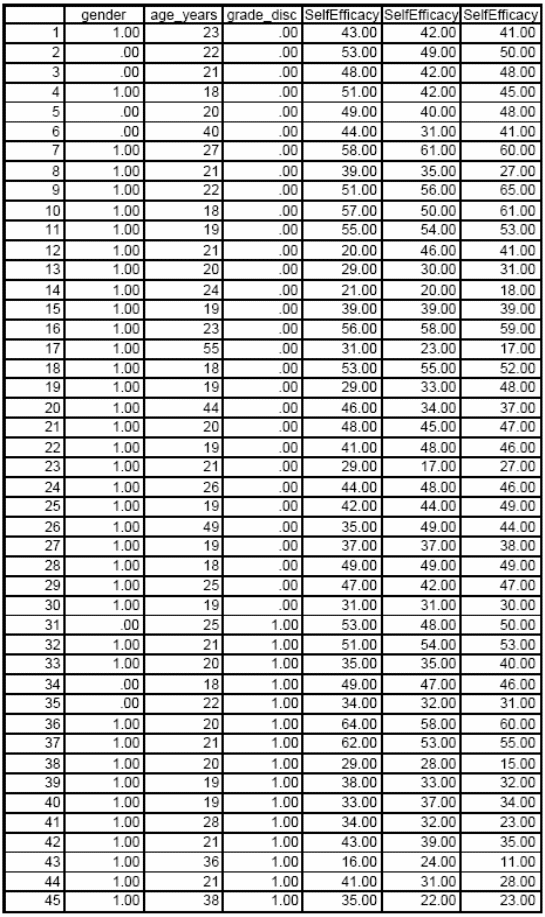
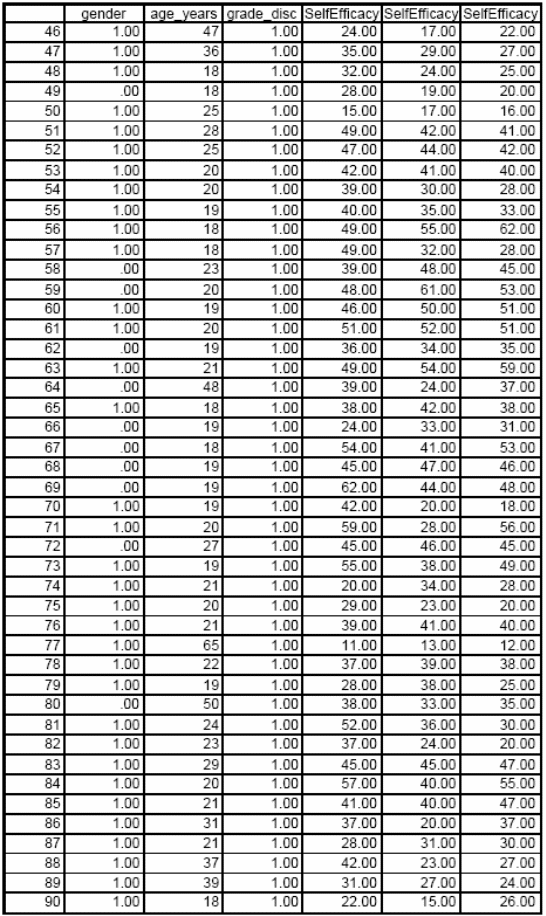
Appendix A – Raw Data for Self Efficacy in Students Studying Statistics
Raw data which was collected from 131 students who were studying statistics at college is presented below. The students presented their gender, age, discrepancy between the actual and expected grade at the end of semester examination for statistics, self – efficacy at the beginning of a semester, self – efficacy at the end of the semester and self – efficacy at the commencement of the next semester. Responses have been converted to numeric values for coding into the Statistical Package for Social Sciences (SPSS) software. Thus, a gender value of ‘0’ refers to a male student and a gender value of ‘1’ refers to a female student. Self – efficacy was measured through a survey instrument and the responses have been converted into numeric values on a scale and the higher the numeric value of self – efficacy that is indicated, the more confidant a student feels about their performance in statistics. Raw data was processed and the results are presented in the analysis section of the main report.
Bibliography / References
- Bandura, Albert. (1997). Self-Efficacy: The Exercise of Control. Worth Publishers, Incorporated.
- Bryman, Alan and Cramer, Duncan. (2005). Quantitative Data Analysis with SPSS 12 and 13: A Guide for Social Scientists. Routledge.
- Lane, Andrew M et al. (2003). Self-efficacy and Dissertation Performance among Sport Students. Journal of Hospitality, Research and Tourism Education, Vol. 2, No. 2, 2003.
- McKenna, Eugene. (2007). Business Psychology and Organisational Behaviour: A Student’s Handbook. Psychology Press.
- Norušis, Marija. (2006). SPSS 15.0 Statistical Procedures Companion: Chapter 16 – Cluster Analysis. Prentice Hall. Web.
- Schunk, Dale H and Pajares, Frank. (2000). The Development of Academic Self-Efficacy. Purdue University.
- Wikipedia. (2007). Self-efficacy. Wikipedia. Web.