Simple Harmonic Motion (SHM) describes motions that repeat themselves at regular intervals. SHM satisfies various conditions, such as being periodic about a point of equilibrium. Also, the restoring force has to be proportional to the displacement from that equilibrium position (Pratidhina et al., 2020). For example, a loaded vibrating spring experiences simple harmonic motion. According to Pratidhina et al. (2020), the displacement of such a system undergoing simple harmonic motion can be expressed as a function of time, as given by the following equation.
Where;
 is displacement
 is the maximum displacement and gives the amplitude of the motion
 is its phase angle, also called phase constant
 is the time interval
 is the motion’s angular velocity and is given as:
Where;
 is the motion’s frequency and describes the number of cycles completed per second
 is the Spring Constant
 is the mass of the vibrating body
The time taken to complete a vibration cycle is referred to as period and can be calculated as:
In addition, the velocity, V, at a given time is given as:
The maximum velocity of the motion, ![]() can be calculated as:
can be calculated as:
The acceleration, ![]() , and the maximum acceleration,
, and the maximum acceleration, ![]() of the motion are expressed as:
of the motion are expressed as:
The paper presents the results and analysis of a simple harmonic motion experienced with a mass-spring system. The lab experiment was aimed at determining the spring constant using SHM.
Procedure
During the experiment, tools and equipment, including a ruler, stopwatch, masses, spring, mass hanger, and a tripod stand, were used. Before the test, the spring and the mass hanger were attached to the tripod stand. The ruler was positioned in a manner to zero the system with the mass hanger attached. Slotted masses were added increasingly to the mass hanger, and the system was left to oscillate vertically in SHM. A stopwatch was used to determine the time taken to complete 20 oscillations. Two trials were conducted for a given mass and the results tabulated as shown below.
Data Observations and Results
The time taken to complete 20 oscillations was tabulated as follows.
Data Analysis and Calculations
From the relationship,
It follows that,
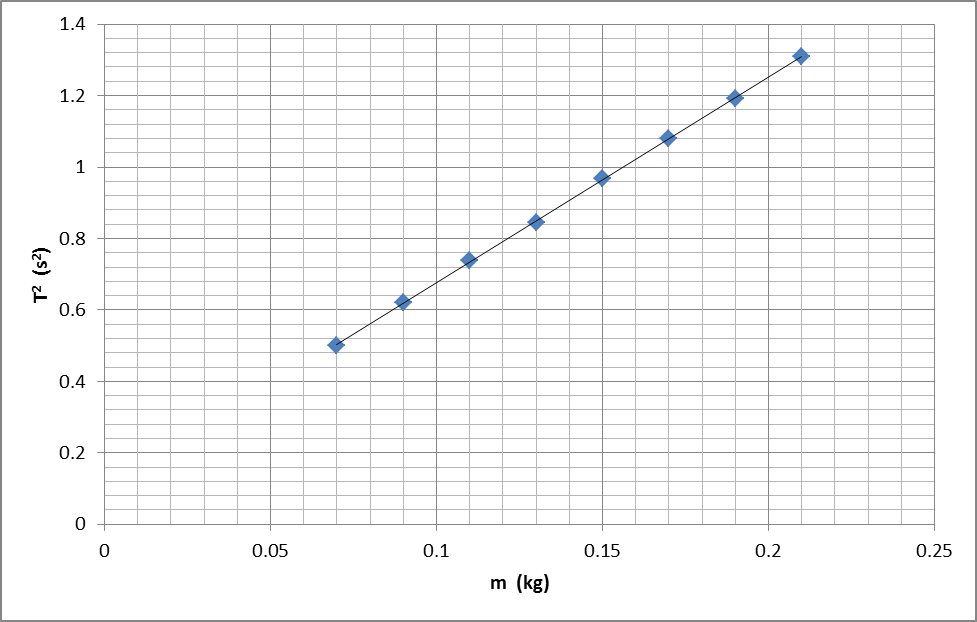
The value ![]() gives the gradient of the straight line resulting from this equation and can be used to determine k, the spring constant. The relationship between time T2 and mass m from the recorded data can be presented graphically, as shown below.
gives the gradient of the straight line resulting from this equation and can be used to determine k, the spring constant. The relationship between time T2 and mass m from the recorded data can be presented graphically, as shown below.

The resulting graph is given by an equation of the form
The slope of this graph is 5.7618, which is equivalent to ![]() . Therefore, the spring constant, k, can be calculated as follows.
. Therefore, the spring constant, k, can be calculated as follows.
Challenges Experienced During the Lab Test
Getting an accurate measurement for the time taken after 20 oscillations using a stopwatch was the main challenge. Each trial gave a different measurement, and this can be attributed to the differences in the reaction time when hitting the start and stop button of the stopwatch. Increasing the number of trials can minimize errors resulting from such difficulties. For instance, increasing the number of trials from two to four and getting the average can significantly reduce these errors.
Conclusion
Therefore, the constant of the spring used in this experiment is ![]() . The self-weight of the spring may have affected the results of this test as it contributes to the overall load acting on the spring. The measurements were taken twice for every 20 oscillations rather than once and one cycle to reduce random errors and increase the accuracy of measuring T. The average of the two readings was adopted as the value of T, for a given mass.
. The self-weight of the spring may have affected the results of this test as it contributes to the overall load acting on the spring. The measurements were taken twice for every 20 oscillations rather than once and one cycle to reduce random errors and increase the accuracy of measuring T. The average of the two readings was adopted as the value of T, for a given mass.
Reference
Pratidhina, E., Yuliani, F., & Dwandaru, W. (2020). Relating simple harmonic motion and uniform circular motion with tracker. Revista Mexicana De Física E, 17(2), 141-145. Web.