Introduction to Statistics
This chapter seeks to provide a clear understanding of concepts such as statistical thinking, critical thinking, types of data, and collection of sample data in a bid to gain more statistical literacy.
The journal starts by providing the definitions of some commonly used terms in statistics as follows.
Data refer to collections of facts and observations, such as measurements, genders, or survey responses from statistical inquiries.
Statistics refer to an organized set of scientific concepts and processes that are used to obtain, organize, analyze, present, and interpret data in an attempt to make informed decisions that influence human lives.
A Population is a collection of all measurements or data that are being considered.
Census refers to collection of information about every unit in a population by the means of a complete count approach. It provides a true measure of the population.
Sample refers to representation of the entire population.
Statistical thinking is a philosophical tool that is used in the process of data analysis. It involves the creation of a relationship between processes and statistics. Critical thinking is a process that is used in statistical thinking to enable the researcher to derive sense out of the results of a study. The process that is involved in conducting a statistical study consists of several steps that include preparation, analysis, and drawing of conclusions.
Various types of data such as sample statistic and population parameters are used in statistics to make inferences and/or conclusions about a population from which the data were obtained. A population parameter is a statistical quantity that describes the features of a given population whereas a sample statistic refers to a statistical measure that represents a limited size of the population.
Collection of Sample Data is a critical process in statistical methods that requires consideration of appropriate methods of obtaining sample data. A simple random sample refers to a small representation of the entire population that offers a fair means of selection to each population unit. The basics of collecting sample data significantly drive the statistical methods. Largely, collection of sample data is done through observational studies and experiments.
Example 1
45-percent of 200 employees at a certain motor vehicle factory earn less than 25,000 USD annually.
Relevance: This example presents a population parameter since it deals with a small group of people.
Summarizing and Graphing
This chapter mainly focuses on the distribution of data by the use of summarizing and graphing methods such as frequency distributions, histograms, graphs that enlighten, and graphs that deceive.
Frequency Distribution is a summarizing and graphing technique that represents the outcomes that are obtained from a sample study.
A histogram is usually a graph of a frequency distribution that is used in statistical summarizing and graphing because it is simpler to interpret than a distribution table.
Graphs that Enlighten
- Scatterplots
- Time-Series Graph
- Dot plots
Graphs that Deceive
- Pictographs
- Nonzero axis graphs
Example 2
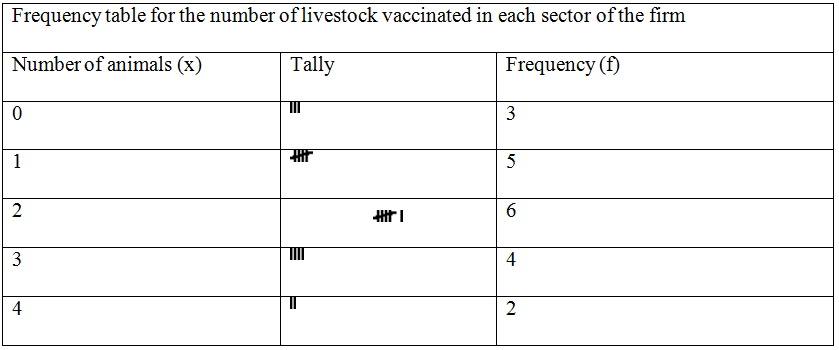
In a study conducted at an anonymous livestock firm, in each of the firm’s 20 sections, representatives were asked to reveal how many animals were vaccinated against a certain disease outbreak. The results that were obtained are as presented below:
3, 2, 1, 0, 1, 4, 0, 1, 1, 1, 2, 2, 3, 2, 3, 2, 0, 4, 0, 1
Steps:
- Divide the results (x) into intervals, and then count the number of results in each interval.
- Create a table and divide it into columns three columns. Tag these columns number of animals, tally, and frequency.
- Enter corresponding tally values of the number of animals as provided in the data above.
- Obtain a summation of the tally values for each animal category and enter them in the corresponding Frequency column entries.
