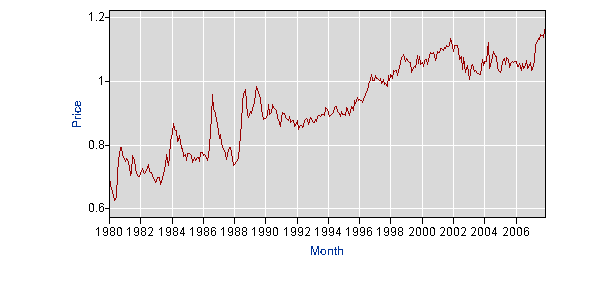
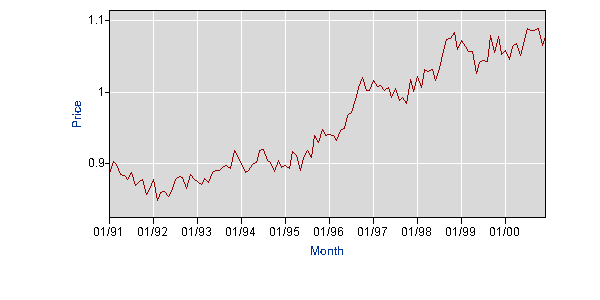
The graph shows the Whole-chicken prices from 1980 to 2007.
One can divide the period from 1980 to 2007 into three periods. 1980 to 1990, 1991 to 2000, and then 2001 to 2007.
The period 1980-1990
Summary of Price trends:
- Valley in mid-1980. 0.628 in may 1980.
- Shot up in late 1980. Touched highest in period from 80 to 83. 0.792 in Oct 1980.
- Dropped low in end of 1982 and stayed low until start of 83.
- Price shoot in 84, higher than ever. 0.867 in Feb 1984.
- Stable period from mid 84 to mid 86.
- Shoot high in mid 86. 0.958 In Aug 86.
- Consistent drop from mid 86 to May-Jun 87. Dropped as low as 0.75 at the end of 87.
- Consistent rise in 88 right from start. Highest ever at.975 in Sep 88.
- Remained high in 89. Went farther than the highest of 88.
The decade of 1980s brought many changes and turmoil in political and military arenas on the national and international front. 1980 was the last year of Jimmy Carter’s presidency. Carter’s era was marked by the Iranian revolution, Vietnam War and the cold war with Russia. Carter lost the 1980 presidential election to Ronald Reagan. Reagan introduced drastic economic changes, as he went for supply-side economic policies. Reagan had promised an economic revival by cutting taxes and reducing government expenditure. But the 1981 and 1982 saw the worst recession in US history after the great depression. This recession caused millions to go jobless and also high inflation. This greatly reflects the downward trend in chicken price, owing to low demand. The economy recovered partly in 1983, and unemployment reduced. This marks the higher demand (and hence higher price) of a whole chicken in 1983. But the recovery policies also pushed the inflation high. The price touches 0.867 in Feb 1984.
The government economic policies pushed the deficit high, causing fewer exports and high inflation. This marks the rising trend in 1986. Fast-food chains and other superstores mushroomed the market and the demand for broiler food products rocketed. 1987-88 again saw a great recession in the US. A sharp decline in prices in 1987 owes to economic recession, unemployment and oil deregulation(less supply). Late 1988 recovered from recession, with events on the political front as the official ending of the Cold war (Russian withdrawal from Afghanistan) and relief in military expenditure.
The decade of the 1980s was also marked by the Gulf War, which involved two of the largest oil-producing countries. As oil prices went high, the local food industry in the US also reflected this change in high inflation. The 1987 recession and Gulf war both contributed. This trend is evident in the late 1980s.
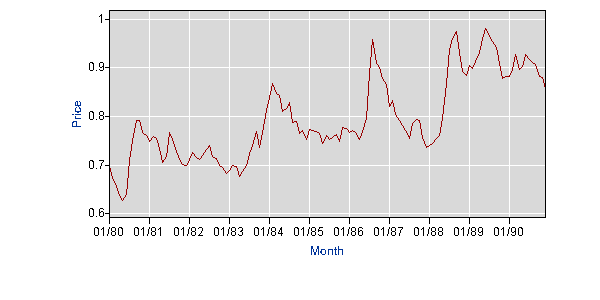
The Period 1991 to 2000
Summary of Price trends:
- A stable price period from late 89 to late 95. Although the price remained high, between.875 to.93 it remained stable.
- Went high and beyond 1 in Sep 96. Remains between 1 and 1.1 up to 2000.
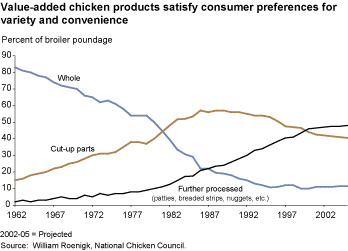
The 1990s are said to be the golden years of the US economy. The fall of the Soviet Union, the fall of the Berlin Wall, the emergence of the US as the sole military superpower and Internet boom all helped generate the booming local industry. Prices remain stable owing to the Clinton government’s local industry-focused policies. Some downward trend is also explainable owing to the increasing demand for convenience food products. The late 1970s brought the concept of broiler foods. The demand for whole chicken suffered a cut down as the broiler industry took more and more market share. According to the National Chicken Council report in 2003, the share of the broiler industry was 6% in 1974, which grew to 26% in 1989 and a further 46% in 2001(Martinez, Stewart, p. 24). The graph shows how the broiler industry replaced the whole-chicken over the years:
More fast-food chains and superstore chains like Wal-Mart entered the market and processed food items grew in demand compared to a whole chicken. However, after the mid-90s the prices have an overall rising trend. This reflects the aftermath of the US involvement in middle-east, the Iraq invasion in 1991 that created a fuel crisis. Internet boom also saw the rise of the IT industry and a collective economic boom came with its necessary cost of high inflation.
The rising trend in price can also be explained through the supply side. A larger percentage of chicken poultry is being consumed by convenience products like nuggets and frozen cut pieces. The entrance of numerous companies into the convenience food products industry disturbed the demand and supply match. The whole chicken was now consumed by a middle industry, the food processing and convenience food companies, instead of direct consumers.
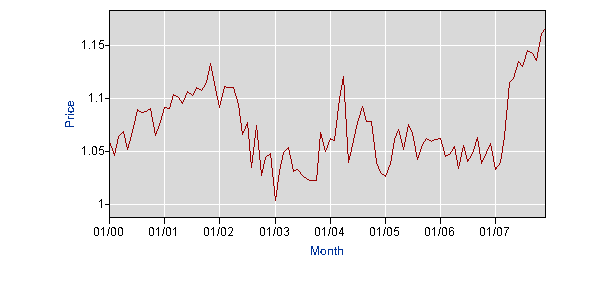
The Period 2001 to 2007
Summary of Price trends:
- Consistent rise up to Sep-Oct 2001. High at 1.133 in Nov 2001.
- Remains high up to early 2002. Consistent fall up to Jan 03. Low price period from mid 02 to late 03.
- Prices shoot up again on April 04. But fall later. The consistent period from mid 04 to start of 07.
- The consistent rise of prices in 2007. Reaches highest ever in mid 07. Price at $ 1.17 at end of 07.
The price trend from the previous decade continues, owing to smooth economic stability and policies, until Sep 11, 2001. The event of the twin towers terrorist attacks marked the start of another great economic recession in the US. The stock market also tumbled owing to some corporate scandals. The sharp decline in prices reflects the job market and low demand situation. Further, the food product market developed to be highly competitive and diverse. According to Martinez and Stewart, “About 10,000 new food and beverage products were introduced in 2002”. (Stewart, Martinez, p. 25) This also further pushed down the demand for whole-chicken streams.
But the main factor in such sharp decline and demand and prices was the recession, as shown by its recovery in 2003. The economy recovered from the 9/11 trauma from 2003 to 2005. The local chicken industry also recovered well and prices rose to beyond $1.1 in late 2004.
The second Iraq war, which started in 2005, brought the long and resisting oil crisis. The inflation shot higher than ever and oil prices soared to $140 a barrel. This is reflected in the highest price of a whole chicken in the period. As Iraq War continues, oil prices continue to send the local industry into issues of high costs.
In Aug and Sep 2005, two devastating hurricanes hit the Gulf Coast region. The floods damaged the oil refineries and port facilities, pushing the already high fuel prices, and loss of supplies.
Bibliography
- Campagna; Anthony S. The Economy in the Reagan Years: The Economic Consequences of the Reagan Administrations Greenwood Press. 1994
- Stephen Martinez, Hayden Stewart. From Supply Push to Demand Pull: Agribusiness Strategies for Today’s Consumers. Amber Waves. 2003.
- Harris, J.Michael. Food Product Introductions continue to Decline. 2000. Food Review, Vol. 25, Issue 1, 2002.