Balance sheets document the state of affairs within organizations and summarize the assets (items that have value), liabilities (current and non-current obligations), and net assets (the difference between assets and liabilities) (Codman, 2013).
Total assets equal the total current assets and the net plant, property, and equipment. Total liabilities equal the total current liabilities and long-term debts. Finally, the difference between the total assets and total liabilities is the net assets.


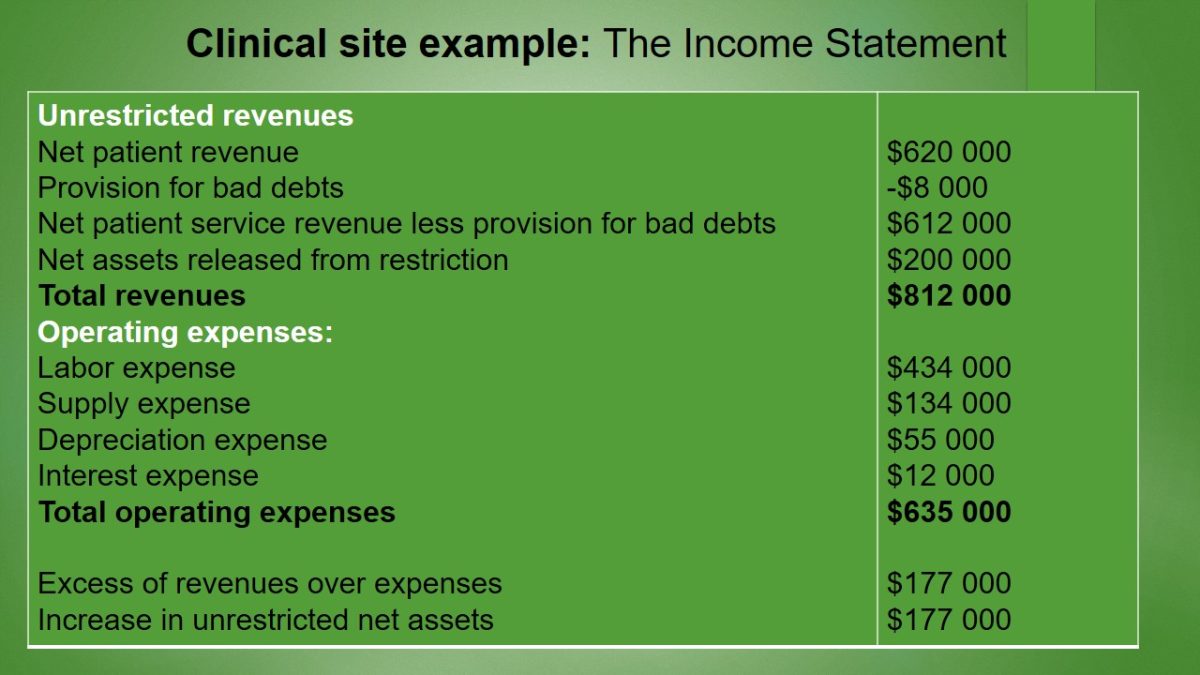
Income statement reports the financial performance of the organization for a designated period of time (Casabona & Coville, 2014).
To get the total operating expenses, it is necessary to add all of them together. The difference between them and the total revenues calculated above is the excess of revenues over expenses.


The Cash Flow Statement
Cash Flow Statement: a financial statement that demonstrates how changes in balance sheet accounts and income influence cash or its equivalents (Barua & Saha, 2015).
Cash Flows from Operating Activities:
Change in net assets 7 500
Adjustments to reconcile change in net assets to net cash provided by operating activities
Depreciation 7 500
(Increase) decrease in current assets:
Increase (decrease) in current liabilities
Increase in net account receivables -52 000
Increase in inventory -3 500
Decrease in prepaid expenses 2 000
Increase in accounts payable 42 000
Decrease in accrued expenses -3 500
Increase in other current liabilities 2 500
Net cash flows from operating activities 2 500
Cash flows from investing activities
Purchases of equipment -157 000
Sale of long-term investments 33 000
Net cash used in investing activities 124 000
Cash Flows from Operating Activities:
Change in net assets 7 500
Adjustments to reconcile change in net assets to net cash provided by operating activities
Depreciation 7 500
Increase) decrease in current assets:
Increase (decrease) in current liabilities
Increase in net account receivables -52 000
Increase in inventory -3 500
Decrease in prepaid expenses 2 000
Increase in accounts payable 42 000
Decrease in accrued expenses -3 500
Increase in other current liabilities 2 500
Net cash flows from operating activities 2 500
Cash flows from investing activities
Purchases of equipment -157 000
Sale of long-term investments 33 000
Net cash used in investing activities 124 000
Net cash flows from operating activities = all increases/decreases in current assets.
The payment components are, apparently, expenditures; consequently, they should be subtracted.
Net cash flow from operating activities + net cash flow from investing activities + net cash flow from financing activities = the net increase or decrease in cash flow.


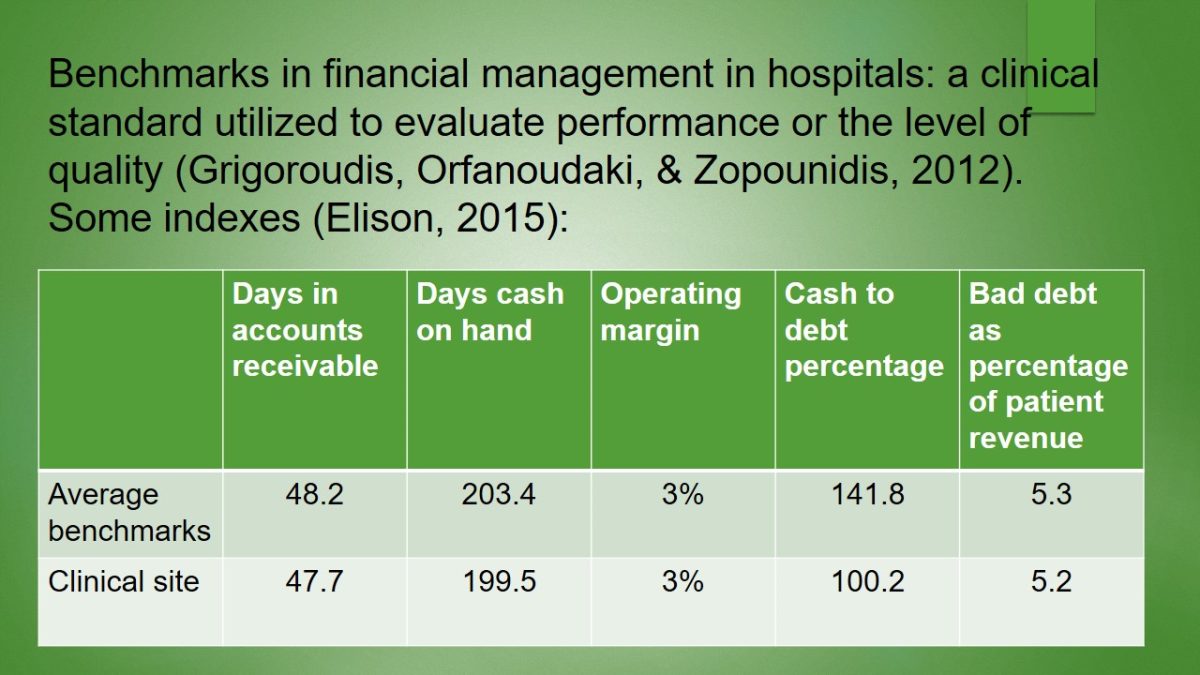
Benchmarks in financial management in hospitals: a clinical standard utilized to evaluate performance or the level of quality (Grigoroudis, Orfanoudaki, & Zopounidis, 2012).
Some indexes (Elison, 2015):

One of the advantageous strategies is to involve RNs (Allen, Himmelfarb, Szanton, & Frick, 2014). They may reimburse doctors; because nurses are paid about a half of physicians’ salary, approximately $88,000, the hospital may reduce costs (Jennings, Clifford, Fox, O’Connell, & Gardner, 2015).

References
Allen, J. K., Himmelfarb, C. R. D., Szanton, S. L., & Frick, K. D. (2014). Cost-effectiveness of nurse practitioner/community health worker care to reduce cardiovascular health disparities. The Journal of Cardiovascular Nursing, 29(4), 308-314.
Barua, S., & Saha, A. K. (2015). Traditional ratios vs. cash flow based ratios: Which one is better performance indicator?. Advances in Economics and Business, 3(6), 232-251.
Casabona, P. A., & Coville, T. (2014). Statement of comprehensive income: New reporting and disclosure requirements. Review of Business, 35(1), 23-34.
Codman, E. A. (2013). The classic: A study in hospital efficiency as demonstrated by the case report of first five years of private hospital. Clinical Orthopaedics and Related Research, 471(6), 1778-1783.
Elison, A. (2015). 40 financial benchmarks for hospital executives. Web.
Grigoroudis, E., Orfanoudaki, E., & Zopounidis, C. (2012). Strategic performance measurement in a healthcare organisation: A multiple criteria approach based on balanced scorecard. Omega, 40(1), 104-119.
Jennings, N., Clifford, S., Fox, A. R., O’Connell, J., & Gardner, G. (2015). The impact of nurse practitioner services on cost, quality of care, satisfaction and waiting times in the emergency department: A systematic review. International Journal of Nursing Studies, 52(1), 421-435.