Introduction
The worldwide spread of coronavirus disease (COVID-19) since the beginning of 2020 has brought significant changes in a social realm. In Poland, the first wave of pandemics was announced on January 30, 2020 in line with a separate note from the World Health Organization (WHO), suggesting new public health management recommendations. The focal point articulated by the government was social distancing, lockdown, and eventual isolation, which has shaped the life norms of Polish population. Specifically, the dramatic change was observed for sport activities, since the lockdown imposed restrictive measures for visiting sport clubs and swimming pools to avoid potential infection risks.
Considerably, it created another social problem of controlling personal health and diet through engaging in indoor sport activism, which was alternatively managed through regular exercising outdoors. Furthermore, additional risks were created through the emotional aspect of spending more time at home and therefore tending to be more relaxed rather than physically engaged or enforced to maintain healthier lifestyle. Hence, it is critical to explore motivational aspects that encourage individuals to participate in indoor sport activities during the pandemic times.
Depending on the individual habits and lifestyles, the overall engagement for indoor sport activities and allocated hours may vary. For instance, individuals who actively exercised before the lockdown are more likely to develop their own agendas for indoor activism, eventually using online training manuals and smart applications. Meanwhile, the others might engage in sport activities bearing in mind the risks of obesity, behavioral, and emotional concerns of adapting personal lifestyles to the new social reality.
Furthermore, there are demographic factors that diversify individual attitudes to indoor sport engagement and overall sense of active lifestyle. Hence, the purpose of this study is to explore the determinants of indoor sport practices during pandemics based on the sample of students from the faculty of economic sciences studying in the University of Warsaw.
Hypotheses Development
To construct an econometric model, several factors are initially considered as important determinants of indoor sport engagement. The first one is age, which directly relates to individual health capabilities to regularly exercise. It is hypothesized that younger individuals will be more productive for the indoor sport practice during the lockdown. However, the age as a factor does not imply that a person is physically prepared to spend more time for exercising, eventually preferring other activities that match personal lifestyle. Hence, the first hypothesis is formulated as follows:
- H0: Younger individuals are more likely to spend more hours for indoor sport activities.
- HA: Younger individuals are less likely to spend more hours for indoor sport activities.
The second factor considered for constructing the model is gender. The conventional wisdom suggests that females tend to engage in sport activities more frequently than males, pursuing the need of maintaining personal attractiveness. However, this statement is equally fair for males who recognize the importance of managing personal lifestyle, which eventually contributes to individual self-confidence and sense of masculinity. Hence, the second hypothesis is formulated as follows:
- H0: Females are more likely to spend more hours for indoor sport activities than males.
- HA: Females are less likely to spend more hours for indoor sport activities than males.
The third factor considered for constructing the model is the employment status. Unfortunately, the lockdown and overall business performance condition of certain organizations led to increasing unemployment because of the need for financial savings and redesigning operational activities. Particularly, this factor should be considered with respect for the chosen research population, since employed students primarily work on the part-time basis and therefore experience the risk of losing the job during the periods of economic crisis. Considerably, unemployment status suggests that people have more free time, which could be eventually allocated for the sport activity engagement to reduce stress. Hence, the third hypothesis is formulated as follows:
- H0: Unemployed individuals are more likely to spend more hours for indoor sport activities comparing to employed ones.
- HA: Unemployed individuals are less likely to spend more hours for indoor sport activities comparing to employed ones.
The fourth factor considered for constructing the model is individual engagement in volunteering or extracurricular activity. The basic idea is that individuals who spend more time through physical rather than distant socializing appear to be more active in terms of managing personal health through sport activism. However, considering the lockdown restrictions such assumption might be reconsidered in a favor of remote collaboration, where volunteering efforts are primarily executed using online tools. Considerably, to reproduce the effect of physical engagement, these enthusiasts might consider enhancing personal productivity through the indoor sport activism. Hence, the fourth hypothesis is formulated as follows:
- H0: Individuals engaged in volunteering or extracurricular activities are more likely to spend more hours for indoor sport activities during the lockdown.
- HA: Individuals engaged in volunteering or extracurricular activities are less likely to spend more hours for indoor sport activities during the lockdown.
The fifth factor considered for constructing the model is the change of a daily usage of social media. Reasonably, it is anticipated that lockdown and home isolation lead to increased engagement with remote communication channels, which might be eventually related to entertainment rather than work or studies. In its nature, such factor creates distraction from the reality and might eventually result in avoidance of benefitting healthy habits over unreasonable time spending. Considerably, the fifth hypothesis is formulated as follows:
- H0: The increase in daily usage of social media during the lockdown leads to decrease of hours spent for indoor sport activities.
- HA: The increase in daily usage of social media during the lockdown does not lead to decrease of hours spent for indoor sport activities.
The last factor considered for constructing the model is the individual need of following a specific diet related to personal health or consumption preferences. From the healthcare perspective, the need to follow a diet creates emotional association with the importance of the lifestyle changes, suggesting that failing to meet those creates risks for personal comfort or wellbeing. Hence, the sixth hypothesis is formulated as follows:
- H0: Following specific diet increases the odds of participating in indoor sport activities during the lockdown.
- HA: Following specific diet does not have an effect on participating in indoor sport activities during the lockdown.
Literature Review
Specific determinants and factors that potentially influence the engagement with indoor sport activism during the lockdown were explored in recent studies. In a Polish context, practical research was conducted to identify dietary changes among the adults during COVID-19 using a cross-sectional online survey and deploying the k-means algorithm and logistics regression method. According to the observational findings, 43% of respondents reported the shortage of physical activity, 49% of respondents started to spend more screen time, and 34% of respondents mentioned increased food consumption.
Furthermore, reflecting on the dietary change patterns it was found that economically sufficient regions of Poland with high GDP performance reported a shift from prohealthy to unhealthy status, where overweight and obesity appeared to be less controlled. Finally, it was admitted that factors such as aging over 40 years, having children, unemployment, and the preference for not consuming homemade meals further exposes individuals to demonstrate unhealthy behaviors. Overall, it was concluded that compulsory isolation eventually leads to the decrease of sport activism and provokes the manifestation of unhealthy behaviors.
Another study explored through the preliminary research relates to the gender factor and investigates body weight changes among Polish females in nutritional and sociodemographic context during the lockdown. Overall, authors specified that during the observation period, 34% of participants gained weight while only 18% reduced it. Meanwhile, it was found that 44% of obese participants further increases body weight, while 74% of the underweighting females lost it. Further factoring efforts revealed that body weight changes in both cases relate to unhealthy dietary changes and uncertainty in physical activity engagement, which adversely affects metabolism.
Meanwhile, it was also found that the weight gain risk is primarily associated with the existing obesity and living in macroeconomic region with lower gross domestic product (GDP) index. On the contrary, younger individuals engaged in remote work appeared to demonstrate higher rates of the weight loss during the lockdown. Hence, the study articulates the importance of developing dietary and lifestyle recommendations for various demographic female groups to ensure that specific health practices are followed during pandemic times to reduce potential comorbidity risks.
Finally, the change in weight and dietary habits was explored among the outpatients who experienced a mandatory lockdown during the pandemics in Northern Italy, which is one of the countries with the highest COVID-19 proliferation. In this study, research participants were asked to complete a short survey with a self-assessment related to weight changes, exercising, nutritional choices, and post-isolation working activities. Based on the multivariate regression analysis, it was found that decreased physical exercising, boredom, depression, and elevated consumption of unhealthy food led to abnormal weight gains after the lockdown.
Further analysis suggested that the risk of obesity is also positively correlated with increased need for education, which is potentially explained with a need for exploring new employment opportunities remotely while regularly eating unhealthy food. Hence, the study supports previous conclusions on the importance of developing the indoor sport activity guidance during pandemic depending on the health condition, while also considering individual mental state.
To summarize, recent studies acknowledge the importance of determining critical factors for enhancing physical activity efforts and outline present risks based on the longitudinal observations during the lockdown. Meanwhile, the focus was primarily made on particular cases of gender, previous comorbidity effects such as obesity and nutritional preferences, as well as common unhealthy behaviors related to food consumption. Hence, in line with previously developed hypotheses, it is reasonable to extend previous models with additional variables that would help to explain human behaviors during the lockdown and identify focal areas for improvement.
Description of Dataset and Variables
To estimate the econometric model, a survey was conducted among 122 respondents studying on a Faculty of Economics in the University of Warsaw. Because of the lockdown, research participants were isolated from the in-class studies; therefore, data collection process was executed through distributing a web link that redirected a respondent to a pre-designed Google Form. Some observations were removed from the dataset given the lack of substantial data, primarily found through the incomplete open-ended responses. The RStudio software was used for the model estimation and further interpretation.
The dependent variable used for the model estimation is the weekly number of hours the respondent was involved in sport activity during the lockdown period (y (hours). Since in a survey representation the question was formulated as a text response, it was further converted into a numeric format, indicating the highest limit for activity engagement (i.e., a text response of ‘3-4 hours’ was converted to a value of 4, and a text response of ‘zero’ was converted to a value of 0). The independent variables were defined and coded as follows:
- X1(age) is a continuous variable that records the age of respondent at a time when one completed the survey;
- X2(gender) is a discrete variable that identifies the gender of a respondent and reports the value of ‘0’ for males and ‘1’ for females;
- X3(work) is a discrete variable that identifies whether an individual was or was not working during the lockdown, which reports the value of ‘0’ for working and ‘1’ for not working;
- X3a(worka) is a discrete variable that identifies the type of employment among respondents who specified that they have been working during the lockdown and reports the values of ‘online’, ‘outside’, and ‘online and outside’. Since it is not applicable to the whole dataset, it is excluded from regression model and is used for descriptive purposes only.
- X4(volunt) is a discrete variable that identifies whether an individual was engaged in any extracurricular or volunteering activity, which reports the value of ‘0’ for being engaged and ‘1’ for not being engaged;
- X5(socmedia) is a discrete variable that reports the daily change in social media use during the lockdown by ‘0’ (significantly decreased by more than 2 hours), ‘1’ (slightly decreased up to 2 hours), ‘2’ (remained unchanged), ‘3’ (slightly increased up to 2 hours), and ‘4’ (significantly increased by more than 2 hours);
- X6(weight) is a discrete variable that reports individual weight changes during the lockdown by ‘0’ (gaining weight of more than 3 kilos), ‘1’ (gaining weight of less than 3 kilos), ‘2’ (weight remained unchanged), and ‘3’ (losing some weight)
- X7(activity) is a discrete variable that reports whether a respondent was engaged or not engaged in any sport activity before the lockdown with the values of ‘0’ (no) and ‘1’ (yes)
- X8(diet) is a discrete variable that reports whether a respondent follows any specific diet, such as vegan, vegetarian, pescatarian, raw food or others, with the values of ‘0’ (no) and ‘1’ (yes).
With respect to initial hypotheses formulated in a second chapter, we consider that the model includes primary and secondary variables for the analysis. Therefore, the regression formula used for hypotheses testing is specified as follows:
Estimation Results and Hypotheses Verification
Descriptive Statistics
The dependent variable used in the study is the number of hours spent for indoor sport activity. The initial analysis of the data has shown that one of the responses should be excluded from the dataset given the unreasonable figures indicated by the respondent. Specifically, it was mentioned that for the age of 60 the number of weekly hours spent for indoor sport activities is 170, which is even higher than the number of hours in a week.
Hence, Figure 1 shows the histogram that visualizes the distribution of weekly hours spent for indoor sport activity among the research participants. Overall, it could be concluded that the distribution of weekly hours spent is skewed to the right with the lower values indicating minor indoor sport activity among respondents. However, the distribution also has four outliers above the value of 10 hours, which might be an indicator of having sport activists participating in a survey.

Continuous Variables
The dataset contains two continuous variables, which are the dependent variable that estimates the number of hours spent for indoor sport activities during the lockdown and age of research participants. Table 1 summarizes the descriptive statistics for both variables, specifying mean values, standard deviation, and range limits. For hours variable, it was identified that the average number of the time spent for indoor sport activities among research participants is slightly more than 5 hours. However, the standard deviation is higher than 15 hours, primarily because of the outliers graphed in Figure 1. Furthermore, Table 2 shows that the average age of research participants is 22 years, ranging from 17 to 60, while the maximum value is a significant outlier given that the standard deviation is 4.5 years. Overall, it conforms with the assumption of all respondents mostly being bachelor or master students in the University of Warsaw.
Table 1. Summary statistics for continuous variables.
Discrete Variables
The rest of the variables used for developing econometric model are discrete. Table 2 summarizes the distribution of responses based on the parametric codes assigned and explained in a fourth chapter. For the gender variable, there is an almost fair distribution of responses, with a somewhat higher participation observed among the male participants. Similarly, the equality is observed for employed and unemployed respondents, with the latter slightly higher than the former.
For the type of employment, it was found that 44.6% of respondents as a majority were working online as a preferred mode of cooperation. However, it appeared having a certain percentage (24.6%) of respondents who combined different working schedules. Volunteering and extracurricular activities were less observed among the population involved in research with almost 72% not participating in such endeavors.
The large number of respondents also reported a slight to significant increase in a daily social media use, with 36.1% and 37.7% confirmations provided respectively. In terms of the weight gain, major responses suggested that there was either a slight increase or none at all. However, 77% of participants indicated that they engaged in sport activities before the lockdown. Finally, it was admitted that the minority of respondents followed specific dietary habits prior to the quarantine restrictions and isolation.
Table 2. Summary statistics for discrete variables.
Interactions
It was previously mentioned that the variable X3a only fits the model if the values for positive response on employment status is indicated. Given that almost a half of respondents were unemployed during the lockdown, this variable was excluded from the econometric model. However, it will be still interpreted for the research summary as a positive indicator for professional activity that might change a perception of the indoor sport engagement during the lockdown.
Selecting a Functional Form
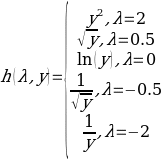
The choice of the functional form implies that originally proposed econometric model might require logarithmic transformation of continuous variables to fit the data for more reliable interpretation. According to the description of variables and the dataset, there are two continuous variables that should be considered for the application of the most appropriate data fit method. As shown in the figure 1, we have a highly non-standardized data for the variable hours, which contains more than 25 observations of zeros. It means that data standardization should be performed using the Yeo-Johnson transformation, which allows transforming all non-negative values unlike the Box-Cox transformation based on the following assumption:

Using the following code in R: > yeojohnson (hours, eps = 0.001, standardize = TRUE), we identified that λ = -0.1276792, the mean before standardization is 1.162437, and standard deviation before standardization is 0.7581436. Hence, the variable hours require power transformation that is shown in the first line of the above formula. The normalized data plot is shown on the Figure 2. Comparing to the raw data, the distribution appears to be close to normal if comparing the range from -1 to 2.5, while it still has two outliers on both left and right tails.

The next continuous variable that should be considered for transformation is age. Figure 3 shows the initial distribution for age groups in the population cohort, suggesting that the one requires further normalization and has outliers. However, in this case we might strictly apply the Box-Cox rather than Yeo-Johnson transformation since the numeric values for ages are all positive and do not include zeros. Hence, the following mathematical assumption is made for this variable:
Using the following code in R: > boxcox (age, standardize = TRUE), we identified that λ= -0.9999576, the mean before standardization is 0.9534844, and the standard deviation before standardization is 0.00616265. Obviously, it supports the need of power transformation as shown in the fourth option for the previous formula, since the value of lambda is the closest to -0.5. The normalized data plot for age is shown in Figure 4. Hence, based on the performed transformation our adjusted regression formula specified in the fourth chapter looks as follows (values for λ are rounded to the first decimals, while further computed as specified in R estimations above):


Regression
Considering that we use both continuous and discrete variables, the initial model from chapter 4 and transformed model from chapter 6 will be used to verify the best fit for interpreting the data. The summary table for the original model is provided in Table 3. Overall, it was found that the model is statistically significant with a p-value very close to zero, the F-statistics of 25.11 on 6 and 115 degrees of freedom, the multiple R-squared value of 0.5671 (56.71%) and the adjusted R-squared value of 0.5445 (54.45%).
It implies that the variation in dependent variable is explained by dependent variables by more than 50%. Meanwhile, it was also found that model significance is primarily influenced by age and socmedia variables, where the positive relationship is observed between the hours spent for indoor sport activity and age, while daily use of social media is related to the same variable adversely. The other variables have less significance with reported p-values higher than 0.05.
Table 3. Regression analysis for the initial model.
The summary table for the transformed model is provided in Table 4. Overall, it was found that the model is statistically not significant with a p-value of 0.487, the F statistics of 0.9148 on 6 and 115 degrees of freedom, the multiple R-squared value of 0.04555, and the negative adjusted R-squared value. Individual p-values for independent variables are also higher than 0.05, which brings more concerns for the model validity. Since the transformed model provides little value for interpretation of results, the original representation is considered being more informative and is further used for the research summary.
Table 4. Regression analysis for the transformed model.
Diagnostic Tests
The first diagnostic tool used to determine the correctness of the model’s functional form is Ramsey’s RESET test. The null hypothesis specifies that the model does not have omitted variables; hence, given the difference in original and transformed model it is attempted to consider adding variables with the power of 2 to 3 for acceptance using the following RStudio code:
> resetTest (indoor_activity, power = 2:3, type = “regressor”).
The output suggests that F statistics equals 36.243, while the p-value itself is less than 0.05. It means that the null hypothesis is rejected and that the model would benefit from having more variables to explain its statistical significance and linearity, since at the current point it is not linear.
The second diagnostic tool is the Breusch-Pagan test, which evaluates whether the ordinary least squares approach is the best linear estimator chosen for the model and there are no risks of heteroscedasticity. Similarly to the previous test, it is found that the p-value is less than 0.05 at the F statistics equal to 93.99, which means that the null hypotheses is rejected. These findings support the initial assumption on the necessity to enlarge the research sample to obtain trustworthy results or otherwise, include additional variables for the better linearity evidence.
The third diagnostic tool applied for the fitted model constructed in the previous chapter is the Jarque-Bera test. It is used to determine whether the sample data used in the model has skewness and kurtosis that follow the principles of normal distribution though the analysis of residuals. The diagnostic has been conducted based on the initial model recorded as indoor_activity object, as well as fitted model recorded as fitmodel object. Therefore, we seek whether the X-squared value of the test much higher than zero, and if the p-value is less or higher than 0.05.
The output of the initial model yielded the following output:
> jarque.bera.test (residuals(indoor_activity))
Jarque Bera Test
data: residuals(indoor_activity)
X-squared = 564.32, df = 2, p-value < 2.2e-16
The test statistics is equal to 564.32 and the p-value is less than 0.05, which allows rejecting the null hypothesis and conclude that the data is not normally distributed.
The output of the transformed model yielded the following output:
> jarque.bera.test (residuals(fitmodel)
data: residuals(fitmodel)
X-squared = 1.1147, df = 2, p-value = 0.5727
The test statistics is equal to 1.1147 and the p-value is higher than 0.05, which means that we cannot reject the null hypotheses and conclude that the data is normally distributed. Basically, it confirms previous remark on the need of using the Yeo-Johnson transformation to normalize the data, since the original dataset is not normally distributed. However, there is still a concern related to the validity of results, since the fitted model, even if normally distributed, is statistically insignificant.
Fourth, the test for autocorrelation using the Breusch-Godfrey model was performed. The purpose is to evaluate if there is a higher order serial correlation in both initial and fitted models. The test is based on the null hypothesis that there is no serial correlation to any order power chosen to be explored based on the 5% of significance as a default. Hence, the following commands were used for the further validation of assumptions.
First, the initial model was tested to identify the degree of autocorrelation. The order of serial correlation considered for both tests is equal to 3, so that it is possible to distinguish the test output from the Durbin-Watson approach. The F-statistics has been chosen for the test value display instead of Chi-Square statistics realizing the need of fitting the finite number of observations. For the initial model, the following output has been obtained:
> bgtest(indoor_activity, order = 3, order.by = NULL, type = c(“F”), data = list())
Breusch-Godfrey test for serial correlation of order up to 3
data: indoor_activity
LM test = 0.55689, df1 = 3, df2 = 112, p-value = 0.6446
Considering that the p-value is more than 0.05 and the F-statistics is higher than 0, we cannot reject the null hypothesis and conclude that up to the power level of 3, there is no significant autocorrelation in the initial model.
For the adjusted model, the following output has been obtained:
> bgtest(fitmodel,order = 3, order.by = NULL, type = c(“F”), data = list())
Breusch-Godfrey test for serial correlation of order up to 3
data: fitmodel
LM test = 0.57163, df1 = 3, df2 = 112, p-value = 0.6348
Similarly to the results of the previous model, the p-value is more than 0.05, and the F-statistics is higher than 0. Hence, we cannot reject the null hypothesis and therefore conclude that for the fitted model, there is no significant autocorrelation up to the power level of 3.
Finally, to evaluate if it is worth dropping any omitted or insignificant variables, the Cook distances were estimated to show significant outliers. Figure 5 provides the summary for that effort, concluding that the model has only one major outlier with a distance higher than 0.8, which, according to the rule of thumb is three times higher than the sample mean while the rest of the data pieces do perfectly fit with one another. Combining all together, it is evident that the study requires significantly larger research sample to be considered for the analysis; for instance, a pool of at least 500 respondents instead of 100. Meanwhile, it is also required to consider the need of extended survey to explore potential impact on the indoor sport activity during pandemics based on the choice of alternative variables given that the risk of autocorrelation was rejected.

Summary
The aim of the study was to develop an econometric model that would be helpful to estimate hours spent for indoor sport activity among a group of 122 respondents based on the sociodemographic parameters during the lockdown in Poland. Overall, it was found that the first significant determinant of sport activism for the selected sample are age, where older respondents prefer engage in indoor sport activities more frequently than younger ones. The second important factor is engagement with the daily usage of social media, where less self-reported time spent for the activity leads to more hours dedicated to the indoor exercising.
For the rest of the factors, it was concluded that volunteering activities, gender of the respondent, work engagement, and dietary habits individually do not have any significant impact on time allocated for sport activism during the lockdown. However, it is worth considering additional model constituents given that the number of hours is not completely explained by the chosen parameters.
Meanwhile, certain statistical limitations were observed for the data and model choices, which requires further refinement of the model through the application of alternative analytical inquiries. First, there is a problem with diagnostic tests, with both cases reporting the lack of variables used to justify significant model linearity. Second, while the normalization process led to the overall improvement of the model fit, it is still questionable what dependent variables should be chosen to improve statistical validity.
Finally, there is a lack of consistency with the past research that primarily dealt with gender and dietary principles of individual behavior during COVID-19 as the determinants of indoor sport activity engagement. Hence, it is recommended to perform another effort in exploring the other, personally-tailored habits that might force individuals to manage personal health during the lockdown times.
Bibliography
Chien, L-C., ‘A Rank-Based Normalization Method with the Fully Adjusted Full-Stage Procedure in Genetic Association Studies’, PLoS One, vol. 15, no. 6, 2020, e0233847.
Drywien, M.E. et al., ‘The COVID-19 Pandemic Lockdowns and Changes in Body Weight among Polish Women. A Cross-Sectional Online Survey PLifeCOVID-19 Study’, Sustainability, vol. 12, 2020, 7768.
Górnicka, M. et al., ‘Dietary and Lifestyle Changes During COVID-19 and the Subsequent Lockdowns among Polish Adults: A Cross-Sectional Online Survey PLifeCOVID-19 study’, Nutrients, vol. 12, 2020, 2324.
Pellegrini, M. et al., ‘Changes in Weight and Nutritional Habits in Adults with Obesity during the “Lockdown” Period Caused by the COVID-19 Virus Emergency’, Nutrients, vol. 12, 2020.