Introduction
Many factors indeed directly or indirectly affect the photosynthetic rate in terrestrial plants. Ordinarily, there exist opposing conditions that influence photosynthetic rates. It is worth noting that photosynthesis is a multi-step process that needs carbon dioxide, sunlight and water as substrates. The release of oxygen and energy as by-products occurs after the process is complete. The energy can subsequently be converted into sucrose, glucose or any of the many other sugar molecules. Photosynthesis is the cause of this composition, without which the amount of oxygen in the air would be as low as below five percent. Consequently, carbon dioxide levels would be very high; enough to exterminate the entire mammalian life; this makes the process to be one of the defining features of the plant kingdom.
Study Objectives
This study attempts to investigate the factors influencing the photosynthetic rate. In this regard, one is expected to establish the necessities of photosynthesis and discover the requirement of carbon dioxide and light for oxygen evolution. The objectives to be employed in the study include:
- To investigate light as a limiting factor in oxygen evolution
- To examine carbon dioxide as a limiting factor in oxygen evolution
- To explore geographical location of species of plants as a limiting factor in oxygen evolution
- To investigate effects of LED distance as a limiting factor in oxygen evolution
Hypothesis
- Null (H0) hypothesis: Geographical location, LED distance, and treatment of Light and Carbon dioxide have no statistically significant effect on oxygen evolution at 5% level of precision
- Alternative (HA) hypothesis: Geographical location, LED distance, and treatment of Light and Carbon dioxide have statistically significant effects on oxygen evolution at 5% level of precision
Variables
- Dependent variable– rate of oxygen evolution
- Independent variables –
- Light availability
- Quantity of carbon dioxide available
- Distance from the source of LED light
- Type of Plant Species
Results and Analysis

The above analyses have been conducted using Stata version 11. Two sample t-tests have been carried out on the test parameters to either accept or reject the null hypotheses regarding the oxygen evolution process.
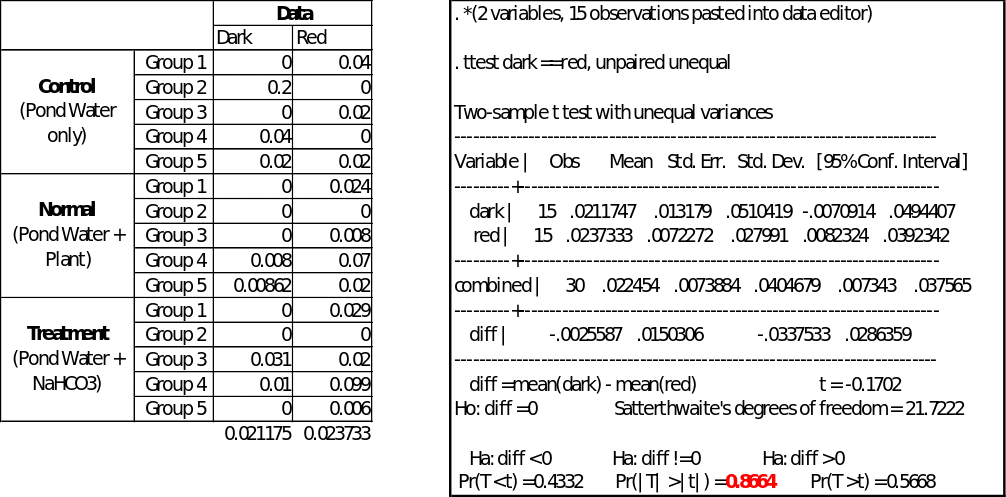
- Light dependence of oxygen evolution– considering Cabomba species, both in darkness and Red light, the probability value is 0.8664, which is above the critical value of 0.05 at 5% significance level. Therefore, we accept the null hypothesis, and conclude that statistically; there is no significant impact of light on oxygen evolution process at 5% level of precision (See Appendix 1).
- Effect of increased carbon dioxide on oxygen evolution– for the normal and treatment values of group 4, the probability value is 0.3413, which is above the critical value of 0.05 at 5% significance level. Thus, we confirm the null hypothesis, and establish that statistically; there is no significant impact of increased carbon dioxide on oxygen evolution process at 5% level of precision (See Appendix 2).
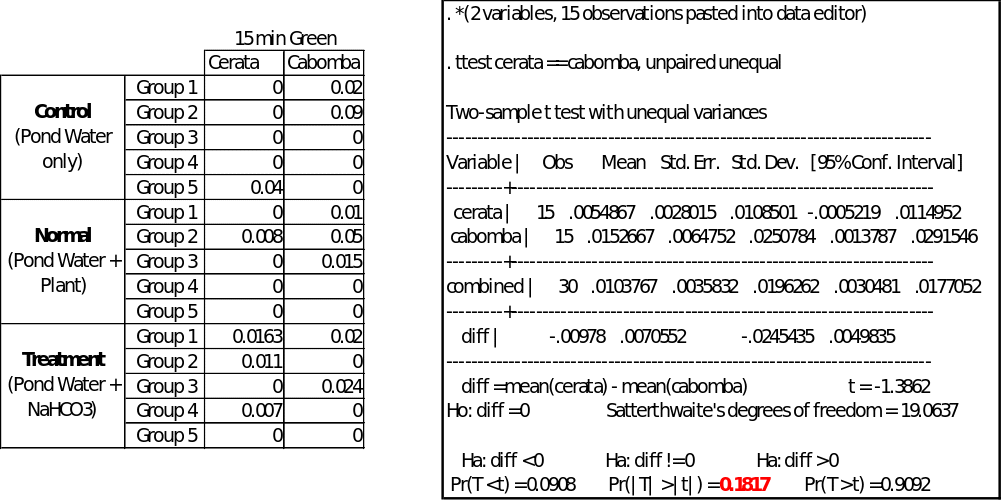
- The rate of oxygen evolution on the geographical location of species of plants– considering group 4 values of cerata and Cabomba species, subjected to an equal wavelength of green light, the probability value is 0.1817, which is above the critical value of 0.05 at 5% significance level. Hence, we agree with the null hypothesis, and affirm that statistically; there is no significant difference in the rate of oxygen evolution process in different plant species at 5% level of precision (See Appendix 3).
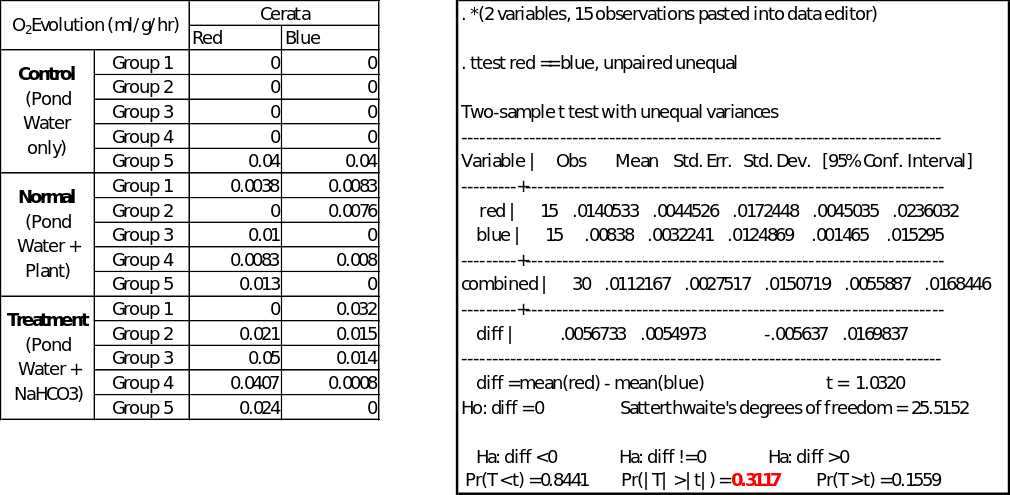
- The rate of oxygen evolution on distance from the source of light– considering Red and Blue LED distances of cerata species, the probability value is 0.3117, which is above the critical value of 0.05 at 5% significance level. As a result, we accept the null hypothesis, and confirm that statistically; there is no significant difference in the rate of oxygen evolution process when the distance between the sources of light to the plant species is altered proportionately at 5% level of precision (See Appendix 4).
Discussion of Results
Light as a Limiting Factor of Photosynthesis
Light is a limiting aspect, particularly when its amount is too little to let the light-dependent effect carry on at its optimum rate. Even though some photosynthesis will continue in the absence of light, the rate will be much lower as compared to when the light was sufficient and the distance shorter. Such mostly happens with plants in the forest under other plants.
Distance as a Limiting Factor of Photosynthesis
Different LED lights have different wavelengths; hence, varying the distance from the lamps is purposely done to ensure that it is not a limiting element in the photosynthesis.
Carbon Dioxide as a Limiting Factor of Photosynthesis
NaHCO3 boosts the availability of carbon dioxide and ensures that it is not a limiting aspect of the reaction. Plain water might not have sufficient oxygen to facilitate the occurrence of the utmost photosynthetic rate. Hence, it eradicates the limitation factor.
Type of Plant Species as a Limiting Factor of Photosynthesis
The biogeographic distribution of plant species reflects their specific climatic adaption, making them possess a particular set of intrinsic characteristics. This explains why not any tree grows anywhere. The geographic adaptation affects the position of leaves on trees, which in turn influences photosynthesis. These two plant species were specifically used to ensure that they were not the limiting factors of the photosynthesis process.
Conclusion
All the independent variables in this experiment are the main limiting factors in the photosynthesis process. Their inadequate supply will tend to reduce the photosynthetic rate or process, and the reverse is true.
Questions
- Experimental controls used in this study include the use of pond water only, as well as covering the test tubes with a dark cloth. By fixing or eliminating them, it makes it easier to identify precisely the relationship between independent and dependent variables. A control is, therefore, part of the experiment that tests whether the system behaves as it should (Smith & Dukes, 2013).
- Taking a dark reading before every LED reading attempts to serve two main purposes:
- It shows that the system is behaving as one would expect from previous experience, knowledge and observation to allow an interpretation of the experiments.
- In case something is incorrect, it ensures that it is possible to identify the experimental inaccuracy so that it can be rectified the next time it is done.
LED lamps were positioned at different distances to determine the effect of the varying light intensities on the photosynthetic rate.
- The null and alternate hypotheses encompass:
- Null (H0) hypothesis: Treatment of Light has no statistically significant effect on oxygen evolution at 5% level of precision
Alternative (HA) hypothesis: Treatment of Light has a statistically significant effect on oxygen evolution at 5% level of precision - Null (H0) hypothesis: Treatment of Carbon dioxide has no statistically significant effect on oxygen evolution at 5% level of precision
Alternative (HA) hypothesis: Treatment of Carbon dioxide has a statistically significant effect on oxygen evolution at 5% level of precision - Null (H0) hypothesis: Geographical location of species of plants has no statistically significant effect on oxygen evolution at 5% level of precision
Alternative (HA) hypothesis: Geographical location of species of plants has a statistically significant effect on oxygen evolution at 5% level of precision - Null (H0) hypothesis: LED distance has no statistically significant effect on oxygen evolution at 5% level of precision
Alternative (HA) hypothesis: LED distance has a statistically significant effect on oxygen evolution at 5% level of precision
- Null (H0) hypothesis: Treatment of Light has no statistically significant effect on oxygen evolution at 5% level of precision
The t-test is a two-way test because of the uncertainty about the results of the experiment (Smith & Dukes, 2013). The alternate hypothesis could either be less than or greater than zero.
Reference
Smith, N. G., & Dukes, J. S. (2013). Plant respiration and photosynthesis in global‐scale models: Incorporating acclimation to temperature and CO2. Global Change Biology, 19(1), 45-63.
Appendices


