This report provides comprehensive analysis of UK collective investments, focusing in particular on unit trusts, OEICS and investment trusts. Insight is also given into the prominent issues affecting these investments as well as the latest regulatory developments; all of which will prove essential towards understanding the current shape of the market and how this profile may change going forward. The IPD Directories are produced by the Fund Service Team within IPD. The main objective of this team is to enhance transparency of the property investment funds market. The property investment funds universe encompasses stock market listed funds, especially in Asia as well as unlisted funds.
Studies of money manager performance are the bottom line test of market efficiency. They do not claim to uncover specific types of market failure as do the ‘anomalies’ literature of the 1980s and the behavioral finance literature of today. Rather, money manager studies ask whether there are market failures, regardless of type, that are systematically exploitable. In our opinion, the conclusion of the literature to date is a resounding ‘No’.
Data
This study examines all UK equity unit trusts (UTs) from the Micropal (now S&P Micropal) database that existed any time between 1978 and 1997 and were authorised for sale to the public. We include only those UTs that invest primarily in UK equities and are classified by the Association of Unit Trusts and Investment Funds (AUTIF) as Growth and Income, Growth, Equity Income or Smaller Companies. In order to qualify as ‘UK’ a UT must have at least 80 per cent of its investments in the UK. AUTIF defines the four equity-only sectors as follows (Unit Trust Yearbooks, 1992-1997):
- Growth and Income: to produce a combination of both growth and income with a dividend yield of between 80 and 100 per cent of the yield of the FTA All Share Index.
- Growth: to produce capital growth.
- Equity Income: to produce a dividend yield in excess of 110 per cent of the yield of the FTA All Share Index;
- Smaller Companies: to invest at least 80 per cent of their assets in those companies that forms the Extended Hoare Govett Smaller Companies Index. The Hoare Govett Smaller Companies Index (HGSC) contains the smallest tenth by market capitalisation of the main UK equity market. The Extended HGSC also includes stocks quoted on the Unlisted Securities Market, which fall within the HGSC’s market capitalization limit.
Highlights
Retail assets held in collective investment vehicles have shown a compound annual growth rate of close to 20% for the past five years, which is more than double the rate of other retail S&I products. Among collective investments, unit trusts and OEICs continue to be the dominant products in terms of funds under management, largely due to their open-ended nature, which is preferred by consumers over closed-ended investment trusts. Following the decline in investment trust balances as a result of the equity market downturn in 2002, the investment trust market has now recovered and both non-retail and retail sectors are growing at a steady pace. However, they continue to make up a very small proportion of retail savings & investments balances in the UK.
We exclude unauthorized UTs because we have insufficient information to determine their investment objectives. We also exclude all international, sector specialists, balanced and fixed income UTs. Authorized UTs are approved—authorized—for sale to the public, while unauthorized UTs are not. Micropal advises us that their dividend data on dead UTs prior to 1978 are incomplete. Because we want to work with total returns, which naturally include dividends, we commenced our sample period in January 1978.
Overall, we have data for 473 UTs which were still alive at the end of 1997 and 279 UTs which existed for some period between January 1978 and December 1997 but were not alive in January 1998. At year-end 1997, the aggregate value of the UK equity unit trusts we study was about £163 billion and the entire domestic UK equity market was about £1.3 trillion. By comparison, at year-end 1997 US domestic equity mutual funds had an aggregate value of £973 billion and the entire US equity market was £6.0 trillion.
Sample and Methodology
Firms are deleted from the FTSE 100 due to events like mergers and takeover. These firms were deleted from the study. The process of including firms into, and deleting firms from the FTSE 100 by Steering Committee started in 1984. The sample consists of all those firms that have been deleted from or included in the FTSE-100 from March 1984 to September 2000. Over this period re-compositions totalled 439. Firms were deleted if they had interim or final earnings announcements during the test period to exclude confounding events. The final sample comprised 162 additions to the FTSE 100 and 160 deletions.
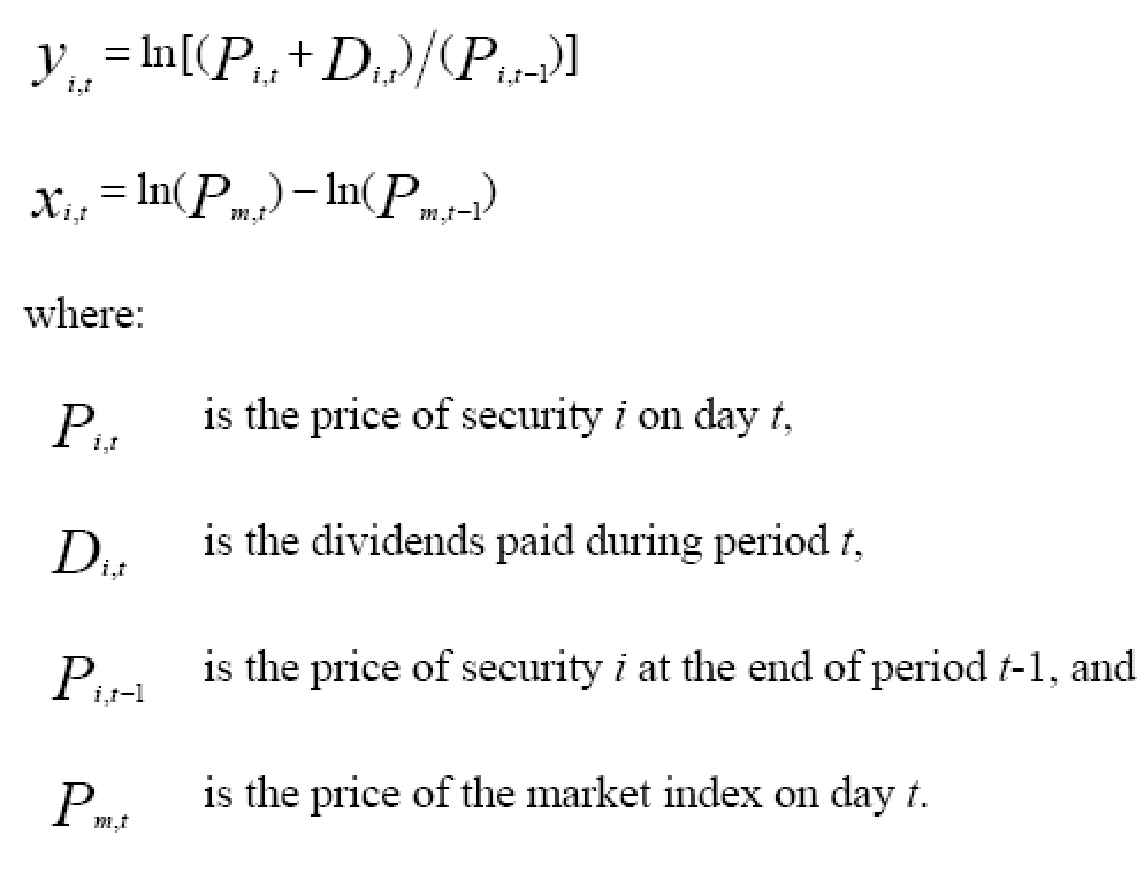
The addition (deletions) dates and share price data were obtained from the Primark/Datastream. Initially, the ZD test reported in Hamill, Opong & McGregor (2002) is used to compute the significance of mean and cumulative abnormal returns. It uses the market model as the benchmark. It has the advantage of being capable of accounting for multiple mis-specification of the market, providing robust variance estimates when calculating the significance of Cumulative Abnormal Returns (CARs). The FT All Share Index is the market proxy. The estimation period returns are calculated from day -22 to -150 with day 0 entry into the index. Daily logarithmic returns were calculated using:
We have the single-index market model written in vector form as:
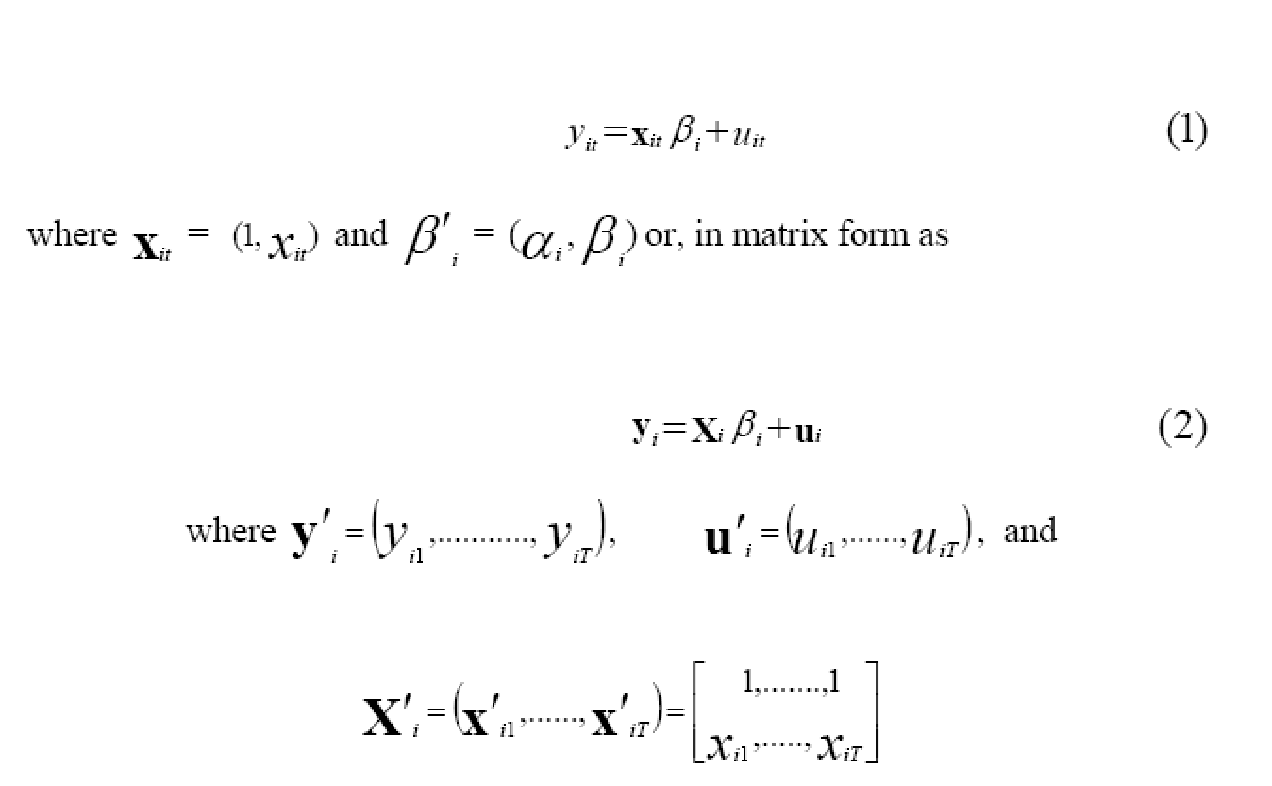

Estimated parameters. The cumulative sum of forecast errors over the event window (T+m1, T+m2) is:

Where ‘C’ is an appropriately designed 1 × n selection vector which has the elements taking the value unity if Uit is contained in the event window and zero if it is not. The covariance matrix is given by:


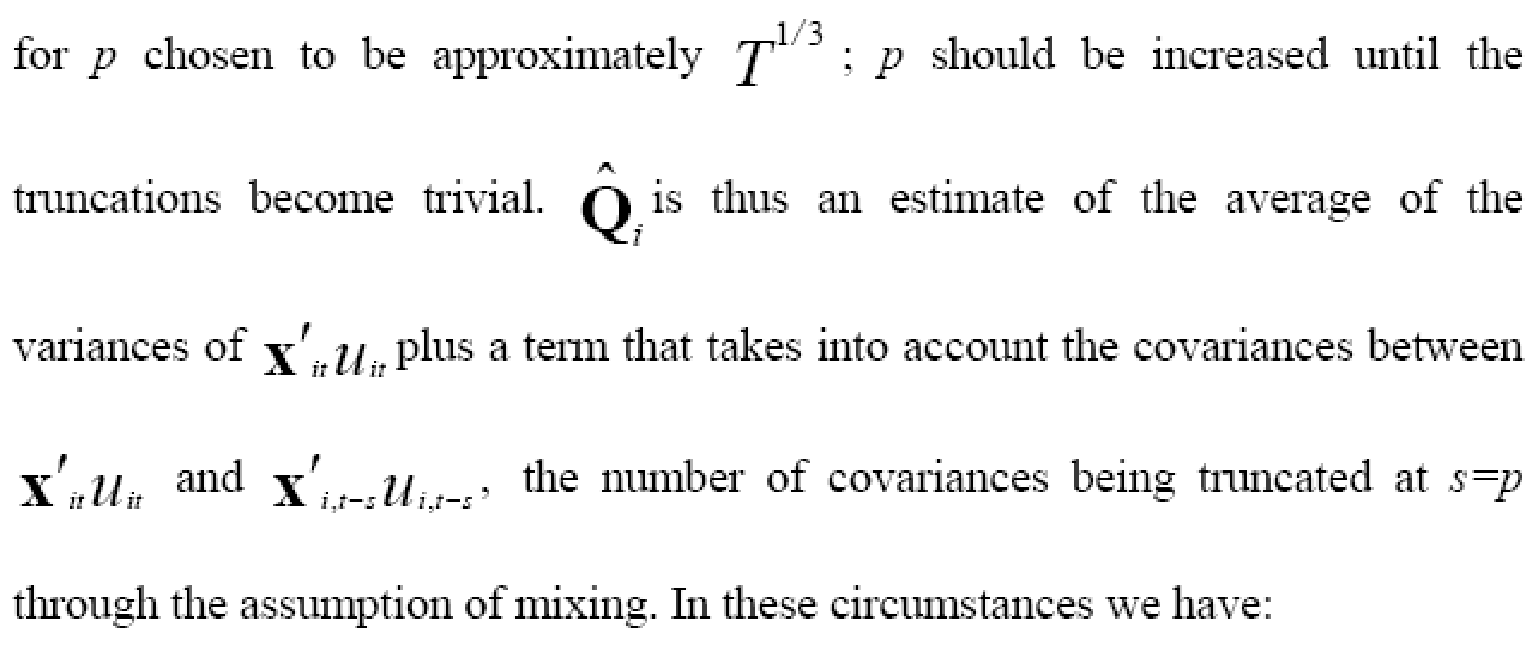


The selection vector in equation 4 can be adjusted to compute the significance of mean and cumulative abnormal returns. The (O, 1) and (0, beta) benchmarks are also employed. Rubac’s (1982) standard error estimate is used to test the significance of mean and cumulative abnormal returns for these benchmarks.
References
Philip A. Hamill, Peter G. Dunne, Kwaku K. Opongc, “FTSE 100 Index revisions: Asymmetric price response?”. Web.
‘Uk Collective Investments 2007’, Datamonitor, 2007. Web.
Garrett Quigley and Rex A. Sinquefield, 2000, “Performance of UK Equity Unit Trusts”. Web.