Introduction
Efficient frontier is regarded as one of the most reliable and all round analysis tools for describing the economic and stock position of a company. Additionally, this tool is supplemented by Capital Market Line analysis, as well as Security Market Line, that offer the full representation on the matters of investment portfolio of any particular company.
Therefore, the aim of the paper is to analyze the stock market data for the recent five years of IBM and 3M Companies, and compare their efficient frontier graphs. This will be helpful for the effective assessment of the investment portfolio of these two companies, and creating the reliable basis for investment forecast and analysis
Efficient Frontier
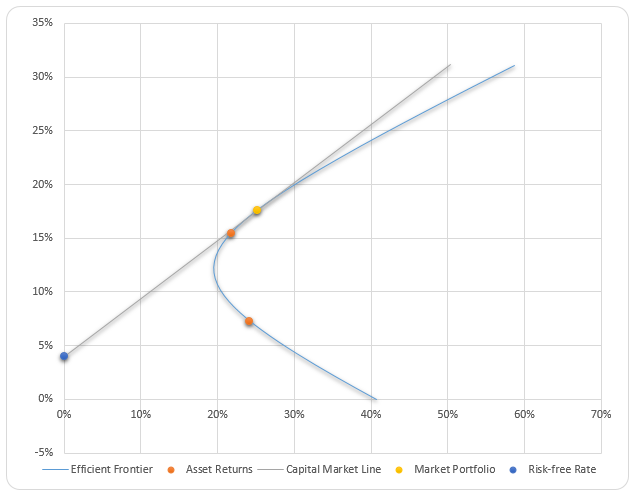
The graphs represent the standard deviation of the assets, as well as the curve of the capital market line for comparing the stock indicators of the company with the general stock situation. The efficient frontier curve defines the best possible asset level, considering the risk levels defined on the stock market.
Considering the market portfolio parameters of both companies, the risks will be diversified depending on the specific extents of the portfolio possible. Therefore, all the possible systematic risks of the analysis and returns will be associated with the standard deviation positions of each stock. (Cleary and MacKinnon, 2010)
The risk free rate is defined in accordance with the return logs of each company, and the key values of the portfolio weight rates represent the market variance levels that are associated with the return rates, as well as the market portfolio parameters.

It is generally stated that efficient portfolios are characterized with the lowest variance level of its aggregate returns, as well as the risks for the analyzed return rates. In general, it is stated that the risk and return rates are mutually dependent, and it is generally considered that the increased returns are possible only if a company mitigates stock risks. As it is stated by Hess and Liang (2010, p. 61): “the two parameters are closely interconnected and targeting a specific return, hence the company needs to manage the regarded risks”.
In the light if this statement, it should be emphasized that if a company targets the high return rates, it will have to manage essential risks. The analyzed portfolio involves 4% risk, however, thee expected return rates are high enough, and it should be emphasized that this is explained by the high mean rate of both companies. The risk free rate associated with the investment return is regarded as the best rate for avoiding risks, and this rate in the given portfolio is 4%.
In accordance with the modern portfolio theory, the efficient frontier rates are achieved by proper calculation of the risk scenarios with probability-weighted average return considering possible risk scenarios. Therefore, in accordance with the research by Cooper and Edgett (2008, p. 43), the following statement should be emphasized:
It is beyond the scope of this short post to explain the underlying math. We will simply point out that it is the existence of correlation between individual financial assets (e.g., stocks) that allows us to combine them into portfolios yielding a higher return for the same amount of risk. Therefore, Any such allocation is deemed to be an efficient portfolio, in the sense that it is impossible to achieve a greater return without taking on more risk.
Hence, the collection of the portfolio data for efficient frontier is performed on the basis of the current and forecasted risks.
CML and SML
Considering the expected return per each share, it should be stated that the actual values of the dividend yield of both companies involves the essential values of risk. Therefore, these values are 0.65/1.59 for IBM and 0.55/2.39 for 3M. Therefore, the expected returns for 3M are higher, and CML values of this company involves the assessment of the traditional risk values, and comparison of the expected return rates.
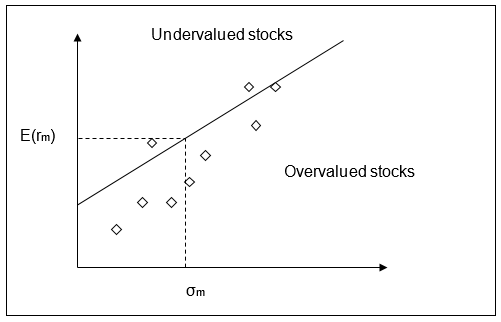
The IBM CML and SML values are given on Figure 1. In accordance with the values of these parameters, it should be emphasized that the actual value of the IBM stocks may be explained by the Efficient Market Hypothesis.

Considering the statement by Murphy (2009), the EMH principles, applied to the values given above, emphasize that market can not be beaten, however, some particular risks associated with the expected returns stay relevant. In accordance with the theoretic background of this hypothesis, the market position of IBM is featured with serial dependencies of the assets and returns. However, there is no clear algorithmization of the price construction.
The 3M CML and SML values are given on figure 2. In comparison with the IBM values, the 3M positions on the market seem more stable and reliable. However, in accordance with the previously mentioned EMH, it should be stated that the position of 3M shares is more stable, and risks are less evident. However, the amount of undervalued stocks in the levered risks section of the graph indicates the opportunity of unstable growth. (Hess and Liang, 2010)

MVS and CAPM
In accordance with the values of MVS parameters, it should be emphasized that both companies are featured with sufficient risks, however, while the risks of IBM Corp are more dangerous for investment, these shares offer more stable growth after failures. 3M shares offer larger returns, and the risk assessment rate is lower, however, the growth tendencies are less stable. Therefore, Conover, Friday and Howton (2008, p. 107) emphasized the following statement:
In a closely related approach it is stressed that the need for tools allowing for geometric representations of these MVS portfolio frontiers, is related with CAPM parameters. Indeed, an investor can only develop a clear idea about the position of certain MVS efficient portfolios and their relative desirability when he/she can see these efficient points in a three dimensional MVS space.
In the light of this statement, the investors may only assess the asset based risks, while the visualized portfolio frontier analysis is the reliable tool for defining these risks. Consequently, the MVS portfolio frontier of both companies is featured with the shortage of risk-free assets that may be used as the advantage on the unstable stock market.
Conclusion
The analysis of IBM and 3M share market positions helped to reveal the key risks and parameters of the investment portfolio. Therefore, IBM portfolio is featured with greater risks, lower asset returns, however, the growth parameters are more stable, while 3M portfolio is less stable, and is regarded as less reliable for long-term investment. This is explained by the low risk levels, as well as the low expected returns for the portfolio which originates from low risk rates.
Reference List
Cleary, S., & MacKinnon, G. 2010. The Investment Nature of Income Trusts and Their Role in Diversified Portfolios. Canadian Journal of Administrative Sciences, 24(4), 314.
Conover, C. M., Friday, H. S., & Howton, S. 2008. The Relationship between Size and Return for Foreign Real Estate Investments. Journal of Real Estate Portfolio Management, 4(2), 107.
Cooper, R. G., Edgett, S. J., & Kleinschmidt, E. J. 2008. Portfolio Management for New Products. Cambridge, MA: Perseus Publishing.
Hess, R., & Liang, Y. 2010. Some Structural Attributes of Institutional Office Investments. Journal of Real Estate Portfolio Management, 9(1), 59.
Murphy, A. 2009. Scientific Investment Analysis (2nd ed.). Westport, CT: Quorum Books.