Introduction
Real effective exchange rate (REER) is a measure of value of a country’s currency in relation to other major world currencies in the index aimed at countering effects of inflation. Such currencies include euro, US dollar and others. The measure is obtained by looking at the trade balance which is the difference between a country’s imports and exports in comparison with currencies of other countries in the same index.
In the world markets, there usually exist a relationship between the real effective exchange rates and various microeconomic variables such as consumer price index (CPI), unemployment rate, money supply and interest rate. In this paper UK and USA have been considered as the study areas between the years 2000 and 2010.
Real effective exchange rate, CPI, Interest Rates, Money supply, Unemployment in US
Just like in other countries, US have been experiencing changes in the economic variables such as the real effective exchange rates, consumer price index, interest rates, money supply and the unemployment rates.
Generally, these factors have been affected by changes in global economic trends that have also facilitated the government to effect monetary and fiscal policies to mitigate adverse effects. The monetary policy has been regulated by changes in interest rates, devaluation of currencies and regulation in money supply.
CPI and Unemployment rates
The US economy has had an increasing inflation rates and unemployment rates, 4.0 and 3.4 per cent respectively in year 2000 (Econedlink). This was because the economy was recovering from a serious inflation that had affected the economy towards the end of 1999. The inflation decreased slightly in 2001 to 2.8 as the prices of commodities stabilized (Econedlink).
However, the unemployment rate remained high at 4.3 per cent due to lack of enough employment opportunities. The CPI continued to decrease till 2004, as the unemployment rates increased to 5.8 per cent in the same year. Thereafter, the inflation rates increased slightly to 3.4 per cent and unemployment rates decreased slightly to 5.8 per cent (Econedlink).
The two variables remained slightly stable, until in 2009 when the world experienced financial crisis. The CPI was at its lowest point at -0.4 per cent while the unemployment rate recorded the highest figure of 9.3 per cent (Econedlink). This scenario coincides with Cencini who illustrates that an inverse correlation exists between inflation and unemployment (41).
He further adds that an increase in inflation as depicted by increase in CPI causes reduction in the economic performances that forces employees to be sent home. Sauert asserts that CPI is often included in the interest rates changes and therefore only the unexpected change affect prices (7). During the 2008-2010 financial crises, many employees were rendered jobless thus increasing the number of the unemployed in the country.
Money supply, real exchange rate and interest rates
As the business cycle changed, the Federal Reserve changed the monetary policy to suite the prevailing economic condition. When the country experiences inflation, the Federal Reserve strives to reduce the amount of money in circulation by increasing exchange rates and vice versa.
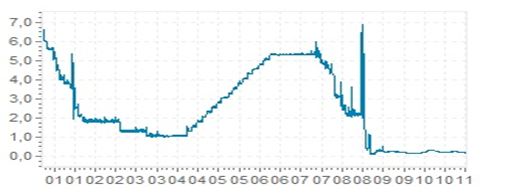
Despite the several business inflation that has been experienced in the last one decade the US REEL has remind relatively stable compared to other major currencies. According to the global rates report, the US interest rates were decreasing from 2000 to 2004 where the rates decreased from 7 per cent to 1 per cent in year 2004.
This drastic reduction was employed to encourage borrowing by the general public in an attempt to overturn economic slump that was experienced during this time. The interest then increased steadily to 5 per cent in 2005 and 2006. This monetary measure was meant to reduce the amount of money that was in circulation.
The large amount of money in circulation caused the consumer price index to go high due to large amount of money that was chasing few goods in the market. Sauret contends that increase in money stock increases chances of inflation in the future (6). Later the economic trend experienced sharp decrease to the current rate of less than 1 per cent as shown in the graph below which was extracted from the global-rates.
A graph showing interest rates

Global-Rates. US dollar rates 2000. Web.
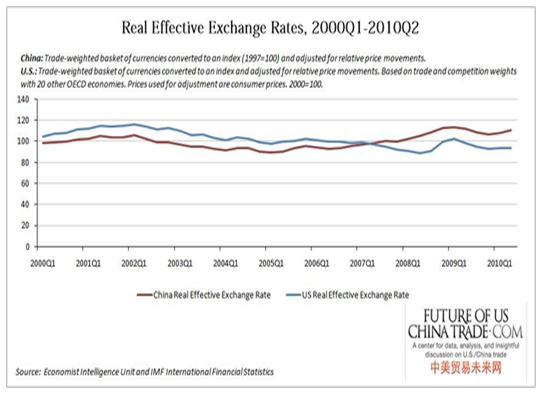
Despite the many economic turns that have been experienced, the economy has experienced a stable REER over the years as shown by the graph below. The stable REEL has been influenced by a stable strength of the dollar that has been prevailing over the period. The stable value of the dollar has also been attributed to favorable terms of trade that has been experienced by the US.
This report also reveals that stability in real effective exchange rate has helped the country to achieve better economic performances. To many economists, stable PEER shows that the economy is performing better compared to other competing economies.
In addition it is also right to suggest that the US economy to a great extent managed to deal with inflation and hence managing to contain the value of the dollar. This information is shown by the graph below.

Future of US China trade.com. Real effective exchange rates, U.S. and China 1993-2010. Web.
Real effective exchange rate, CPI, Interest Rates, Money supply, Unemployment in UK
Although UK is known for its strong economy that is reflected by the strong value of its currency (Sterling Pound), the economy has had its fair share of economic challenges. From 2000 to 2010 the UK economy has been affected by variations in economic variables such the REEL, increased CPI and Interest rates which have resulted to an increase in unemployment rates.
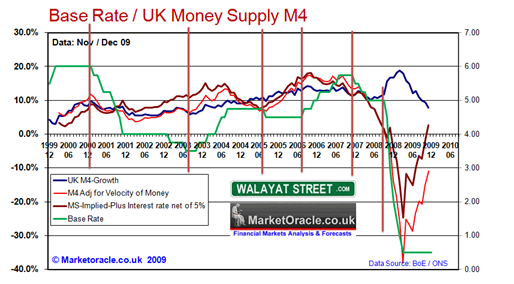
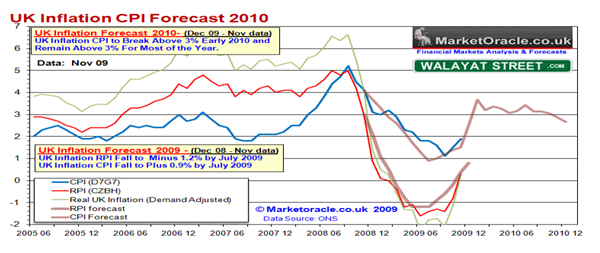
Walayat (2010) asserts that these economic variables have been greatly affected by economic cycles such as depression and financial crisis that has been prevalent over the period. The graph below show how various economic variable changes in this period.
The graph below shows money supply varied in the period 2009.

Global-Rates. US dollar rates 2000. Web.
Interest Rates
The UK interest rates were strongly affected by the Credit crisis especially during the 2007-2009, during this period, the UK economy recorded the lowest ever level of interset rates (Walayat).
The trend reveal that the growth in the Interest rates have been decreasing between 2000 to 2003 where the rates changed from 6 % to 4.0 and 3.8 per cent respectively, later the interest rates started increasing steadily till the end of 2008 where interest rates were at a peak of 6 per cent.
Thereafter, the interest rates dropped drastically to 0.5 percent in 2010 (Walayat). Sauert explains that CPI is usually incorporated in the interest rates and therefore change in interset rates also affects the prices of commodities (93).
A decrease in interest rates was accompanied by an increase unemployment rates. As the interest rates dropped, the CPI increased, this reveals that the economy was not performing well and the government strived to boost economic performance by lowering interest rates. This was only possible by employing monitary policies that included economic injections.
The government strived to increase money supply in order to allow public borrowing. This trend was experienced from 2000 to 2003, as the UK’s economy performances stabilized the real effective exchange rate was increasing as the value of pound increased steadily compared to other major currencies.
The trend in economic performance reveals that the UK government does not react in time to changes in interest rates (Walayat). It is evident that when the inflation is at the peak, the interest rate remains in the opposite direction. For instance, since economic forecast reveals the inflation has come to an end, the Bank of England is anticipated to continue raising interest rates to meet this trend.

Global-Rates. US dollar rates 2000. Web.
Fisher reveals that UK’s CPI has generally been increasing from 2000 to 2010; however, the first three years experienced an intermittent trend of increase and decrease (2). The CPI index for 2000 to 2006 was below six percent but poor economic growth resulted to an increase in the CPI beyond the 2 percent mark.
Since CPI measures the changes in the consumer price index, the UK economy was facing a problem in dealing with escalating inflation rate. Since the cost of production was high, firms and other organizations sacked some employees to cut down on the escalating costs. Thus the unemployment level increased steadily, CPI and unemployment moves in the opposite direction (Arnold 128).
Bootle (7) reveals that the UK exchange rate has remained high over the stipulated time frame, the sterling pound value increased steadily from 2000 to 2004 whereas; the exchange rate remained high thereafter.
The stability in REEL was attributed to the steady foreign exchange conducted by the UK and its economic partners. However, the emergency of financial crisis in 2008-2010 has adversely affected the stability due to the changes in the strengths of other currencies (Fisher 8).
The UK economy has been shaken by the recessionary trend that has resulted to various actions that have been taken by the government and other economic institutions. Fisher reports that most firms in UK have strived to retain employees rather than fire them despite the tough economic trend prevailing (4).
However, most firms have opted to reduce wage rates and working hours as an attempt to cope with inflation, simply because of the few number of people were getting employed as compared to the those losing their jobs, the unemployment rate was steadily increasing.
Agenor (2004) although inflation (CPI) and unemployment rate work in different direction, hyper inflation usually forces unemployment and the CPI to move in the same direction in a situation called inflation trap (215). This has been the situation with the UK economy, whereby it has been experiencing high CPI and high unemployment rates during this period (Bottle 22).
Conclusion
In both countries the business cycles have affected the entire economic variables that were in consideration. The main thing that has triggered the variation in these economic variables is inflation and global financial crisis. The most notable one is the economic crisis of 2008-2010 that resulted to high inflation rates that was also accompanied by high unemployment rates.
Occurrences of this economic turn prompt the Federal Reserve and the Bank of England to alter the money supply in the countries. On the other hand PEER is mainly affected by the balance of trade and the financial markets.
Works Cited
Agenor, Pierre-Richard. The economics of adjustment and growth. San Juan, Unitedn States La Editorial, UPR: 2004. Print.
Arnold, Roger. Macroeconomics. San Franscisco: Cengage Learning, 2007. Print.
Bootle, Roger. The economic and financial outlook. Web.
Cencini, Alvaro. Inflation and unemployment: contributions to a new macroeconomic. London: Routledge, 1996. Print.
Econedlink. Focus on Economic Data. Web.
Fisher, Paul, Why is CPI inflation so high? Liverpool: Bank of England. Web.
Future of US China trade.com. Real effective exchange rates, U.S. and China 1993-2010. Web.
Global-Rates. US dollar rates 2000. Web.
Sauret, Dennis. Do macroeconomic variables have an effect on the US stock market? Norderstedt: Grin, 2002. Print.
Walayat, Nadeem. UK Interest Rate Forecast 2010 and 2011. Web.