Introduction
According to Central Intelligence Agency or CIA (2015a; 2015b), both Norway and the United Arab Emirates (UAE) are countries that heavily rely on oil and gas sector of their economies. Natural oil resources have given both countries an impetus towards fast development and, as a result, their economic indices appear to be among the highest.
In this paper, the economic factors of the two countries are analyzed, and their policies are described; some assumptions about their future development are presented, and a conclusion about their diversification decision is made.
Microeconomics
Microeconomics is the part of the economics devoted to the individual sectors and companies within a country’s economy. We shall provide a short overview of the factors that are relevant for the countries’ economy and certain economic factors. A more holistic view of the economies will be presented in the next part of the paper (Gottheil 2013).
The UAE is a union of the emirates of Abu Zaby (Abu Dhabi), ‘Ajman, Al Fujayrah, Ash Shariqah (Sharjah), Dubayy (Dubai), Ra’s al Khaymah, Umm al Qaywayn; the state was created in 1971 with the capital in Abu Dhabi (CIA 2015a, para. 2). UAE purposefully avoided the “Arab Spring”.
The country is the third-largest OPEC producer, but the country has been attempting to reduce its dependence on the oil resources quite successfully (Carpenter & Khan 2015). The area of UAE includes only land 83,600 km2 with 4.6% of the land involved in agriculture.
The labour force of the country amounts to 4.891 million people, and 78% of it is employed in the services sector. The population of UAE is a peculiar resource. 70% of the UAE population is concentrated in Abu Dhabi and Dubai; 16% are in Sharjah (UAE NQA 2013, p. 3-4). What is more important, no more than 20% of the country’s population is Emirati. Expatriated people make up the most of the country’s workforce.
The country exports crude oil, natural gas, dried fish, dates, and reexports. Imports include machinery and transport equipment, chemicals, and food (CIA 2015a, para. 1-6). The industries of UAE include ‘petroleum and petrochemicals; fishing, aluminium, cement, fertilizers, commercial ship repair, construction materials, handicrafts, textiles’, and the industrial production growth rate is 3.5% (CIA 2015a, para. 6).
According to CIA (2015b), after a thousand years worth of unions, Norway was granted independence in 1905. In the 1960s, oil was discovered in the country’s adjacent waters which boosted its economy. Norway is a member of NATO, European Economic Area, and Organisation for Economic Co-operation and Development (OECD). The land area of Norway is 304,282 km2; water area equals 19,520 km2; 2.7% of the land is involved in agriculture.
The Norwegian economy is a mixed one, and the country is described as a prosperous one. The country’s economy is dependent on the natural resources, primarily the petroleum sector (30% of the country’s government revenue); other resources include fish, minerals, timber, and hydropower.
The countries’ industries include ‘petroleum and gas, shipping, fishing, aquaculture, food processing, shipbuilding, pulp and paper products, metals, chemicals, timber, mining, textiles’, and the industrial production growth rate is 0.8% (CIA 2015b, par. 6). The labor force equals 2.724 million, and about 77% of it is involved in the services sector while 20% are involved in the industrial sector.
The country exports ‘petroleum and petroleum products, machinery and equipment, metals, chemicals, ships, fish’ and imports ‘machinery and equipment, chemicals, metals, foodstuffs’ (CIA 2015b, par. 6). Social safety of Norway is very much emphasised.
The two countries differ significantly: they are situated in different climate zones, have been existing for different amounts of time, had had to deal with different historical events.
Norway appears to be richer in natural resources; its area is larger, and the country possesses some water area. At the same time, the UAE possesses more workforce. The industrial production growth rate is higher for UAE. A specific feature of UAE is its ethnically diverse workforce. The main similarity between the countries is their continuous reliance on the petroleum sector.
Macroeconomics
The key parameters that are most often used to “measure” the economy of a country include gross domestic product (GDP), and gross national income (GNI) (Gottheil 2013). Apart from that, the consumer price index (CPI) and unemployment rates will be demonstrated for the economies to explain their economic situation and policies.
National Income and National Accounting
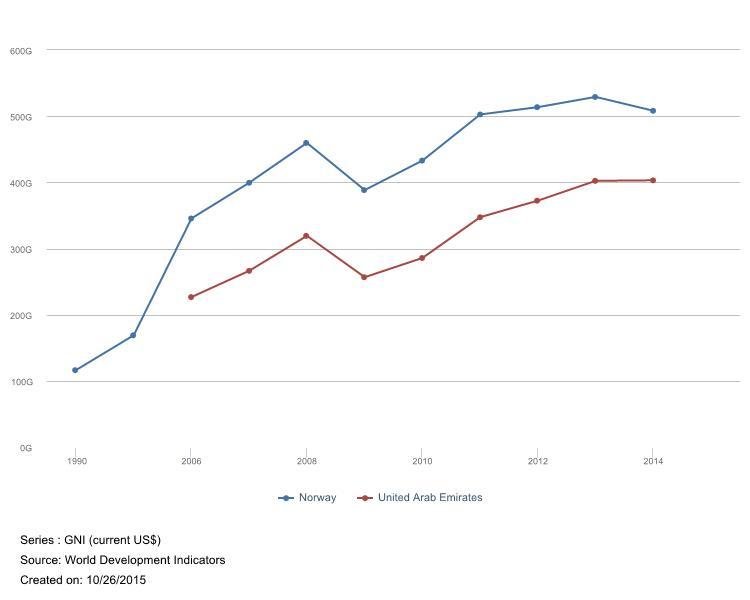
GDP measures ‘what is produced and earned in domestic economy’ or the ‘total value of all final goods and services, measured in current market prices, produced in the economy during a year’ (Gottheil 2013, pp.87, 493) Gross national income (GNI) includes GDP, but it also takes into account the income that has been gained by the migrants (the income earned from abroad by the citizens of the country and the income earned by the immigrants from the country, the latter is excluded).
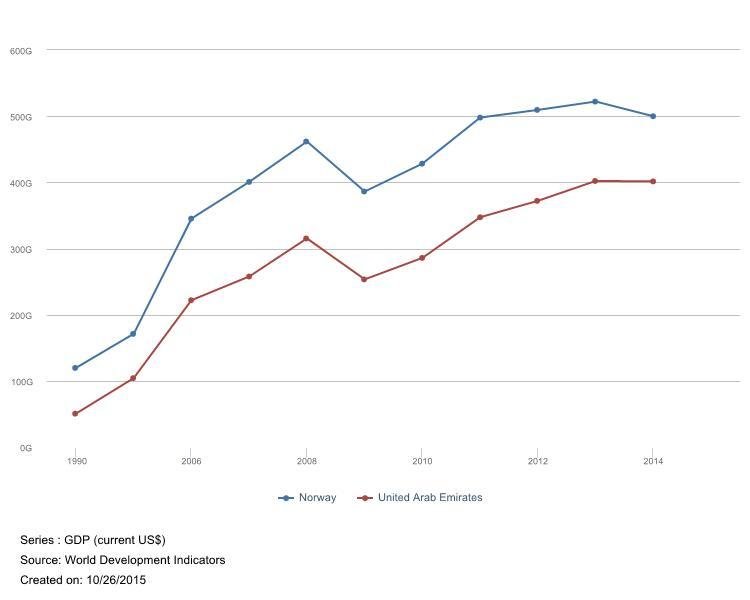
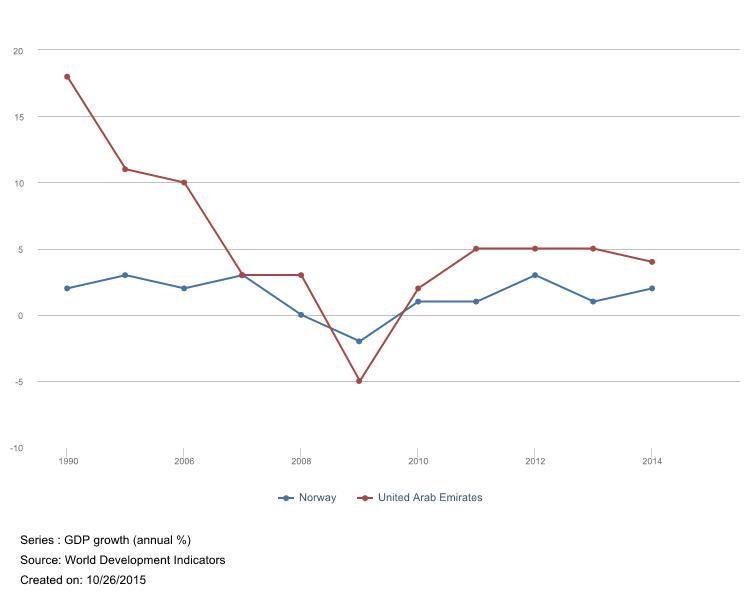
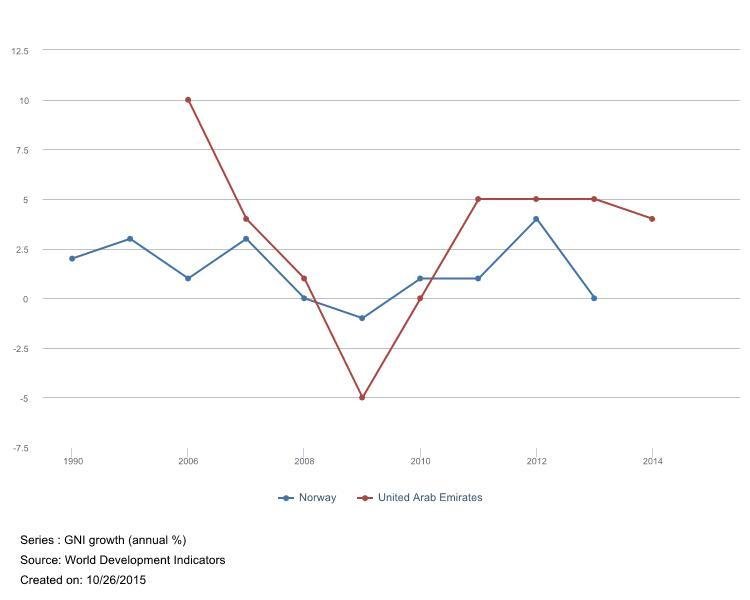
Figure 1 (World Bank 2015) demonstrates the current GDPs of the countries while Figure 2 (World Bank 2015) shows their growth rate. Figure 3 (World Bank 2015) and Figure 4 (World Bank 2015) show the current GNIs and their growth. The current account balance of the UAE is $48.45 billion, and the current account balance of Norway is $42.33 billion.
UAE GDP per capita is comparable to that of world leading economies, and Norway has been outperforming UAE for the past decades for all the mention indices. However, it is obvious that UAE growth rate used to be significantly higher than that of Norway and has only been lower during the 2009 crisis.
It is true that UAE used to rely on oil and global finance and, as a result, the impact of the crisis was rather severe for the country (CIA 2015a, par. 2). To change it, successful diversification was carried out, and the contribution of oil and gas contribution to GDP was reduced to 25% (CIA 2015a, para. 6).
The Cost of Living
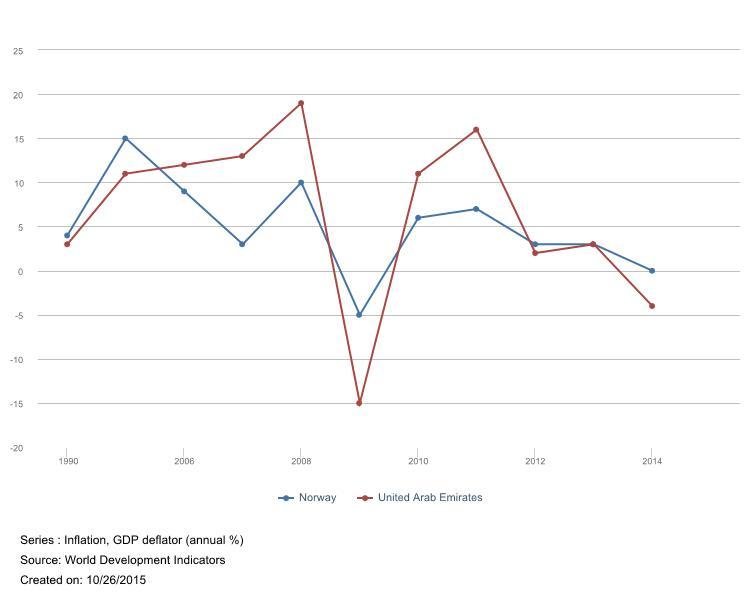
The consumer price index is ‘a measure comparing the prices of consumer goods and services that a household typically purchases to the prices of those goods and services purchased in a base year’ (p. 836). It is connected to the inflation level which is an increase in price level, or, the ‘measure of prices in one year expressed in relation to prices in a base year’ (p. 842). The inflation data is demonstrated in Figure 5 (World Bank 2015).
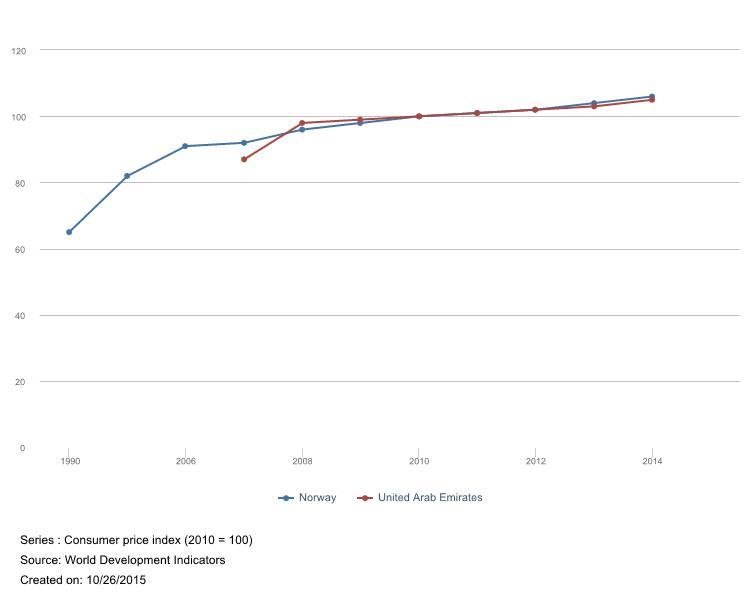
It is obvious that currently the inflation rate is falling for both countries after a significant rise that had obviously followed the crisis. Figure 6 (World Bank 2015) shows that the CPI of the two countries is practically identical and is rising slowly but steadily.
Unemployment and Relevant Measures
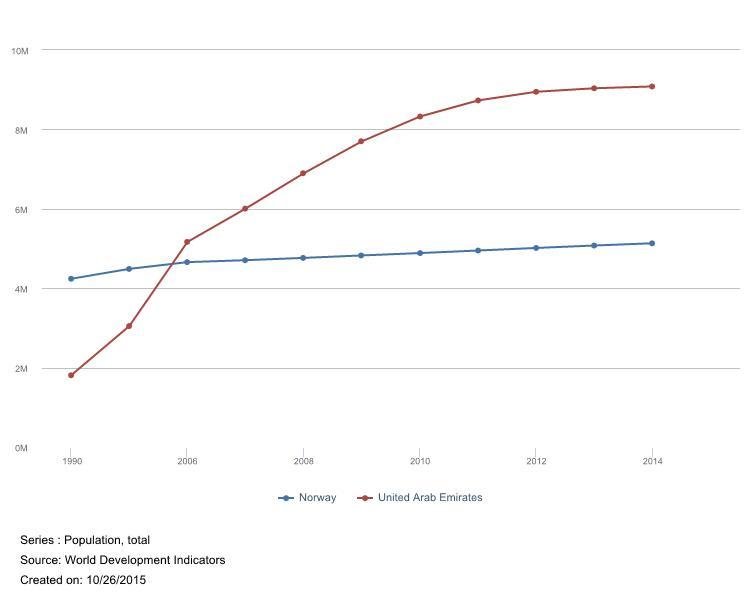
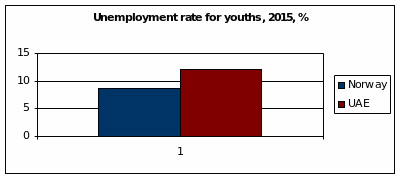
Figure 7 (World Bank 2015) demonstrates the population of the two countries; Figure 8 shows the data from CIA (2015a; 2015b) concerning the unemployment rate for young people. According to CIA (2015b), the population of Norway is 94.4% Norwegian and, as of 2012, amounts to 5,207,689 with the growth rate of 1.13% and birth rate of 12.14 births per 1,000 people. Migration rate is more than seven migrants per thousand; the ranking of the country in this respect is 16.
The current total youth unemployment rate is 8.6%. According to OECD (2015b), the main difficulty concerning the employment in Norway is the steady increase of long-term unemployment (28% in 2012); still, the figure is lower than the average among OECD countries (36%). According to OECD (2015a), the social spending of Norway amounts to 22% of GDP. The poverty rate in Norway is rather low for the members of the group, equalling 0,08% in the same age group (OECD 2015a, para. 12).
As of 2015, the birth rate in UAE is 15.43 births per 1,000 people with the population growth rate at 2.58%. The growth of the population was in many ways conditioned by the expatriates; the Emirati is 19% of the country’s population, the rest being of South Asian, Arab and Iranian, and other origin (UAE National Qualifications Authority [UAE NQA] 2013, p. 3; CIA 2015a, para. 4). Total unemployment for the youth of the UAE amounts to 12.1% (CIA 2015a, para. 4).
The countries’ indices performance can be described as very satisfactory. One could also say that the UAE growth indices appear rather promising. Still, it is noticeable that the development is slowing down for both countries which can be attributed to the changes in the world economy, for example, the oil prices fluctuations.
Macroeconomic Policy Choices
The key economic policy choice of UAE is the motion towards the diversification of the economy (Rahman 2015). Norway has been acknowledging the importance of diversification as well (CIA 2015b). Apart from that, Norway seems to be especially concerned with innovation and social protection policies (OECD 2015a).
This fact appears to demonstrate the desire of Norway to invest in the most valuable resources: its people and future technology. UAE is similarly interested in addressing its population issues, particularly the problems of unemployment and the difficulties connected to the unusually high percentage of immigrates and expatriate labour force.
Managing diversity in such a context is an unusual and challenging issue. Apart from that, UAE is obviously aimed at growth, and the high rates of GDP growth demonstrate that the country is being successful in this respect.
The forecast of the future economic development of UAE is determined by two factors: the positive one, Expo 2020 being held in Dubai, and the negative one, the fluctuations of the oil prices.
Expo 2020
Winning the right to hold the EXPO 2020 in Dubai is important for UAE from the cultural, economic, and political perspectives (Levick 2015). From the point of view of the economy, it should be pointed out that preparing for Expo demands labour force which means that more than 277,000 jobs are expected to be created in the period between 2013 and 2021 (Churchill 2013, para. 1).
The tourism sector is expected to experience the biggest impact of the event; similarly, other sectors like building, telecommunication, IT, and transportation have the chances of being positively affected (Churchill 2013). Apart from that, talent, which is a less measurable but still very valuable resource, is being attracted to UAE. All of these factors are bound to have a positive impact on UAE economic development.
Oil Prices
As a result of increased US oil production and the general slowdown of the economy, the oil prices have decreased significantly. The resulting oil price of $50 per barrel is admittedly a challenge for the world economy and, in particular, for UAE (Rahman 2015). The low oil prices affect the stock market of UAE as well as those of other oil-exporting countries (Hanware 2015).
According to the Economy Minister of UAE, the country has managed to “make up” for the oil price fluctuations with the help of previously established international funds. He also points out that the oil price situation highlights the importance of the country’s diversification processes (Rahman 2015, para. 5). The fuel prices in UAE are currently subsidised, but it appears that the government has decided to change it, claiming that it is unreasonable for a rich country (Carpenter & Khan 2015).
Aggregate Supply and Demand
Aggregate supply is the ‘total supply of goods and services that all firms in the national economy are willing to offer at varying price levels’, while aggregate demand is the total ‘quantity demanded of these goods and services by households, firms, foreigners, and government at the varying price levels’ (Gottheil 2013, p. 468).
The aggregate demand curve is downward-sloping: as the prices increase, the demand declines. For aggregate supply, the curve is different: at first, the increase in prices does not affect it while corresponding to the growing GDP; then supply starts to grow while at a certain point the GDP stops increasing.
Aggregate demand changes with the fluctuations in demand that can be caused by ‘changes in government spending, foreign incomes, and consumer or firms’ expectations about the future’ (Gottheil 2013, p. 471). As the demand increases, its curve shifts to the right, with the decrease it shifts to the left. For aggregate supply the shift is similar; it changes depending on the availability of resources (Gottheil 2013, pp. 471-473). Let us attempt to apply this information to the current situation in the UAE market.
Aggregate Supply and Demand: Oil Prices and Expo
The Expo is likely to increase (or to have increased already) the aggregate demand in UAE; the result of that is the shift of the curve to the right and the rise in prices.
At the same time, with the oil prices decreasing, the market players are bound to experience doubts in the future development of the economy. Such nervous excitement may affect the demand in a negative way. Given the fact that Expo has been influencing the demand for two years while the oil prices have been an issue for a year only, the situation may be still heading towards balance.
At the same time, it should be pointed out that the Expo could result (and probably has resulted) in the increase of supply. As more resources were demanded, more resources have been supplied; apart from that, the participation of foreign partners is, technically, a specific feature of an Expo (Levick 2015). The aggregate supply and demand for UAE are most certainly destabilised right at the moment. The future of the country is uncertain, although the prognosis is most certainly positive.
Forecast
In general, as suggested by The Economist Intelligence (EI) Unit Limited (2015), the GDP growth of UAE is to amount to around 3.6% in the next four years and is going to be “softened “ by the oil prices falling (par. 1).
Economic diversification will be further encouraged since the validity of this policy has been proven by the current situation. According to The Economist Intelligence Unit Limited (2015), the business environment in UAE will improve in the next four years as a result of the ‘improvement in infrastructure and more open trade and investment policies’ (par. 5).
As for Norway, the diversification of the country, as well as its generally high performance with respect to various economic parameters, allows one to suggest that the country is going to manage the current oil prices situation. Still, given the fact that Norway does rely on the petroleum sector rather heavily, it is bound to experience the drawbacks of the oil prices fluctuations. Its performance may slow down, but it is believable that despite this the country will continue its social and innovation policies.
The Education Sector
According to OECD (2013), the public education in Norway is free (except for the pre-kindergarten classes), while both public and private institutions gain funding from public sources; tertiary institutions are autonomous in allocating them. In 2010, 84% of students attained secondary education, and 47% chose to proceed with tertiary education; both figures are slightly higher than the average for OECD. The school students’ performance is ‘higher-than-average’ in OECD countries, and it keeps increasing (OECD 2013, p. 5).
The gender performance gap is in favour of girls. Norway attempts to provide students with equal opportunities, which has been reflected, for example, in the kindergarten reform of 2004 that was aimed at making the kindergartens more accessible. Still, immigrant students tend to have worse performance. For the sake of equality, free higher education is also provided in Norway; adult learning is being encouraged through programs like “Programme for Basic Competence in Working Life” (OECD 2013, p. 6).
The educational policy of UAE includes the idea of equal opportunities and demands incorporating learning, critical thinking, and practical abilities in the curricula. The aim of UAE educational policies incorporates increasing the rate of university enrolments as well as decreasing the number of school dropouts. The country’s educational system presupposes 12 years of compulsory education (primary and secondary education).
Post-secondary education includes a number of prestigious institutions from al over the world (for example, Sorbonne or New York University). In 2009, 28% of the budget had been spent on education sector (UAE National Qualifications Authority 2013, p. 7). The UAE has been acting in consistency with UNESCO’s ‘Education for all’ which presupposes providing equal primary education opportunities for children regardless of their gender as well as increasing the quality of education and reducing illiteracy level among adults.
Dubai and Abu Dhabi have participated in international literacy tests in 2009 and 2010, and the performance of the students was below international standards. Higher education participation in UAE has increased and, in 2008, amounted to 25%. The rate of education sector development of UAE is most impressive (UAE National Qualifications Authority 2013, pp. 1-13).
While Norway appears to outperform UAE in the field of education, the rates of the development of this sector in the latter country allow one to suggest that the situation will be improved in the near future. Both countries realise the importance of the continuous development in the sector and attempt to make education as accessible as possible.
Tourism
According to World Travel and Tourism Council [WTTC] (2014), the ‘total contribution’ of Travel and Tourism (TT) into a country’s economy is higher than the spending on the tourism service since, in effect, it includes the ‘hotels, airlines, airports, travel agents and leisure and recreation services’ spending (p. 2).
In 2013, TT sector was accountable for 8.4% of UAE GDP (total contribution), and its significance is expected to rise. In 2013, direct workforce involvement in TT amounted to 291,500 jobs (5.3% of employment), and this figure is also expected to increase.
The investment in TT amounted to 6.2% of total investment, and visitor exports (the spending of the tourists within the country, education sector excluded) equalled 5.8% of the total UAE exports. Leisure tourism predominates for UAE, amounting to almost 75% of the tourism sector (WTTC 2014, pp. 1-15). It should be pointed out that as a result of Expo 2020 being held in UAE, the tourism sector is bound to develop at a higher rate in the following several years.
In Norway, in 2009, TT contribution to GPD equalled 3.3 %; the employment in the sector amounted to 6.3% of the total country’s employment. In 2010, tourists spent 106 billion (in the local currency) in Norway. In 2009, there were almost 14 000 firms in TT sector in Norway, most of them small ones with 1-10 employees.
Leisure TT appears to dominate in Norway as well (OECD 2012, p. 253). The policy of TT in Norway is aimed at increasing wealth creation within the industry; this is expected to be achieved through innovation and employees training as well as collaboration on every level. Norway is described as “sustainable destination”, that is, the industry also needs to be economically and environmentally sustainable (OECD 2012, p. 255).
It can be concluded that neither of the countries relies on the tourism sector. Still, it does contribute to both countries’ GPD, and they endeavour to proceed developing it. It appears that for UAE, the tourism sector is more significant; apart from that, it is going to be further developed as a result of Expo being held in the country. This can be regarded as another successful attempt at diversifying the country’s economy.
Conclusion
The two countries rely on oil and gas export, but they both strive to reduce the importance of this sector and attempt to diversify the economy. Even though there is still room for improvement, in both cases there is a noticeable improvement that is especially visible for UAE. Still, the impact of the oil price fluctuations is bound to be felt by both countries. Norway outperforms UAE in most of the economy measurement parameters; at the same time, the rate of growth for UAE has been significantly higher than that of Norway.
This fact leads to the suggestion that UAE will be able to improve its performance in the near future. While the challenge of decreased oil prices is going to affect UAE economy in a rather negative way, the Expo 2020 is a positive influence that can minimise the damage of the former one. Multiple sectors of UAE economy are going to be boosted by the preparation to the Expo, one of them being tourism.
Reference List
Carpenter, C. & Khan, S. 2015, ‘ U.A.E. Removes Fuel Subsidy as Oil Drop Hurts Arab Economies‘, Bloomberg Business. Web.
Churchill, N. 2013, ‘Expo 2020 Win: Impact On Dubai’s Jobs Market‘, Gulf Business. Web.
CIA 2015a, The World Factbook: United Arab Emirates. Web.
CIA 2015b, The World Factbook: Norway. Web.
Gottheil, F. 2013, Principles of macroeconomics, 7th edn, Cengage Learning, Mason, OH.
Hanware, K. 2015, ‘Falling oil prices trigger stocks sell-off in Gulf’, Arab News. Web.
Levick, K. 2015, ‘World Expo 2020: The Arab Spring Advances‘, Forbes. Web.
OECD 2012, OECD Tourism Trends and Policies 2012, OECD Publishing, Paris.
OECD 2013, Education Policy Outlook: Norway. Web.
OECD 2015a, OECD Data: Norway. Web.
OECD 2015b, Employment Outlook: Norway. Web.
Rahman, F. 2015, ‘UAE Economy minister sees $80 per barrel as ideal oil price‘, Gulf News. Web.
The Economist Intelligence Unit Limited 2015, United Arab Emirates. Web.
UAE National Qualifications Authority 2013, The UAE Education System. Web.
World Bank 2015, World Development Indicators. Web.
World Travel and Tourism Council 2014, Travel & Tourism Economic Impact 2014: United Arab Emirates. Web.