An Organization with a Problem in Visual Management Using the 5M
The concept of visual quality management and 5M refer to the quality management approach developed by the Japanese manufacturers, which are currently used globally to improve manufacturing practices and ensure high quality of products and efficiency of processes. This notion originates from the quality of manufacturing approach Lean. The basis of this strategy is man, material, machines, methods, and money, which are the 5 M’s.
Since Lean aims to improve production and ensure that it is efficient and produces products with consistent quality, 5M’s help define issues in each of the domains and develop a strategy for addressing them. According to Bevilacqua, Ciarapica, and Paciarotti (2015), “the aim of visual management is to make information available, timely and understandable” (p. 753).
The authors provide a case study example of an automobile manufacturer AUTOFirm who had constant quality control issues due to flawed quality control processes. Using the 5M concept to inspect the automobile manufacturer’s issues, one can argue that problems existed in the domains of machines, methods, and money since this manufacturer had a flawed system of visual inspection and error detection, issues with information exchange due to manual data entry, and subsequent financial losses.
The primary strategy of visual control is to ensure the simplicity of information provided to employees. The main elements of visual quality control identified by Tezel, Koskela, and Tzortzopoulos are “transparency, discipline, continuous, improvement, job facilitation, on-the-job training, creating shared ownership, management by facts, simplification, unification” (as cited by Bevilacqua, Ciarapica, & Paciarotti, 2015, p. 754).
Abad (2019) defines visual management as one of the most essential and useful tools that emerged as part of the Japanese manufacturing strategies, which allows examining a process or performance visually and synthesize information to improve it. The author explains that in factories that use this methodology, one can see simple signs indicating visual quality control management. For example, signs that indicate different areas of production and manufacturing, provide names of different machinery, documentation that outlines the standards of work.
Moreover, visual quality management incorporates measurements that display the current performance of a facility when compared to the previous or planned performance, presented visually on boards as graphs or numbers. Finally, visual quality control includes the presentation of different activities such as value stream maps, Gannt diagrams, and other process management tools. Some of the main principles include easy access to information about the processes and the ability of people working in a facility to easily interpret it.
The Organization’s Problem in Visual Management Using the 5M
Based on the definition and explanation of the visual quality control, one can assess why it is essential for companies and the issues that arise if this tool is not implemented correctly. Firstly, visual quality control strategies help manage the information flow within a facility. This incorporates simple solutions, such as signs indicating different machinery or more complex graphs and charts developed to interpret the manufacturing processes and efficiency of operations visually.
Another aspect of managing the quality with visual control is the fact that employees consistently receive large amounts of data that they have to interpret and use in their work. This can lead to a conclusion or improper conclusions made based on the information, which adversely affects the manufacturing process. Bevilacqua, Ciarapica, and Paciarotti (2015) substantiate this claim by stating that usually, “information is not accurate, the needed information is not generated, or it cannot be easily identified and, more, the information cannot flow through the whole organization” (p. 753).
One application suggested by the authors is an automobile manufacturing, where a visual inspection of the operator’s work helped understand the areas where most cases of errors occurred. Hence, the main aim of the visual quality control is to help companies manage the information flow they have by providing employees with relevant and easy to understand data.
Solutions to the Organization’s Problem in Visual Management Using the 5M
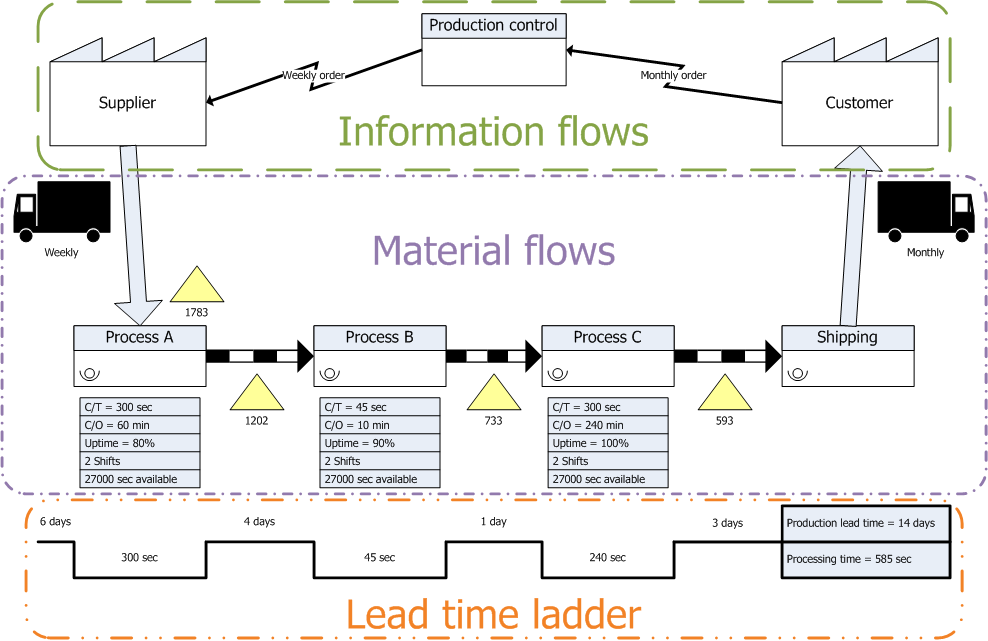
There are varied strategies for implementing visual quality control in different areas of manufacturing. For process control, Pictures 1 and 2 present a visualization of boards illustrating the manufacturing process. Picture 1 is a value stream map, which should be implemented to display the processes that the manufacturing facility hs to complete to deliver the output product to the customer.
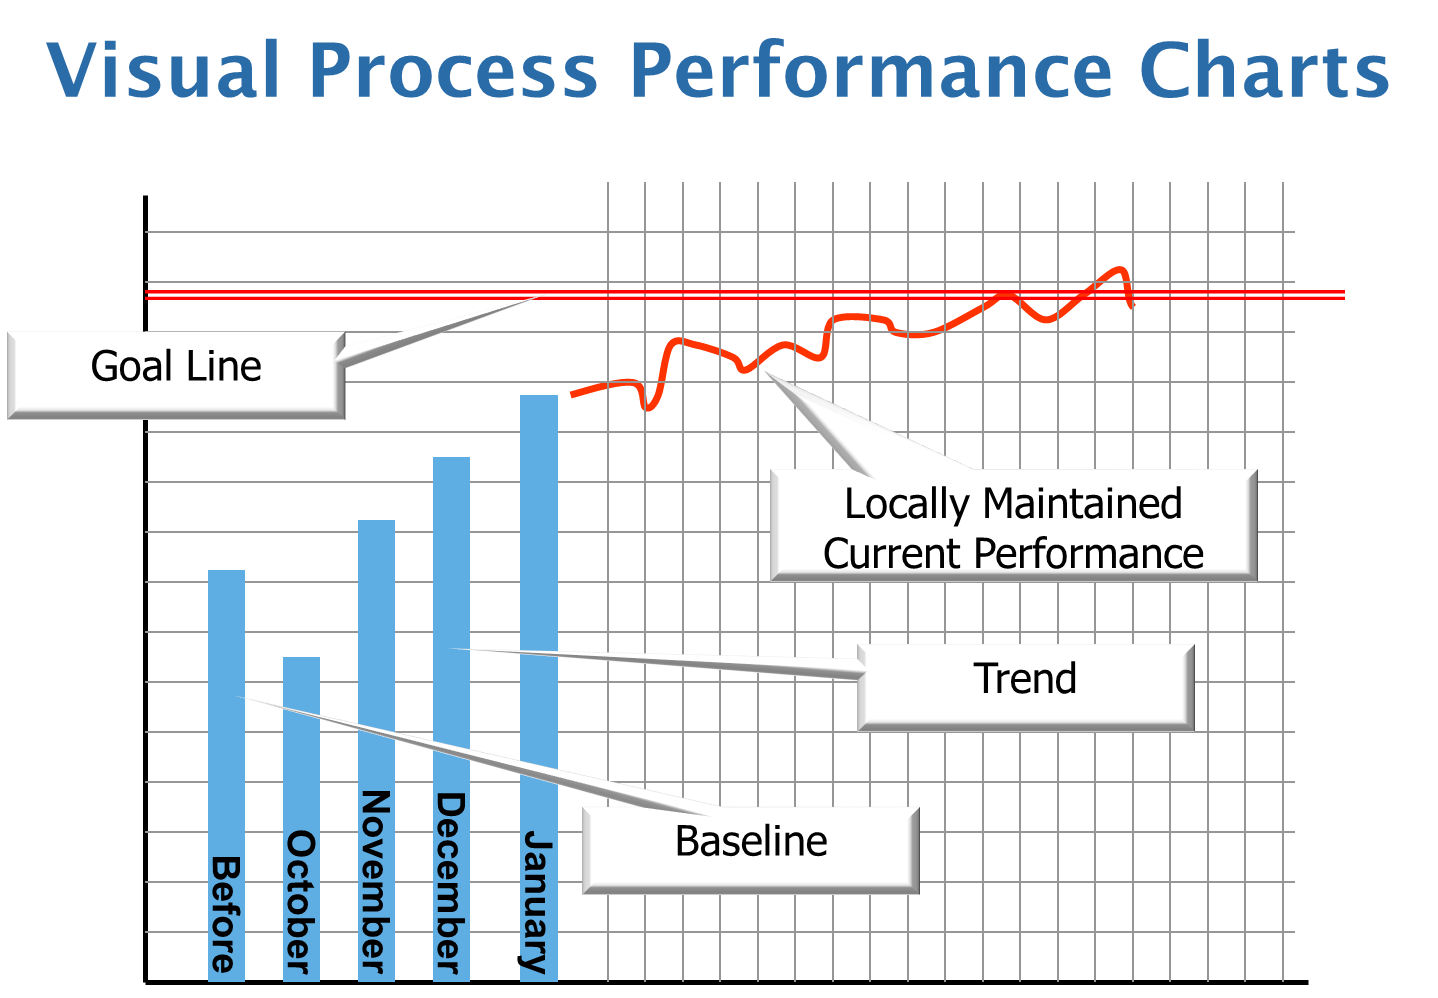
Therefore, all aspects of production, including receiving materials from suppliers and shipping the product once it is completed, must be displayed. In the context of the automobile company, this map can help identify delays, restraints that limit the production capacity, and excess inventory. Picture 2 displays a visual process performance chart, which helps compare the current performance of the facility to its previous output and goals of the company. By updating this chart and reviving it, the employees will be able to indicate inconsistencies in a performance that need to be addressed in order to reach the set targets.
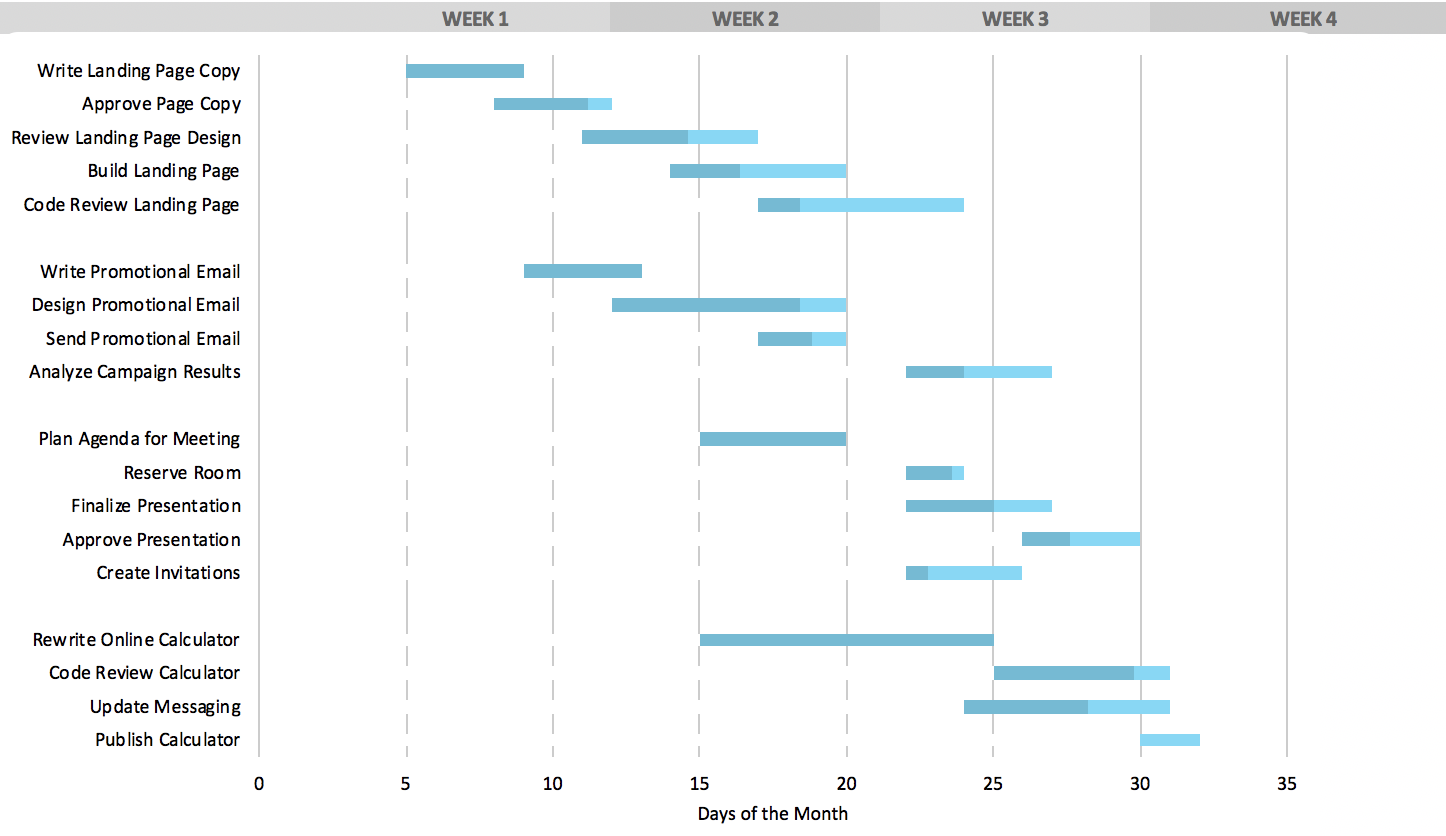
Flowcharts are often recommended as part of the visual quality control as they provide a comprehensive and easy-to-understand method for displaying data. For example, the Gantt chart is a simple method for controlling a project’s progress within a given organization, which highlights tasks and deadlines, allowing employees to understand the expectations of their work better. An example of a Gantt chart is presented as Picture 3, which displays a project implemented within an organization.


Recommendations to Improve the Solutions to the Organization’s Problem in Visual Management Using the 5M
The recommendations for implementing visual inspection and thus improving the quality of processes within an organization involves an analysis of the current manufacturing practices, identification of areas where visual control can be used, and implementation of new practices, and evaluation of the impact that they have on the outcomes. The most straightforward aspect of visual quality control is having signs that indicate different areas and machinery and allow people to have a better understanding of the processes.
In the example of AUTOFirm, the use of visual inspection for error detection helped locate bottlenecks in production for operators, which can also be used in other product areas as well. In addition, the visual information flow issues should be addressed by developing value stream maps and process performance charts, which will help locate areas of poor performance or detect the insufficient output of the production facility.
Manufacturing facilities can use different strategies for ensuring that their products have sufficient quality, one of which is a visual inspection of the items. Knop and Mielczarek (2018) state that this approach is also used for visual inspection of the production items, which allows companies to have a quality control system in which employees look at each manufactured item to detect errors. Hence, the concept of visual quality control management is complex and incorporates various elements of improving the accessibility of information and inspection of processes to enable improvement. Examples of companies that successfully use visual quality control tools within their production facilities are Japanese car manufacturers such as Toyota, Lexus, and Ford, and electronics manufacturer Phillips (Hashmi, n.d.).
References
Abad, S. (2019). Understanding lean visual management tools. Web.
Bevilacqua, M., Ciarapica, F. E., & Paciarotti, C. (2015). Implementing lean information management: the case study of an automotive company. Production Planning & Control, 26(10), 753–768. Web.
Eaidgah, Y., Maki, A. A., Kurczewski, K., & Abdekhodaee, A. (2016). Visual management, performance management and continuous improvement. International Journal of Lean Six Sigma, 7(2), 187–210. Web.
Hashmi, K. (n.d.).Introduction and implementation of Total Quality Management (TQM).Web.
Knop, K., & Mielczarek, K. (2018). Using 5W-1H and 4M methods to analyse and solve the problem with the visual inspection process – Case study. MATEC Web Of Conferences, 183, 03006. Web.
Pearson, S. (n.d.). Value stream mapping: Definition, steps, and examples. Web.
Visual management – It’s right before your eyes, or is it? (n.d.). Web.