Abstract
Countries across the globe are using recycling technologies to manage their waste. However, some countries are lagging behind others because of the lack of their government’s interest and recycling systems. Moreover, people living in those countries do not have awareness and access to recycling systems. Dubai is also facing a similar situation. The current study investigates the relationship between Frequency of Recycling and Income Level. The study collects data from both primary and secondary sources.
The primary data is collected through the implementation of a survey by using an online survey tool, Survey Monkey. The findings of the study are based on statistical testing of data. The results indicate there is no significant relationship between the Frequency of Recycling and Income Level. There are limitations related to the methodology and sampling that affected the outcome of this study. For future studies, it is recommended to increase the same size and carry out the survey in a relatively controlled environment for a better understanding of respondents and response rates.
Research Plan
This section of the report provides details of the research plan including the background of the research, its objectives, and data collection strategies, resources, and analysis.
Research Purpose and Objectives
The purpose of the current research is to investigate the trend of recycling in Dubai. Dubai has experienced phenomenal growth in the last twenty years. The economy is primarily boosted by the real estate industry and the leisure and travel industry. Dubai is considered as a major business center in the Middle East region. With a booming economy, the country also experienced an increase in its population in the last two decades. The industrial development along with the growth in the country’s population has increased the number of challenges that the government faces. One of these challenges is waste management.
The economy activity generates a significant amount of waste that is either dumped in the wasteland or recycled. The country must have an efficient waste management system that could manage waste and also reduce its impact on the environment. One way of reducing the impact on the environment is to recycle waste and produce reusable products or material. Recycling is considered to have minimal impact on the environment. Therefore, Dubai’s government is undertaking projects that could recycle waste on a large scale. The measures undertaken by the government are aimed at achieving environmental sustainability.
Keeping in view the background of recycling in Dubai, the current study has the following research objectives.
- To identify and Evaluate the Current Household Recycling Rates, Practices, and Impediments in Dubai.
- To analyze People’s Opinions of Recycling within Dubai.
- To make Recommendations for concerns such as Dubai Government, Ministry of Climate Change & Environment, UAE Minister of Environment and Water, and Dubai Municipality – Environment Department that involves recycling and waste management for improvement and what could be done differently.
- To evaluate the statistical relationship between the monthly household income and the frequency of recycling for a household.
These objectives are achieved by providing a discussion of key findings in different sections of this report.
Data Sources
Secondary Data
The secondary information is related to recycling in Dubai. It covers the current recycling facilities offered by the government and the extent of these facilities. The information is collected from different secondary sources including books, articles, and reports.
Primary Data
The study used the questionnaire as a method to collect the primary data. The questionnaire was conducted on an online website named “Survey Monkey” which is an online survey development cloud-based software. The researcher designed the questionnaire by including ten questions that are aimed at collecting data on respondents’ demographics, their recycling habits, and views on the steps taken by the government to facilitate and promote recycling in the country.
Questionnaire Design
The researcher designed the questionnaire based on the understanding of the research topic. The questionnaire included 10 questions. The questionnaire was structured in three sections. The first section includes six questions related to the demographics of respondents. The second section includes two questions related to the recycling habit of respondents. The third section includes two questions related to the views of respondents on the steps taken by the government to facilitate recycling in the country. Most of the questions in the questionnaire are closed-ended questions. The close-ended questions provide choices of responses to individuals. Moreover, they are useful for the numerical coding of data. Therefore, they facilitate quantitative analysis that is implemented in this study. The question “Are you happy with the recycling procedures in Dubai?” also allows the respondents to provide a detailed reply indicating the reason for their choice.
Sampling Method
The sampling method that the current study used is non-random sampling. The researcher used convenience sampling which was very convenient due to the accessibility and quick response from audiences. Also, it was used because of the limited time and resources, and such type of sampling technique allows the researchers to choose who, where, and when to collect data. One of the limitations of this method is that the results may be non-representative of the entire population. For this study, 100 respondents were requested to participate in the survey. However, only 25 completed and approved questionnaires were included in the findings. The reason for the rejection of questionnaires was incomplete responses. It must be noted that even in the selected 25 questionnaires there are issues of inconsistency and incompleteness which affected the outcome of the study.
The Basis for Quantitative Analysis
The study focuses on the relationship between the income level of respondents and the frequency of recycling. Therefore, it could be indicated that the Frequency of Recycling is the dependent variable, and Income Level is the independent variable. Furthermore, it is indicated that Income Level has grouped data, which means that the respondents were given choices of income range to choose. The dependent variable, Frequency of Recycling has five options. The data obtained from the survey is coded numerically to assign values to frequency options. The assigned values are as follows.
- All the time = 5
- Daily = 4
- Weekly = 3
- Monthly = 2
- Not sure =1
In the same way, the data obtained for the independent variable is numerically coded in the following.
- Less than AED 10,000 = 1
- AED 10,000 to AED 19,999 = 2
- AED 20,000 to AED 29,999 = 3
- AED 30,000 to AED 39,999 = 4
- AED 40,000 to AED 49,999 = 5
- AED 50,000 to AED 59,999 = 6
- AED 60,000 And above = 7
Furthermore, it is also noted that there is a missing value of Income Level as the total responses collected are 21. The missing value is coded as -1.
The data collected from the survey questionnaire is subjected to quantitative analysis. The quantitative analysis includes calculation of frequencies of responses for each question included in the questionnaire. The frequencies are essential to determine the trends by indicating high-frequency responses. The next step of the analysis involved determining the mean, variance, and standard deviation of responses obtained for the question related to Income Level. Furthermore, mode, median, and interquartile range of responses obtained for the question related to the Frequency of Recycling are determined.
The next step determined the correlation between dependent and independent variables. The Pearson R Test determined the value of the correlation coefficient (r) by using the following formula (Boslaugh 2012).
- x = Income Level
- y = Frequency of Recycling
- n = Number of responses.
The correlation is represented graphically using the scatterplot. Furthermore, the significance of the correlation between Frequency of Recycling and Income is determined. The testing was based on calculating the t-value and comparing it with the critical t-value obtained from a one-tailed t-table.
The criterion for testing the significance is that if the t-value is more than the critical t-value, then the null hypothesis of a significant relationship is rejected and accepted otherwise.
The last part of the quantitative analysis implements the univariate regression model. The regression equation to be obtained is in the following form.
y = b0 + b1*x
Where,
- y = Frequency of Recycling
- x = Income Level
- b0 = Coefficient of Constant
- b1 = Coefficient of Slope.
Scope of Inquiry
The scope of inquiry in the current research study was limited to the residents of Dubai. Therefore, the findings of this study have a limited scope in terms of their use to explain the conditions of another country even in the U.A.E.
Data Analysis
Secondary Information
The Arab Gulf and Dubai, in particular, has often been portrayed as a blank slate for contemporary urban development. Celebrating an aim more ambitious than simply catching up to the development levels of cities like London, Hong Kong, and especially Singapore, Dubai’s Sheikh Mohammed bin Rashid Al Maktoum frequently asserted that Dubai would surpass those cities to become number one (His Highness Sheikh Mohammed Bin Rashid Al Maktoum Launches Dubai Industrial Strategy 2016).
The government aims for an ambitious waste management technique, and one of these is recycling. It wants to evaluate existing household recycling rates, practices, and problems encountered, analyze the data, and to attain zero waste by 2030. These are all embodied in the Dubai Integrated Energy Strategy (UNDP 2014).
The UAE produces a large amount of waste, but a large percentage of this is recyclable. The government has emphasized recycling in many of its programs and has provided recycling centers in various city centers like Dubai. Individuals may be influenced by the recycling behavior of others, and this could be applied to countries and their policy-making behaviors (Gamba & Oskamp 1994). It follows that it can be considered a spatial interaction, or a relationship that will consider the importance of space (Anselin 2002).
The Dubai government has contracted Tadweer Waste Treatment LLC to recycle materials, a portion of the daily 4,000 tons of waste from the entire municipality (About Us – Tadweer 2017). Another private company contracted by the government is M/S Emirates Recycling LLC.
Primary Findings
Frequency
The frequency tables of questions included in the questionnaire are provided in the following along with their interpretation.
Q1 Respondents Age
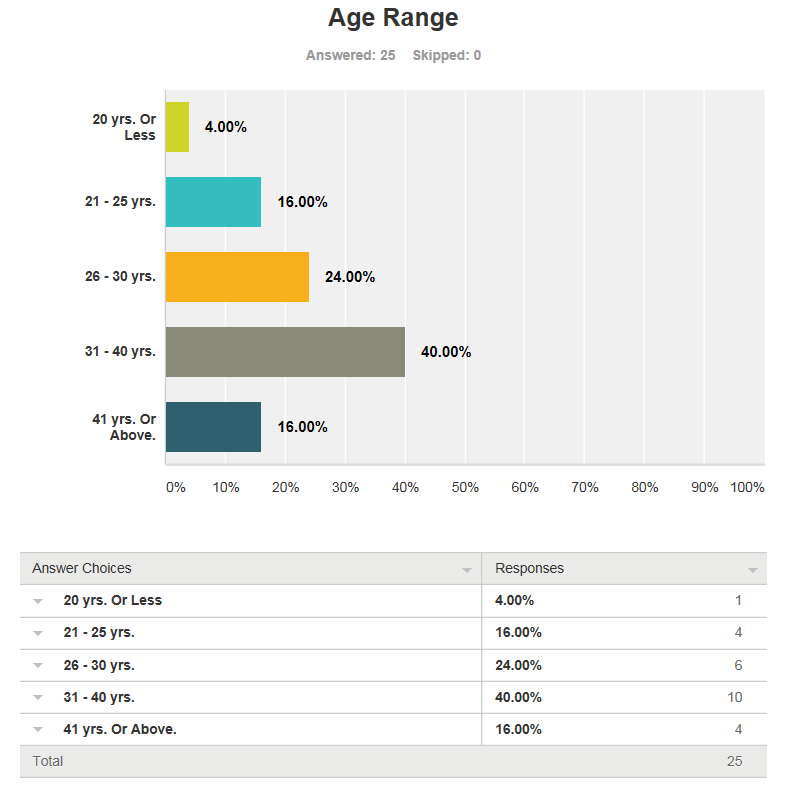
The figure indicates that the majority of respondents belonged to the age group of 31-40 years. Moreover, the distribution indicates that most of the respondents were above 21 years.
Q2 Respondents Gender
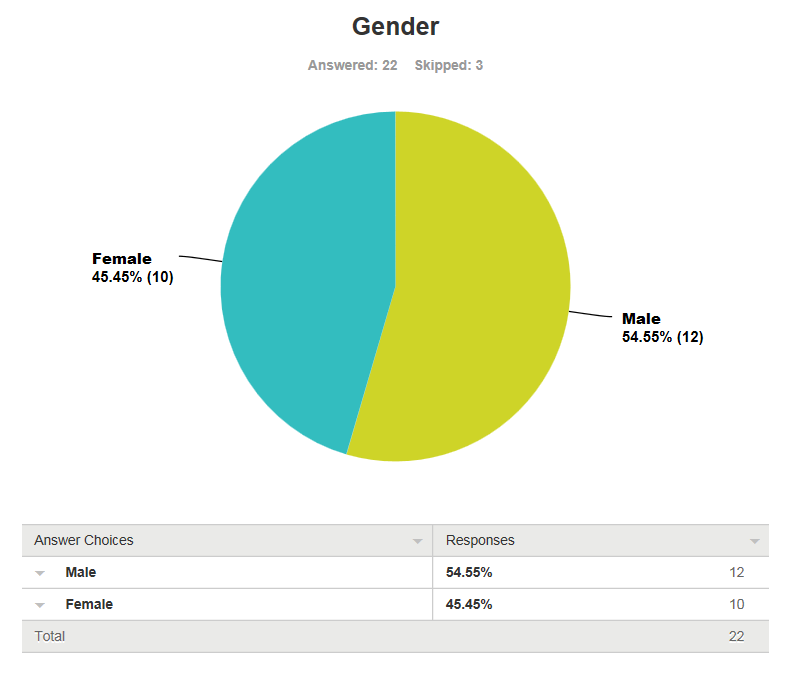
Only 22 respondents replied to this question. 12 respondents are males and ten are females. The remaining three individuals did not disclose their gender.
Q3 Respondents Nationality
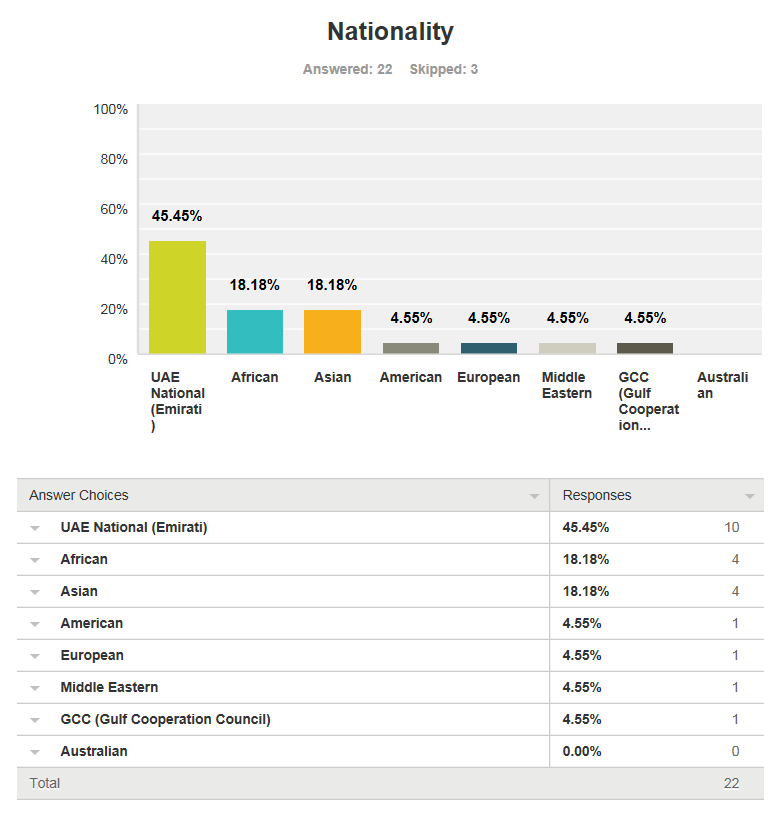
Only 22 individuals responded to this question. Figure 3 indicates that the majority of respondents are UAE Nationals.
Q4 Education Qualification
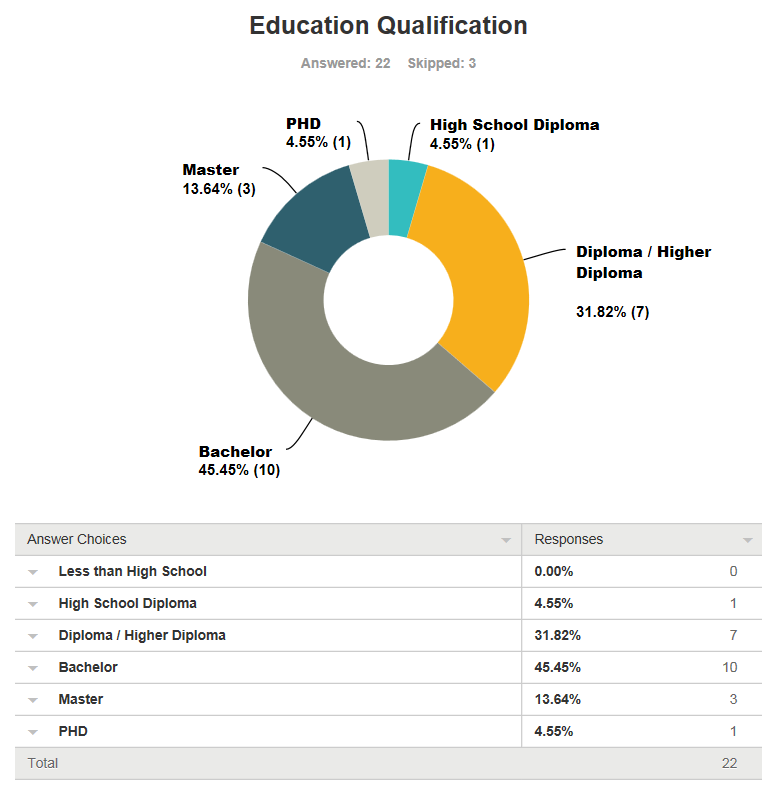
Only 22 individuals responded to this question. Figure 4 indicates that most of the respondents hold a Diploma / Higher Diploma or Bachelor’s Degree.
Q5 Work Status
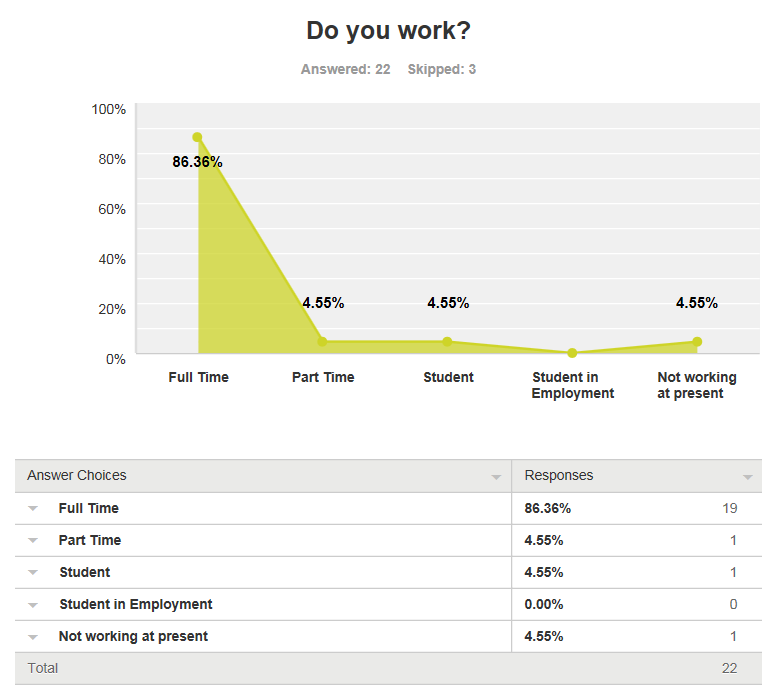
Only 22 individuals responded to this question. Figure 5 indicates that 19 respondents are working full time. Only one individual is not working or doing anything else at present.
Q6 House Income
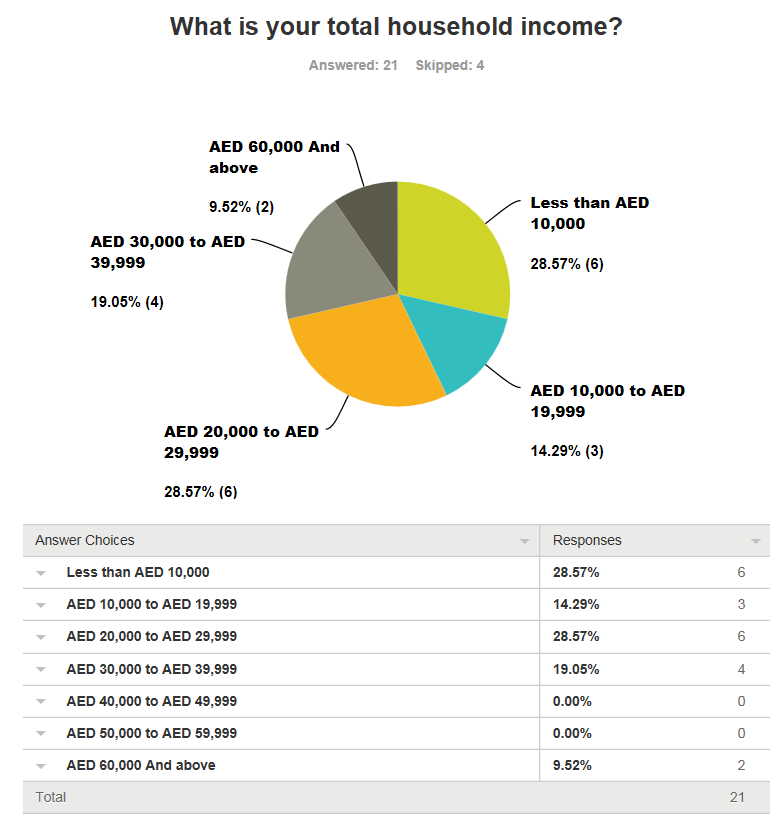
Only 22 individuals responded to this question. Figure 6 indicates that most of the respondents are earning less than AED 40,000. The two-income ranges that have the highest frequency of six are ‘Less than AED 10,000’ and ‘AED 20,000 to AED 29,999’. Only two individuals are making more AED 60,000 in a month.
Q7 Frequency of Recycling
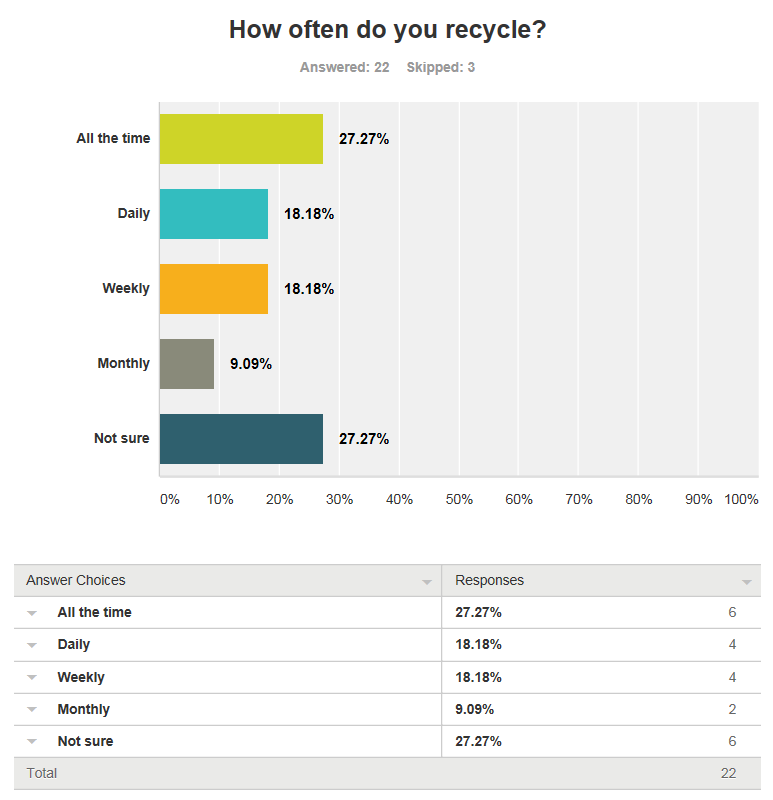
Only 22 individuals responded to this question. Figure 7 indicates that most of the respondents are recycling all the time or they are not sure if they are recycling their waste or not.
Q8 Materials
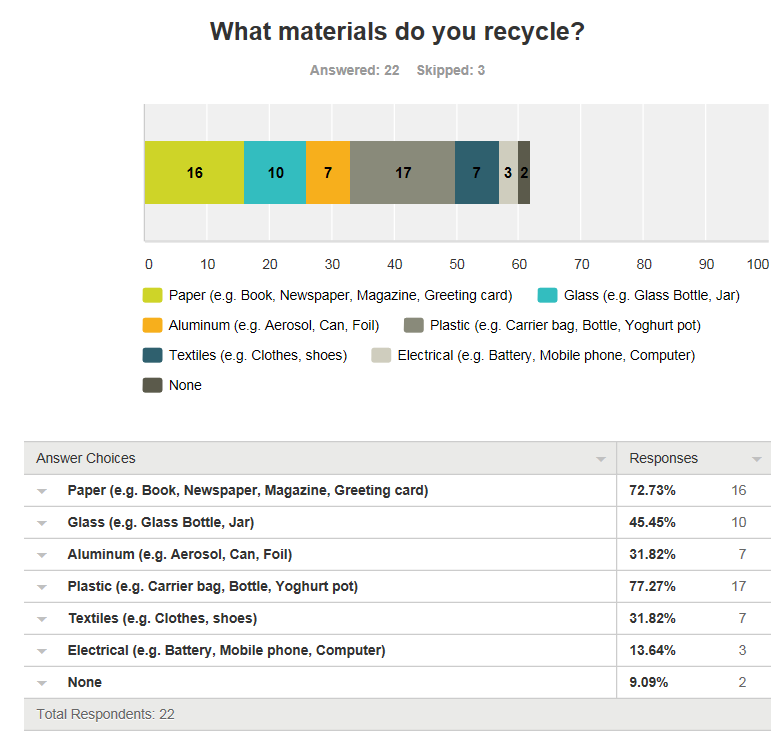
Only 22 individuals responded to this question. Figure 8 indicates that most of the respondents are recycling paper, plastic, and glass. Two respondents responded that they do not recycle anything. Overall, almost all items are recycled.
Q9 Dubai Recycling
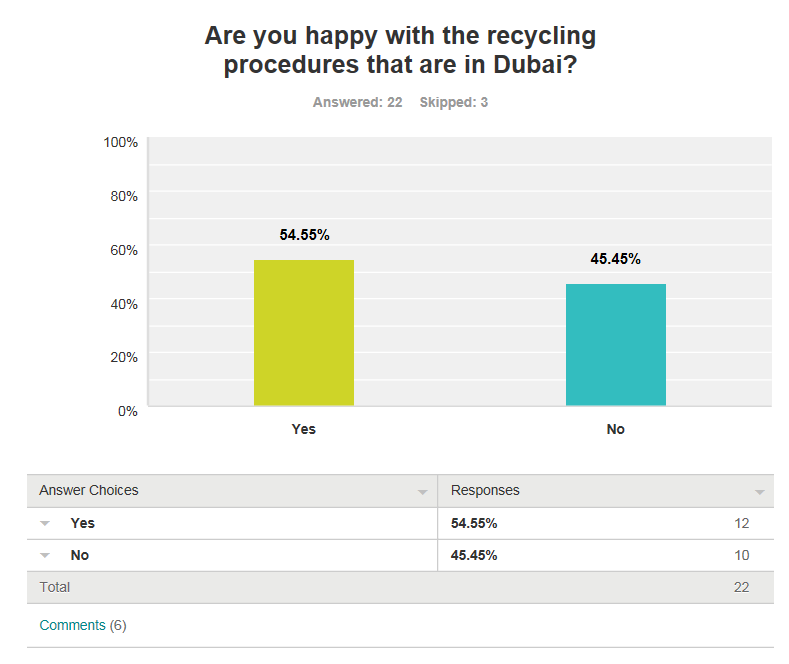
Only 22 individuals responded to this question. Figure 9 indicates that 12 respondents are happy with the initiatives taken by the UAE government to promote recycling. The other ten respondents are not happy.
Q10 Recommendations
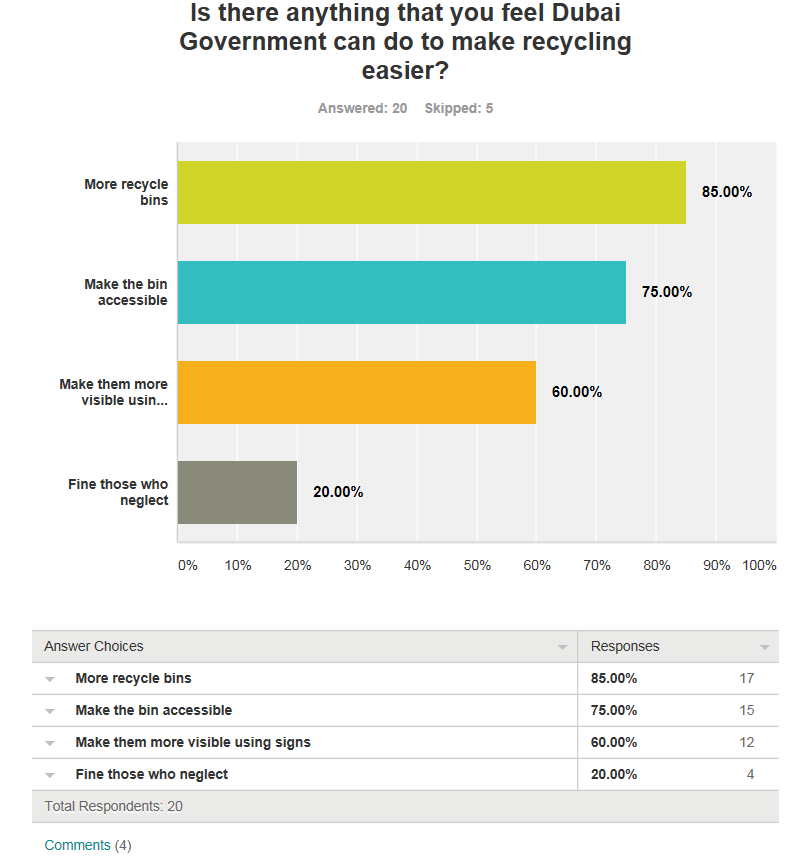
Only 22 individuals responded to this question. Figure 9 indicates that the majority of respondents are of the view that the government should provide more recycling bins and make them accessible. Moreover, it should use visible signs for guidance. Only four respondents responded that fine should be imposed on those who neglect recycling laws.
Statistical Testing
Mean and Standard Deviation – Income Level
Table 1. Calculation of Mean and Standard Deviation.
Mean = ∑fx/Σf = 494,993.50 /21 = 23,571.12
Variation= Σf*(x-mean) ^2/Σf = 6,257,114,286.95 / 21 = 297,957,823.19
Standard deviation= √a² = √ 297,957,823.19 = 17,261.45
The mean value of monthly household income is AED 23,571.12 and the standard deviation is AED 17,261.45. The high value of standard deviation implies that there is a lot of dispersion in responses collected through the survey that could undermine the outcome of testing performed in this study.
Median, Mode, and Inter-Quartile Range – Frequency of Recycling
Mode represents the value which has the highest number of frequency. It could be noted from the table provided above that the mode is ‘All the time’, which has the highest frequency of 6.
Median is determined as the observation in the data that separates the set in upper and lower halves. Based on the given number of data i.e. 25, the median is determined as follows.
Median = 22 * ½ = 11th observation
From the data collected, the 11th observation is weekly.
The 11th observation in the data set obtained is 3 that represents ‘Weekly’ frequency.
The lower quartile, Q1 is determined as 1.25 and the upper quartile, Q3 is 4.75 using MS Excel.
Correlation
Table 2. Calculation of Correlation Coefficient.
r = 1.64 / √ 76.77* 53.82
r = 0.025
r-square = 0.025 ^ 2 = 0.0006 or 0.06%
The value of r-square is very low and could be considered as insignificant.
t = 0.025 √22-2/1-0.0006
t =0.111836955 < 1.74 (df =23)
Since the t-value is less than the critical t-value, therefore the null hypothesis of no significant relationship between Income Level and Frequency of Recycling is accepted. The alternative hypothesis of a significant relationship is rejected.
Regression
y = b0 + b1*x (Seber & Lee, 2002)

b1 = 1.6363/76.7727 = 0.0213
b0 = y − b1 * x = 3.09 – 0.0213 * 2.68 = 3.0337
The regression equation is obtained as follows.
y = 3.0337 + 0.0213 * 2.68
The coefficient of the slope is 0.0213 which is very small value and does not signify the relationship between Frequency of Recycling and Income Level. The positive sign of the coefficient implies that there is an indication of a positive relationship between Frequency of Recycling and Income Level. The positive relationship implies that individuals with high-income levels are more likely to use recycling facilities. The p-value is not calculated which would be a better indicator of the significance of the relationship between dependent and independent variables.

The scatter plot provided above indicates that there is a slight positive relationship between Frequency of Recycling and Income Level.
Project Plan
The project plan for the recycling plant of the UAE government is provided in the following.
Table 3. Project Plan.
Critical Path

Financial Appraisal
The cost of recycling projects by the UAE government could be estimated at AED 5 million that will include the cost of extra bins, awareness programs, signage, and other administrative and operational costs to start up the project. The current capacity of the recycling plant in Dubai is 9.5 million tons per annum. Furthermore, it could be estimated that Dubai Municipality – Environment Department will collect 3 million tons in the first year which will increase to 9.5 million tons by the 6th year. The expected revenue per ton of recycled items is $60. The cost of recycling is $50. The cost of capital is high and estimated to be 7%. Based on these estimations the following cash flows are prepared.
Table 4. Net Present Value.
Table 4 indicates that the net present value of the recycling project is estimated to be AED 231.88 million over six years. The positive net present value implies that the government of Dubai should go ahead with increasing its recycling activities and expanding its coverage.
Limitations, Recommendation, and Conclusion
There are obvious limitations of the data collected due to time and resource constraints. The outcomes of correlation and regression testing indicate that the values of coefficients are insignificant that is not sufficient to predict any relationship between Frequency of Recycling and Income Level. However, it could be indicated that the governments and its authorities need to take more initiatives to promote recycling as the majority of individuals feel that the steps taken by the government are not sufficient. There should be a clear strategy to put bins to collect recyclable waste. Moreover, there should be a strict policy to punish offenders. The government can achieve the expected outcomes by helping its residents to adopt new ways and recycling technology at their premises.
The current study concludes that there is no significant relationship between the Frequency of Recycling and Income Level. There are major flaws in the data collected. The reason for this is that the respondents did not complete their questionnaire properly. The project has a positive NPV. Therefore, it should be accepted.
Reference List
About us – Tadweer, 2017. Web.
Anselin, L 2002, ‘Under the hood: issues in the specification and interpretation of spatial regression models’, Agricultural Economics, vol. 27 no. 3, pp. 247-267.
Boslaugh, S 2012, Statistics in a nutshell: a desktop quick reference, O’Reilly Media, Inc., Sebastopol.
Gamba, RJ & Oskamp, S 1994, ‘Factors influencing community residents’ participation in commingled curbside recycling programs’, Environment and Behavior, vol. 26, pp. 587-612.
His Highness Sheikh Mohammed Bin Rashid Al Maktoum launches Dubai industrial strategy, 2016. Web.
Seber, GAF & Lee, AJ 2002, Linear regression analysis, John Wiley & Sons, Hoboken.
UNDP 2014, State of energy report, Dubai 2014 – UNDP. Web.