Sample Details
Topics
Subjects
Business
Company Analysis
Type
Research Paper
Reviewed by
IvyPanda Team
Pages
6
Words
1700
Facts about Topic
Date of foundation
7 March 1916
Headquarters
Munich, Germany
Founders
Camillo Castiglioni, Franz Josef Popp,
Karl Rapp
Products
Cars, motorcycles
Industry
Automotive
Area served
Worldwide
Products
Motorcycles, cars
Famous because of
BMW is famed for their contribution to sports cars and motorcycles and philosophy of high revving engines.
Interesting facts
BMW built the first electric car in 1972.
Website
bmwgroup.com

BMW Group Company Financial Statement Analysis Research Paper

Exclusively available on Available only on IvyPanda® Written by Human No AI

Introduction

Published financial statements provide the stakeholders with a narrow insight into the financial strengths and weaknesses of a business. Therefore, it is necessary to carry out a comprehensive financial analysis. The paper seeks to carry out a financial analysis of BMW Group for a period of five years, that is, between 2008 and 2012.

Balances reported

Income statement

20082009201020112012
Revenue53,19750,68160,47768,82176,848
Total operating expenses9,3815,8446,5877,3098,023
Net income3302103,2344,9075,096

The company reported a decline in the balances reported for revenue, gross profit, total operating expenses, operating income, and net income between 2008 and 2009. The decline was caused by the global economic meltdown and volatile economic conditions. The balances grew significantly between 2010 and 2012. Revenue increased from €60,477 million in 2010 to €76,848 million in 2012. The growth in revenue was caused by the change in the strategies and an increase in the number of sales stores across the world. This strengthened the existing sales network. The operating expenses also increased from €6,587 million in 2010 to €8,023 million in 2012. The increase was caused by a massive investment in technology and an increase in personnel cost. Despite the challenges and the increased competition, the net income increased from €330 million in 2008 to €5,096 million in 2012. Thus, it can be observed that the company reported impressive growth in revenue and profit.
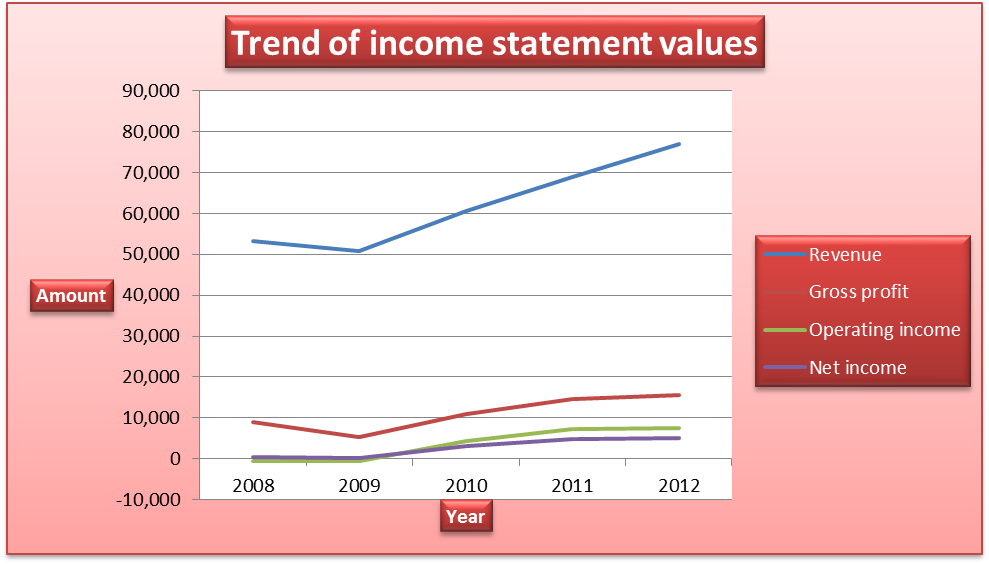
Trend of income statement values.

Balance sheet

20082009201020112012
Total current assets38,67039,94443,15149,00450,514
Total non-current assets62,41662,00965,71674,42581,336
Total assets101,086101,953108,867123,429131,850
Total current liabilities39,28736,91940,13447,21348,431
Total non-current liabilities41,52645,11945,63349,11353,017
Total liabilities80,81382,03885,76796,326101,448
Total stockholders’ equity20,26519,91523,10027,10330,402

The growth in the income statement values was supported by a corresponding growth in the balance sheet values (Collier 17). The value of total assets increased from €101,086 million in 2008 to €131,850 million in 2012. It can be observed that the value of non-current assets exceeded the value of current assets. This shows that a significant proportion of the total assets of the company are not held in less productive liquid assets. The increase in total assets was caused by the increase in the balances of property, plant and equipment, liquid funds, leased products, and receivables from sales financing.

On the liabilities and equity section, total liabilities increased from €80,813 million in 2008 to €101,448 in 2012 while the total equity increased from €20,265 million in 2008 to €30,402 in 2012. The increase in the total liabilities was caused by an increase in the amount of finance liabilities, customer deposits, and liabilities to banks. The increase in equity was caused by growth in the profit attributed to shareholders. Further, the balances show that the company makes use of debt financing more than equity financing.
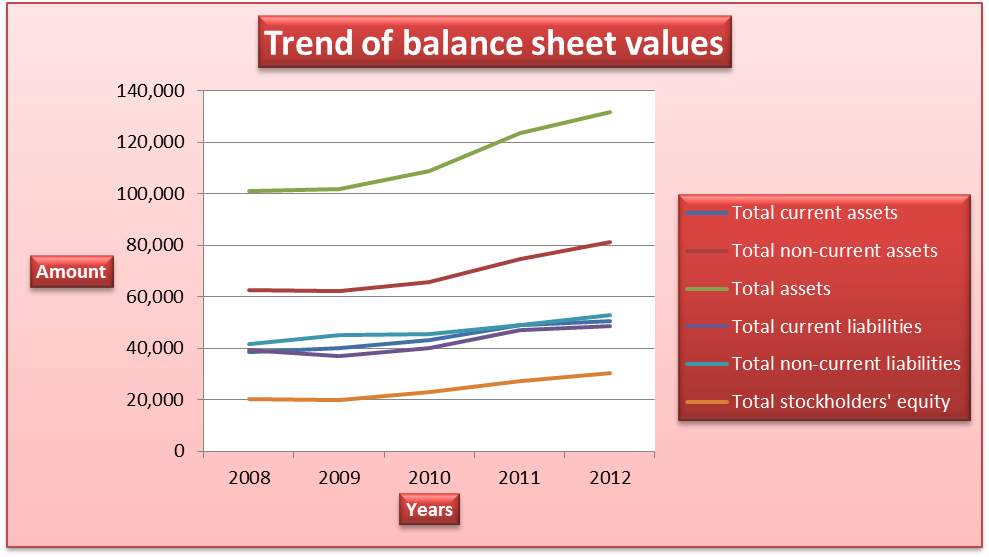
Trend of balance sheet values.

Cash flow statements

20082009201020112012
Operating activities10,87210,27113,6515,7135,076
Investing activities-18,652-11,328-14,522-5,499-5,433
Financing activities12,9041,35251087952
Net change in cash5,061313-335288581

The balances for the cash flow statement declined over the period. The cash flow generated from operating activities declined because of the increase in receivables from sales financing and leased products. Further, the cash flow used in investing activities declined from €18,652 million in 2008 to €5,433 million in 2012. The decline can be attributed to gradual decline in the amount of investment in intangible assets and property, plant and equipment. Finally, the cash flow generated from financing activities increased between 2011 and 2012. This was caused by cash inflow received from the issue of bonds.
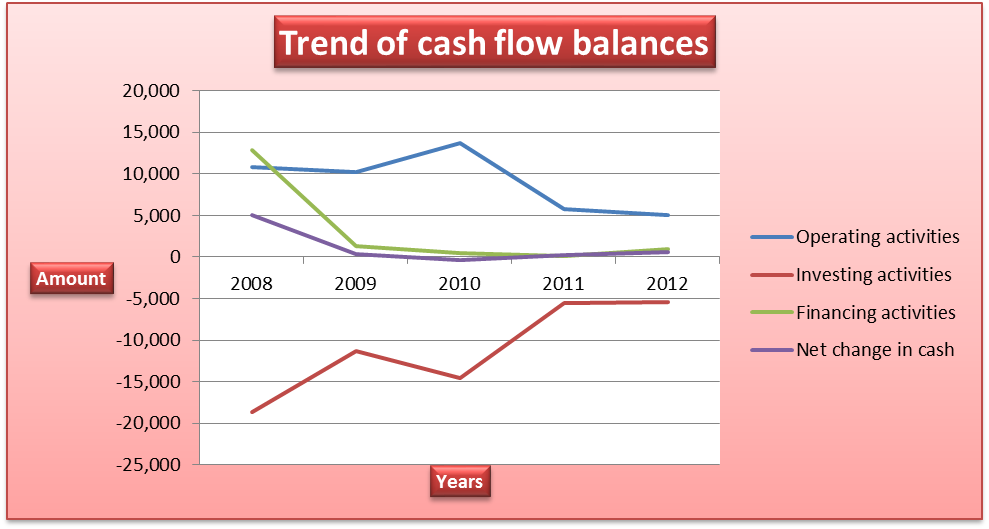
Trend of cash flow balances.

Common size financial statements

BMW Group. Common sized income statement

For a period of five years (2008 – 2012)

20082009201020112012
Revenue100.00%100.00%100.00%100.00%100.00%
Cost of revenue83.32%89.49%81.95%78.87%79.84%
Gross profit16.68%10.51%18.05%21.13%20.16%
Operating expenses
Research and development5.31%0.00%0.00%0.00%0.00%
Sales, General and administrative10.09%9.94%9.14%8.98%9.12%
Other operating expenses2.23%1.59%1.75%1.64%1.32%
Total operating expenses17.63%11.53%10.89%10.62%10.44%
Operating income-0.95%-1.02%7.16%10.51%9.72%
Interest Expense1.75%2.00%1.60%1.37%1.19%
Other income (expense)3.36%3.84%2.44%1.58%1.64%
Income before taxes0.66%0.81%8.00%10.73%10.17%
Provision for income taxes0.04%0.40%2.65%3.60%3.51%
Other income-0.01%-0.01%-0.03%-0.04%0.00%
Net income from continuing operations0.61%0.40%5.32%7.09%6.67%
Other0.01%0.01%0.03%0.04%-0.03%
Net income0.62%0.41%5.35%7.13%6.63%
Preferred dividend0.01%0.01%0.03%0.04%0.00%
Net income available to common shareholders0.61%0.40%5.32%7.09%6.63%
Weighted average shares outstanding
Basic3.40%3.61%2.99%2.63%2.35%
Diluted3.40%3.61%2.99%2.63%2.35%
EBITDA22.03%20.73%24.88%17.41%16.20%

The values reported in the income statement are expressed as a percentage of revenue (Deegan 83). In the table above, revenues, gross profit, operating income, and net income increased. However, cost of revenues, operating expenses and EBITDA declined over the period. The cost of revenue and operating expenses takes a significant proportion of the revenue earned by the company. The net income attributed to shareholders also increased as a result of an increase in sales and revenue.

BMW Group. Common size balance sheet

For a period of five years (2008 – 2012)

20082009201020112012
Assets
Current assets
Cash
Cash and cash equivalents7.37%7.62%6.83%6.30%6.35%
Short-term investments3.27%3.15%3.00%3.04%3.50%
Total cash10.64%10.77%9.82%9.34%9.85%
Receivables2.28%1.82%2.14%2.66%1.93%
Inventories7.21%6.43%7.13%7.81%7.38%
Other current assets18.12%20.16%20.54%19.89%19.16%
Total current assets38.25%39.18%39.64%39.70%38.31%
Non-current assets
Net property, plant and equipment11.17%11.17%10.50%9.47%10.12%
Intangible assets5.58%5.28%4.62%4.24%3.95%
Deferred income taxes0.86%1.24%1.28%1.56%1.52%
Other long-term assets44.14%43.14%43.97%45.03%46.10%
Total non-current assets61.75%60.82%60.36%60.30%61.69%
Total assets100.00%100.00%100.00%100.00%100.00%
Liabilities and stockholders’ equity
Liabilities
Current liabilities
Short-term debt29.57%26.42%24.36%24.61%23.07%
Accounts payable2.53%3.06%4.00%4.33%4.88%
Taxes payable0.63%0.82%1.10%1.10%1.12%
Other current liabilities6.14%5.91%7.41%8.21%7.66%
Total current liabilities38.86%36.21%36.87%38.25%36.73%
Non-current liabilities
Long-term debt30.17%33.73%32.91%30.46%29.65%
Deferred tax liabilities2.73%2.72%2.69%2.65%2.31%
Pensions and other benefits3.28%2.92%1.44%1.77%0.00%
Minority interest0.01%0.01%0.02%0.05%0.08%
Other long-term liabilities4.90%4.88%4.85%4.86%8.17%
Total non-current liabilities41.08%44.25%41.92%39.79%40.21%
Total liabilities79.94%80.47%78.78%78.04%76.94%
Stockholders’ equity
Retained earnings0.00%0.00%0.00%21.15%21.49%
Treasury stock-0.01%0.00%0.00%0.00%0.00%
Accumulated other comprehensive income20.06%19.53%21.22%0.81%1.56%
Total stockholders’ equity20.05%19.53%21.22%21.96%23.06%
Total liabilities and stockholders’ equity100.00%100.00%100.00%100.00%100.00%

The values in the balance sheet are expressed as a percentage of total assets (Haber 41). The non-current assets take a significant proportion of the total assets. Also, it can be observed that the balances of total liabilities exceed the shareholders’ equity. The balance sheet values grew over the period. The balance of property, plant and equipment is made up land, plant and machinery, office equipment, factories, and other operational facilities.

Ratio analysis

20082009201020112012
Profitability
Gross profit margin %16.710.51821.120.2
Net Margin %0.610.45.327.096.63
Return on Assets %0.340.23.054.23.99
Return on Equity %1.541.0214.9619.4517.72
Return on Invested Capital %-1.17-1.254.546.886.7
Gearing and solvency
Interest Coverage1.381.416.018.839.56
Financial Leverage4.995.124.714.554.34
Debt/Equity1.51.731.551.391.29
Liquidity
Current Ratio0.981.081.081.041.04
Quick Ratio0.250.260.240.230.65
Efficiency
Days Sales Outstanding17.0714.9912.6314.8913.84
Days Inventory60.2855.7152.7358.5257.6
Payables Period25.1722.8727.5232.5935.02
Fixed Assets Turnover4.754.475.35.966.14
Asset Turnover0.560.50.570.590.6
Investment ratios
Earnings per common share0.490.314.917.457.77
Price/Earnings95.2116.48.79.9
Price/Book11.51.11.51.5
Price/Sales0.40.60.50.60.7
Price/Cash Flow1.92.65.48.810.6

The profitability of the company improved over the period. However, the company reported a decline in profitability in 2009 due to the global financial crisis. The liquidity ratios of the company remained stable. The current ratios were slightly above one while the quick ratios were quite low. The ratios show that the company may face difficulties in paying current liabilities using liquid assets (Clarke 380). The solvency position of the company improved over the period. This can be attributed to increase in profitability. The gearing level of the company, as measured by financial leverage and debt to equity ratio, was relatively stable. The company is highly geared as indicated by the high amount of debt in the capital structure. The operating efficiency of the company improved over the period. This can be observed in the increase of efficiency ratios. An increase in the operating efficiency contributed to the increase in profitability. Finally, the investment ratios improved over the period. It implies that the value of the shares and the overall value of the company increased (Arnold 38).

Dividend policy

The company uses an open dividend policy. The amount of dividend paid per share depends on the amount of profit earned by the company. Thus, it is expected that as profit increases, the amount of dividend paid also increases. The table presented below shows the amount of dividend paid by the company for the past five years.

Dividend per share20082009201020112012
Common stock0.300.301.302.302.50
Preferred stock0.320.321.322.322.52

Source of data – BMW Group 45

The dividend paid for each common stock and preferred stock increased over the period. This corresponds to the increase in profitability of the company.
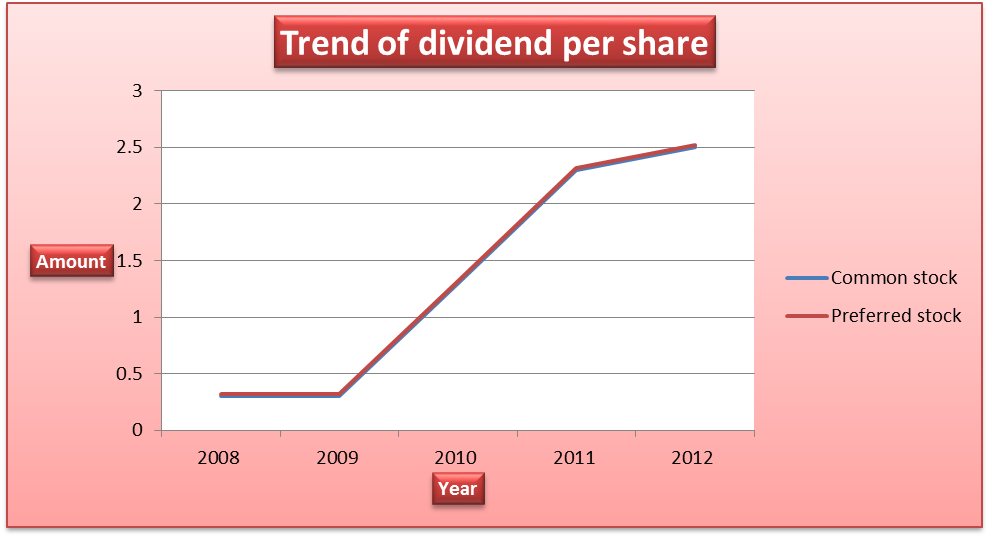
Trend of dividend per share.

Conclusion

In summary, the analysis above shows that the overall financial position of the company improved over the past five years.

Works Cited

Arnold, Glen. Corporate Financial Management, UK: Financial Times/Prentice Hall, 2007. Print.

BMW Group 2012, Annual Report 2012. Web.

Clarke, Edward. Accounting: An Introduction to Principles and Practice, USA: Cengage Learning, 2012. Print.

Collier, Peter. Accounting for Managers, London: John Wiley & Sons Ltd, 2009. Print.

Deegan, Craig. Financial Accounting Theory, London: McGraw-Hill, 2009. Print.

Haber, Jeffrey. Accounting Demystified, New York: American Management Association, 2004. Print.

Cite This paper
You're welcome to use this sample in your assignment. Be sure to cite it correctly

Reference

IvyPanda. (2020, May 30). BMW Group Company Financial Statement Analysis. https://ivypanda.com/essays/bmw-group-company-financial-statement-analysis/

Work Cited

"BMW Group Company Financial Statement Analysis." IvyPanda, 30 May 2020, ivypanda.com/essays/bmw-group-company-financial-statement-analysis/.

References

IvyPanda. (2020) 'BMW Group Company Financial Statement Analysis'. 30 May.

References

IvyPanda. 2020. "BMW Group Company Financial Statement Analysis." May 30, 2020. https://ivypanda.com/essays/bmw-group-company-financial-statement-analysis/.

1. IvyPanda. "BMW Group Company Financial Statement Analysis." May 30, 2020. https://ivypanda.com/essays/bmw-group-company-financial-statement-analysis/.


Bibliography


IvyPanda. "BMW Group Company Financial Statement Analysis." May 30, 2020. https://ivypanda.com/essays/bmw-group-company-financial-statement-analysis/.

More Essays on Company Analysis
If, for any reason, you believe that this content should not be published on our website, you can request its removal.
Updated:
This academic paper example has been carefully picked, checked, and refined by our editorial team.
No AI was involved: only qualified experts contributed.
You are free to use it for the following purposes:
  • To find inspiration for your paper and overcome writer’s block
  • As a source of information (ensure proper referencing)
  • As a template for your assignment
1 / 1