The purpose of this study was to determine average outpatient waiting for time and outpatient and employee satisfaction at Burjeel Hospital across various clinics. To address these objectives, the study questions included the following.
Research Questions
- What is your average outpatient waiting time with a consultant at Burjeel Hospital before receiving care?
- Based on your average outpatient waiting time at Burjeel Hospital, how would you rate your overall satisfaction with the hospital?
Methodology
The methodology provided the methods used to collect data for the research question. It was designed to inform research purpose and data analysis. The research methodology applied to study outpatient waiting time and outpatient and employee satisfaction at Burjeel Hospital was a case study. The case study ensured an in-depth exploration of available data regarding waiting times and satisfaction among employees and patients for the period of January 2015 to March 2015. Specifically, data for customer satisfaction surveys were collected on January 15 and February 15, while outpatient waiting times data were collected on March 15.
Identification and explanation of primary data collection methods
Standard survey questions designed and used by Burjeel Hospital were used as the primary methods of data collection for the study because of qualitative and quantitative data required. Data collected focused on opinions about customer satisfaction, interests, values, and experiences with the hospital and employees. Standard survey questions provided by Burjeel Hospital were used because of convenience. That is, they were readily available and easily distributed by hospital staff to various departments within Burjeel Hospital.
Identification and explanation of quantitative and qualitative data analysis methods
The researcher adopted a mixed methods research to provide ease of analysis of both qualitative and quantitative data (Johnson & Onwuegbuzie, 2004, pp. 14–26). The mixed-method (the inclusion of a quantitative phase and a qualitative phase in an overall research study) was used in the study. The quantitative phase focused on outpatient waiting time data, while the qualitative phase collected data on patient and employment satisfaction. The mixed-method provided the following advantages. The mixed-method was used to achieve research validity through triangulation. Triangulation involves verification of study findings. For instance, the researcher used both qualitative and quantitative methods in order to assess levels of satisfaction among outpatients and average waiting times across various departments.
The mixed methods research ensured that the study could explore two critical areas, that is, outpatient waiting time and patient satisfaction based on waiting time outcomes.
Identification and explanation of sample size and sampling method
The sample size for the study included only outpatients at Burjeel Hospital. Five patients in each outpatient clinic took part in the study. There were 24 clinics where participants were drawn to take part in the study. Specifically, data for customer satisfaction surveys were collected on January 15 and February 15, while outpatient waiting times data were collected on March 15. Although the researchers had intended to conduct five interviews with one doctor, one nurse, and a quality manager and two patients from each clinic, unfortunately, there was limited time, and interviews were difficult to set up. Notwithstanding those challenges, the researchers noted that this sample size was enough and, therefore, representative to explore outpatient waiting time and satisfaction.
A quota sampling method was used to select patients. The samples selected yielded the same proportions (5 patients from each outpatient clinic) as the known population (Burjeel hospital outpatient) on easily identified variables (Survey Questions). The sample was adequate to allow the researcher to generalize the results to other outpatients at Burjeel Hospital. This method also provided the researcher with the ease of finding respondents. Moreover, it was fair based on the selection of research participants within the hospital. Any possible bias in the study was controlled through an effective questionnaire design. Therefore, it provided good opportunities for the researcher to draw a generalized conclusion from the study.
Explanation of how the research activities related to the original decisions mentioned in the Proposal and Plan
All activities mentioned in the methodology aimed to gather data that would address outpatient waiting time and satisfaction. The aim of the research was to determine average outpatient waiting for time and outpatient and employee satisfaction at Burjeel Hospital across various departments. To address these objectives, the study methodology ensured that data collection instruments were designed to collect only data relevant to the study.
Burjeel Hospital survey questions were designed to ensure reliability and validity throughout the data collection process. In addition, mixed-methods research was used to ensure that both qualitative and quantitative data were collected. Hence, numerical and in-depth insights could be obtained to address outpatient waiting for time and levels of satisfaction at Burjeel Hospital across various departments. Further, the researchers ensured that sampling procedures and samples for the study were based on quota sampling for the same proportions for all clinics.
Data Collection and Analysis
Descriptive Analysis
A descriptive analysis was used to analyze quantitative data.
Burjeel Hospital provides several care services. The study was conducted across 24 clinics. These clinics and specialty outpatient clinics included cardiology; dental; dermatology; emergency; orthopedic; pediatric; ophthalmology; family medicine; rheumatology; and urology, among others.
The researcher cleaned data after collection by ensuring that all responses were corresponding to the right questions. The hospital has maintained the validity of survey questions by ensuring that questions measure what they aim to measure, and therefore, they are specific to outpatients, outpatient waiting time, and outpatient and employee satisfaction.
The hospital collected data based on its observation between the month of January and March 2015. Data for the study were retrieved for analysis for the specified period. Specifically, data for customer satisfaction surveys were collected on January 15 and February 15, while outpatient waiting times data were collected on March 15. Data for the study reflected the frequencies of patients’ waiting time during the appointment. For the given periods, data were analyzed to determine clinics with the longest average waiting times and highest scores in customer satisfaction.
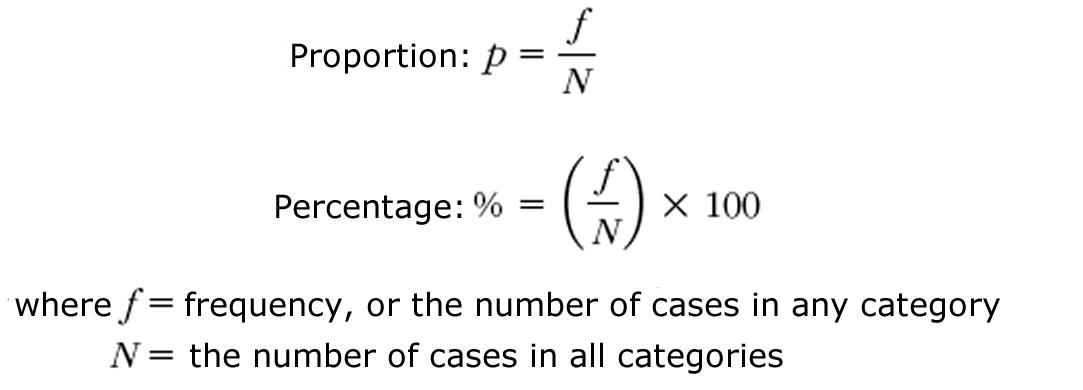
Percentages and proportions were determined using the formula:

The researcher relied on descriptive statistics for quantitative results to describe average rates of waiting times across various clinics.
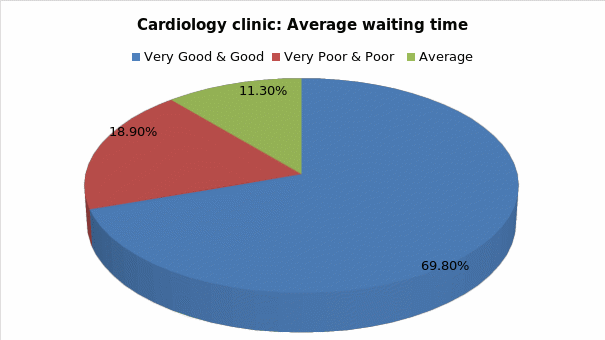
For instance, the average waiting times for patient at the cardiology clinic were determined based on patients’ satisfaction using ‘very good and good’ (69.8%), very poor and poor’ (18.9%) and average (11.3%) (see table 1 in the appendix). Many patients agreed that the average outpatient waiting time at the cardiology clinic was relatively very good and good.

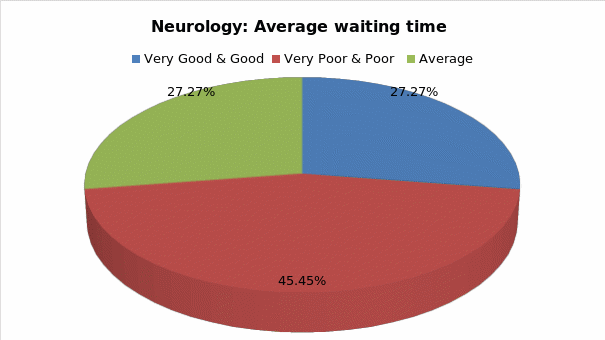
On the other hand, patients at the neurology department indicated that the average outpatient waiting time was generally very poor and poor (46%), average (27.3%), and ‘very good and good was 27.3%.

These variations in scores across different clinics showed that not all clinics had similar response times to outpatients on appointment.
When ranked, some clinics performed better than others did. For instance, it was established that clinics such as pulmonology and urology had 100% very good and good rating, physiotherapy had 97%, while plastic clinics had an 80% rating (see table 1 in the appendix). From the analyzed data, it emerged that emergency (40%), nephrology (33.3%), neurology (27.3%), and rheumatology (0%) on very good and good ratings had the worst average waiting for time rating relative to other clinics.
A content analysis was conducted for qualitative data. Codes were assigned to textual data by identifying common themes on customer satisfaction, which included courteousness and friendliness; the level of attention given; explanation provided; aftercare services; waiting room comfort; privacy and confidentiality; and direction to the appropriate floor among others. Codes helped in textual data analysis, summarizing, and evaluating common themes found within the outpatient waiting time data. Through codes, descriptive analysis, and hypothesis testing of customer satisfaction were possible, and further classification of the discrete patient and employee statements into distinct themes (above-mentioned). Numbers were assigned to themes during the analysis for the representation of common themes and classification.
For instance, themes for customer satisfaction were coded to reflect the percentages and proportions of satisfaction relative to patient numbers and other clinics. One factor that emerged was that patient and employee satisfaction differed on any given day. For instance, the cardiology department recorded a high percentage (75.8% – very good and good) of satisfied customers in January relative to 74.1% of very good and good recorded at the same time in the month of February. On the other hand, the neurology clinic recorded increased customer satisfaction from 75% in January to 100% in February. This showed that customer satisfaction at the hospital differed from time to time and across clinics.
Generally, clinics that had better outpatient waiting times also had high percentages of satisfied customers.
This study is mixed-methods research; the researchers presented results by using both descriptive statistics and analysis of qualitative in relevant themes. The research findings were presented in easy to understand form using percentages.
Conclusion
The chosen data collection methods and data analysis tools have been used to support the coverage of the research questions and research objectives. The study instrument was designed to collect only data that would answer the hypothesis and the study issue under investigation. On this note, a mixed methods research was used to gather both quantitative and qualitative data to answer outpatient waiting times and outpatient customer satisfaction, respectively. A quota sampling method was used to provide the same proportions of five patients from each outpatient clinic as the known population at Burjeel hospital outpatient on easily identified variables.
Data provided by the hospital on waiting time were analyzed. Hence, descriptive techniques were used to show various rates of waiting times across different departments. In addition, thematic analysis was used to evaluate patient and employee satisfaction.
Results were used to confirm or reject the study hypothesis.
Results of the Analysis and Comparison with Literature Review
From the above table, outpatients experienced different rates of waiting time at different clinics of Burjeel Hospital.
The researchers observed outpatient waiting times at Burjeel Hospital during the month of March 15, 2015. The highest noted average waiting times for physician appointments were in Rheumatology (100%), Neurology (27.3%), Gastro (21.6%), and G&O (20.4%). The lowest average waiting times were in Urology, Pulmonology, Plastic, Nephrology and General Surgery (0%), Vascular (5.6%), Physiotherapy (3%), and Ophthalmology (6.8%). It was noted that average rates of waiting times (Very Good & Good) for medical emergencies were (40.0%), Cardiology specialties (69.8 %), Dental (87.4 %) and Physiotherapy (97.0%) relative to other clinics. These rates indicated high inter-hospital variability in waiting times across various clinics.
It is not clear whether the hospital had introduced any initiatives to reduce waiting times for consultant appointments at its clinics. Hence, the impacts of such initiatives, if any, cannot be determined. From qualitative data, outpatients who experienced longer waiting times had high rates of dissatisfaction with hospital services. Waiting times show the accessibility of services at Burjeel Hospital and are not always perfect but easily be evaluated to indicate the quality of outpatient care at different departments. Low rates of outpatient satisfaction with the quality of care at Burjeel Hospital show that the hospital should focus on underlying causes of long waiting times at various departments.
Discussion
The study investigated rates of outpatient waiting times and patient and healthcare worker satisfaction at Burjeel Hospital. Based on the findings, the study hypothesis that reducing waiting times will affect customer and employee satisfaction positively was confirmed. Conversely, the null hypothesis that reducing waiting times will have no impact on customer and employee satisfaction was rejected.
It is noteworthy that outpatient waiting times differed across various clinics at Burjeel Hospital.
This study found similar results as compared to past studies on outpatient waiting times and customer and employee satisfaction. For instance, Bielen and Demoulin (174) found that customers considered their service satisfaction and waiting time satisfaction to determine their levels of loyalty to any healthcare facility. As a result, outpatient waiting times influenced patient and employee satisfaction, as well as their loyalty to hospitals (Bielen & Demoulin, 2007). This implies that outpatients who have experienced extended delays at clinics at Burjeel Hospital have low rates of customer satisfaction and loyalty for healthcare facilities and clinics.
Poor rates of outpatient waiting times at Burjeel Hospital emergency department should be a source of concern for patients and healthcare workers. A previous study had established that waiting times in emergency departments could lead to adverse effects, particularly for patients who are not admitted (Guttmann, Schull, Vermeulen, & Stukel, 2011). Given the high volumes of patients at emergency departments, lengthening waiting time is considered a risk.
Hence, Guttmann et al. (2011) noted that greater risks of adverse effects, including high mortality rates and admission of patients, are important to consider. Healthcare providers should review factors such as characteristics of patients, shift management, and the hospital environment to reduce waiting time and adverse events on patients. This study did not review appointment models used by different clinics at Burjeel Hospital. However, studies had shown that the appointment system as a model for reducing physicians’ idle time and outpatient waiting time was imperative for evaluation (Mardiah & Basri, 2013). Mardiah and Basri (2013) furthered showed that long waits and short consultations were factors that contributed to patients’ complaints and dissatisfaction.
As patients continue to experience long waiting times at Burjeel Hospital, they are most likely to use such services less often. Pizer and Prentice (2011) had determined that long waiting times were associated with a decrease in the use of healthcare services and poorer health outcomes. There was a statistically significant decrease in the use of healthcare services and related poorer health outcomes due to longer waiting times, particularly among vulnerable patients. Cases of preventable hospitalization, deaths, and transitional outcomes are common for populations at greater risks who seek medical care at hospitals with long queues (Pizer & Prentice, 2011). It is, therefore, imperative to identify patients who face greater risks because of long waiting times.
This study did not focus on factors that contributed to longer waiting times at certain clinics in Burjeel Hospital. Nevertheless, past studies have proposed various methods to improve waiting for time outcomes and patient and employee satisfaction at hospitals. These studies have acknowledged waiting time was a critical indicator of the quality of care in hospitals and therefore, directly affected patient and healthcare employee satisfaction.
Therefore, other studies had proposed various methods to reduce outpatient waiting times in hospitals. Mijailovic et al. (2014) had proposed a data-driven tool to evaluate staffing issues, the number of patients, the extent of care, capacity, and workflow processes to achieve a sustainable reduction in outpatient waiting time.
In addition, Aeenparast, Tabibi, Shahanaghi, and Aryanejhad (2013) noted that simulation techniques could be used to review waiting time aspects like scheduling appointments, increasing patient flow, and changing the workforce capacity to improve outpatient-waiting times. Mercieca, Cassar, and Borg (2014) focused on patients’ views and expectations and patients as important stakeholders required to improve processes using quality models. Dinesh, Singh, Nair, and Remya (2013) demonstrated that a six sigma model could be used to reduce waiting time while Stewart, Horgan, Garnick, Ritter, and McLellan (2013) claimed that performance management and quality improvement programs could result in short waiting time and length of stay. Finally, other researchers demonstrated that culturally competent practices, such as addressing language barriers, could result in reduced waiting times and retention (Guerrero & Andrews, 2011).
Conclusion
Outpatient waiting times at various clinics at Burjeel Hospital should be reduced to the lowest rates possible because of their adverse effects on patient and employee satisfaction and adverse health outcomes. The viable options to attain a long-term sustainable reduction in outpatient waiting times depend on the identified and solved bottlenecks at each clinic. These may include proper staffing strategies, effective use of available resources, cultural competence, and implementing new schedule management solutions, among others.
References
Aeenparast, A., Tabibi, S. J., Shahanaghi, K., & Aryanejhad, M. B. (2013). Reducing Outpatient Waiting Time: A Simulation Modeling Approach. Iranian Red Crescent Medical Journal, 15(9), 865–869. Web.
Bielen, F., & Demoulin, N. (2007). Waiting time influence on the satisfaction‐loyalty relationship in services. Managing Service Quality: An International Journal, 17(2), 174 – 193. Web.
Dinesh, T. A., Singh, S., Nair, P., & Remya, T. R. (2013). Reducing waiting time in outpatient services of large university teaching hospital – a six sigma approach. 17(1). Web.
Guerrero, E., & Andrews, C. M. (2011). Cultural competence in outpatient substance abuse treatment: measurement and relationship to wait time and retention. Drug and Alcohol Dependence, 119(1-2), e13-22. Web.
Guttmann, A., Schull, M. J., Vermeulen, M. J., & Stukel, T. A. (2011). Association between waiting times and short term mortality and hospital admission after departure from emergency department: population based cohort study from Ontario, Canada. British Medical Journal, 342. Web.
Johnson, R. B., & Onwuegbuzie, A. J. (2004). Mixed Methods Research: A Research Paradigm Whose Time Has Come. Educational Researcher, 33(7), 14–26. Web.
Mardiah, F. P., & Basri, M. H. (2013). The Analysis of Appointment System to Reduce Outpatient Waiting Time at Indonesia’s Public Hospital. Human Resource Management Research, 3(1), 27-33. Web.
Mercieca, C., Cassar, S., & Borg, A. A. (2014). Listening to patients: improving the outpatient service. International Journal of Health Care Quality Assurance, 27(1), 44 – 53. Web.
Mijailovic, A. S., Tanasijevic, M. J., Goonan, E. M., Le, R. D., Baum, J. M., & Melanson, S. E. (2014). Optimizing outpatient phlebotomy staffing: tools to assess staffing needs and monitor effectiveness. Archives of Pathology & Laboratory Medicine, 138(7), 929-35. Web.
Pizer, S. D., & Prentice, J. C. (2011). What Are the Consequences of Waiting for Health Care in the Veteran Population? Journal of General Internal Medicine, 26(Suppl 2), 676–682. Web.
Stewart, M. T., Horgan, C. M., Garnick, D. W., Ritter, G., & McLellan, T. (2013). Performance Contracting and Quality Improvement in Outpatient Treatment: Effects on Waiting Time and Length of Stay. Journal of Substance Abuse Treatment, 44(1), 27–33. Web.
Appendix
Table 1: Patient Analysis overall waiting time across various clinics at Burjeel Hospital.