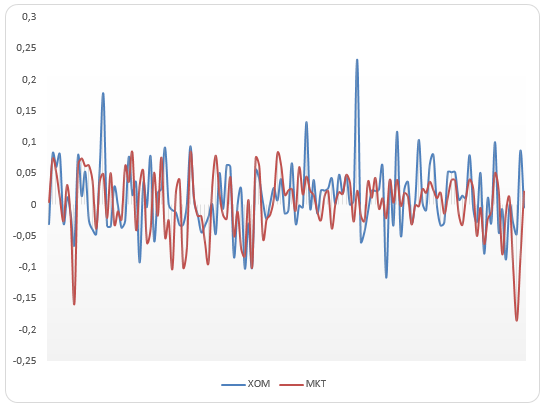
Relative fluctuations of Mobil-Exxon (XOM) and market returns

As the above graph portrays, XOM returns have been fluctuating considerably from the market returns over the period covered by the data. Although some of the fluctuations of the stock have been in the opposite direction to that of the market portfolio, most of the fluctuations have been in the same direction with the market.
Descriptive statistics of monthly returns of General Electric (GE), General Motors (GM), IBM, and Disney (DIS) data
The average return represents the mean of a stock’s return over a given period (Lakonishok 1994). It indicates the return that an investor could have received if his or her holding period corresponded to the period covered by the stock returns (Jensen 1968). IBM, DIS, and GE stocks have a positive average over the period covered while GM has a negative average over the same period. The average of DIS and GE is nearly the same.
The variance is a measure of dispersion and it indicates how individual returns of stock vary from the mean or average return (Kothari 1995). As indicated in the above table, GM stock had the largest variance over the period followed by IBM. GE stock, on the other hand, registered the least variance over the period. The variance measures the risk of a stock (Shapiro 1986). The higher the variance the higher the risk of the related stock (Pandey 2008). Therefore, GM stock has the highest risk in this case while GE stock has the lowest risk.
The standard deviation is the square root of the variance and it indicates the average dispersion of individual stock returns from the average (Jegadeesh 1993). As shown in the table, GM has the highest standard deviation and GE the lowest.
CAPM model for Microsoft and GM
Microsoft: Rms= 1.174(Rm-Rf) + 0.043.
Where Rms=expected return on Microsoft stock.
1.174 is the beta value for Microsoft stock.
(Rm-Rf)=risk premium.
0.043 is the alpha value for Microsoft stock.
GM: RGm=1.061(Rm-Rf) + 0.22.
Where RGm=expected return on GM stock.
1.06 is the beta value.
0.22 is the alpha value of GM stock.
The estimated beta of Microsoft stock, 1.174, and the estimated beta of GM stock, 1.061, are all above the value of 1. This shows that the two stocks are aggressive and they move in the same direction with the returns of the market portfolio (Sharpe 2010).
Alpha Value
Theoretically, the value of alpha should be zero if a stock is not mispriced. A positive alpha indicates undervalued stocks while a negative alpha indicates overvalued stocks. Therefore, since both Microsoft and GM stocks had positive alphas, they were undervalued over the period covered by the data.
- Standard deviation = √R2 =√0.286=0.535 (R2=Coefficient of determination. For the Microsoft CAPM equation it is equal to 0.286)
Z=(µav-µ0)/(α√n).
Where z = the level of statistical significance.
µav=average beta in this case 1.174.
µ0=Null hypothesis beta in this case 1.
α=standard deviation equal to 0.535.
n=number of observations in this case 132.
z= (1.174-1)/(0.535√132)=0.028.
The level of significance of 0.028 is above 10 percent. Thus, the financial consultants’ claim of 1 percent beta is rejected.
- Rms-Rf=βms.(Rm-Rf)-Rf + αms
Where Rms-Rf=risk premium on Microsoft stock.
βms =Beta of Microsoft stock which is 1.174.
(Rm-Rf)= Risk premium on the market portfolio.
Rf =Risk-free rate in this case average risk-free rate equal to 0.032.
αms=Alpha of Microsoft stock equal to 0.043.
If the risk premium on market portfolio is 2%, Rms-Rf=(1.174 x 0.02)-0.032+0.043 = 0.03448.
If the risk premium on market portfolio is 7%, Rms-Rf=(1.174×0.07) -0.032+0.043=0.09318.
References
Jegadeesh, N 1993, ‘Returns to Buying Winners and Selling Losers: Implications for Stock Market Efficiency’, Journal of Finance, 48:1, pp. 65–91.
Jensen, C 1968, ‘The Performance of Mutual Funds in the Period 1945–1964’, Journal of Finance, 23:2, pp. 389–416.
Kothari, S 1995, ‘Another Look at the Cross-Section of Expected Stock Returns’, Journal of Finance, 50:1, pp. 185–224.
Lakonishok, J 1994, ‘Contrarian Investment, Extrapolation, and Risk’, Journal of Finance, 49:5, pp. 1541–578.
Pandey, I 2008, Financial Management, PHI Learning, New Delhi.
Shapiro, C 1986, ‘Systematic Risk, Total Risk, and Size as Determinants of Stock Market Returns’, Journal of Banking and Finance, 10:1, pp. 115–32.
Sharpe, W 2010, Investments, Prentice-Hall, London.