Introduction
The evaluation methods used in statistics provide the different ways of interpreting the data obtained in the process of analysis and research. By compiling histograms, graphs, and other visual display tools, it is possible to convey certain correlation characteristics and demonstrate the relationships between individual variables. As an example of such an assessment, this study aims to determine the statistical interaction between the distribution of systolic blood pressure tabulated by age and contraceptive drug use for women. Compiling histograms and analyzing variables may allow determining the characteristic signs of deviations and dependencies and identifying major trends.
Continuous and Discrete Variables
In order to analyze the results of the evaluation of variables and their interactions, it is essential to determine their type to have an idea of the basic measurement methods. According to the study conducted by Takeda, Fuwa, van Loock, and Furusawa (2015), those variables whose value can be estimated through calculations are discrete. The same study suggests that continuous variables may be assessed through measurements (Takeda et al., 2015). When grouping the data from the analyzed table, it can be noted that the systolic pressure index is a continuous variable since to determine it, no calculations are required. Accordingly, while estimating such a variable as the number of women taking or not taking contraceptive drugs, it can be argued that it will be discrete. The study participants are not measured according to specific parameters and quantities like blood pressure indicators and are evaluated by their number.
Histograms
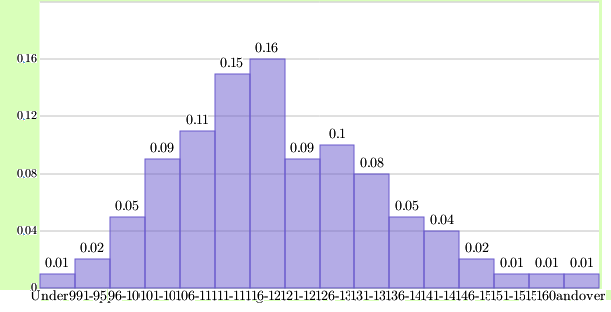
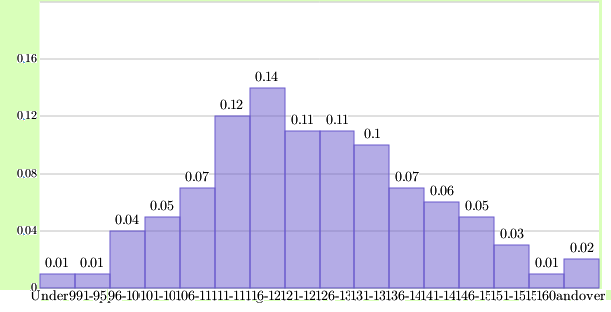
In order to correlate the analyzed data visually and obtain a comprehensive picture, histograms will be compiled. These tools will provide an opportunity to present the ratio of two separate categories of correlations. In Figure 1, the prevalence of women who do not take contraceptive drugs and their systolic blood pressure indices will be reflected. In Figure 2, a similar principle will be applied, but as a target group, user women will be involved. The data in both histograms will make it possible to assess the ratio of variables and the prevalence of certain trends.


Based on the data obtained, it can be noted that drug intake affects the maintenance of normal pressure adversely. In comparison with the second category, the number of women not taking drugs and having elevated rates is smaller. This result suggests that contraceptives may be contraindicated for women with elevated systolic pressure. Also, it is crucial to note that individual health parameters are the decisive criterion.
Normal Approximation of Data
In order to evaluate the findings, the normal approximation of data is a relevant mechanism. According to Emura and Lin (2015), this principle implies using standard scales and curves to measure the distribution of the results of calculations. For the case under consideration, the percentage of women with certain pressure indicators may be obtained easily. It is enough to make a standard histogram to see the number of participants with specific indicators. Therefore, this principle of measurement is optimal in this analysis.
Conclusion
When summarizing the results, it can be noted that key trends and signs in the assessment of the ratio of systolic blood pressure and the use of contraceptive drugs may be obtained by compiling histograms and evaluating variables. Based on the outcomes, it can be noted that the drugs in question can have a negative effect on the level of pressure in women of the age group from 35 to 44. The normal approximation of data is a convenient and suitable method for measuring the information obtained.
References
Emura, T., & Lin, Y. S. (2015). A comparison of normal approximation rules for attribute Control charts. Quality and Reliability Engineering International, 31(3), 411-418. Web.
Takeda, S., Fuwa, M., van Loock, P., & Furusawa, A. (2015). Entanglement swapping between discrete and continuous variables. Physical Review Letters, 114(10), 100501. Web.